| Param | Original file | Final file |
|---|---|---|
| Filename | modeM0/AS1C07_004T01_9000004990_34763cztM0_level2.evt | modeM0/AS1C07_004T01_9000004990_34763cztM0_level2_quad_clean.evt |
| Size (bytes) | 866,347,200 | 131,927,040 |
| Size | 826.2 MB | 125.8 MB |
| Events in quadrant A | 4,881,284 | 829,623 |
| Events in quadrant B | 5,735,018 | 836,916 |
| Events in quadrant C | 5,312,876 | 830,563 |
| Events in quadrant D | 9,590,991 | 763,140 |
| Mode M9 | |||
|---|---|---|---|
| Quadrant | BADHDUFLAG | Total packets | Discarded packets |
| A | 0 | 28 | 0 |
| B | 0 | 28 | 0 |
| C | 0 | 28 | 0 |
| D | 0 | 28 | 0 |
| Mode M0 | |||
|---|---|---|---|
| Quadrant | BADHDUFLAG | Total packets | Discarded packets |
| A | 0 | 21623 | 3 |
| B | 0 | 23938 | 2 |
| C | 0 | 22337 | 2 |
| D | 0 | 35941 | 2 |
| Mode SS | |||
|---|---|---|---|
| Quadrant | BADHDUFLAG | Total packets | Discarded packets |
| A | 0 | 216 | 0 |
| B | 0 | 216 | 0 |
| C | 0 | 216 | 0 |
| D | 0 | 216 | 0 |
| Quadrant | Total seconds | Saturated seconds | Saturation percentage |
|---|---|---|---|
| A | 10617 | 20 | 0.188377% |
| B | 10617 | 63 | 0.593388% |
| C | 10617 | 40 | 0.376754% |
| D | 10617 | 815 | 7.676368% |
Noise dominated data is calculated using 1-second bins in cleaned event files. If a bin has >2000 counts, and if more than 50% of those come from <1% of pixels, then it is considered to be noise-dominated and hence unusable.
| Quadrant | # 1 sec bins | Bins with >0 counts | Bins with >2000 counts | High rate bins dominated by noise | Noise dominated (total time) | Noise dominated (detector-on time) | Marked lightcurve |
|---|---|---|---|---|---|---|---|
| A | 13453 | 10619 | 2 | 2 | 0.01% | 0.02% | 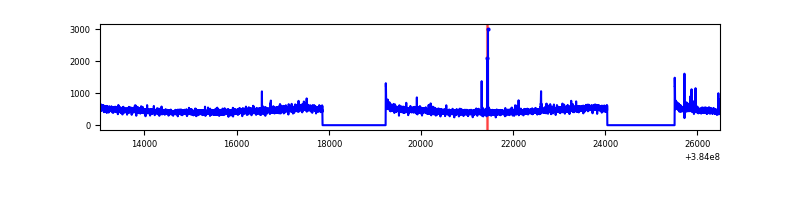 |
| B | 13453 | 10619 | 27 | 27 | 0.20% | 0.25% | 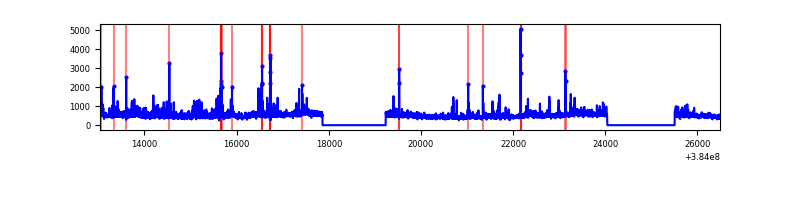 |
| C | 13453 | 10619 | 21 | 21 | 0.16% | 0.20% | 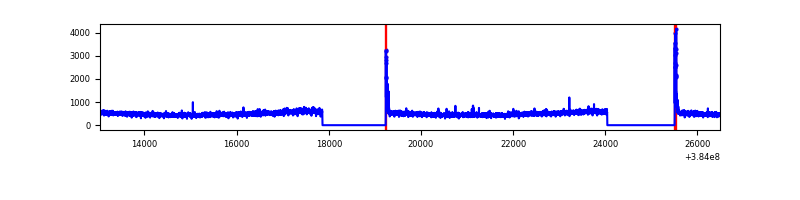 |
| D | 13452 | 10618 | 613 | 613 | 4.56% | 5.77% | 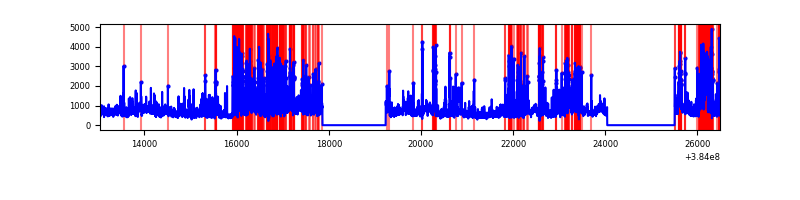 |
Top three noisy pixels from each quadrant. If the there are fewer than three noisy pixels in the level2.evt file, extra rows are filled as -1
| Pixel properties | Quadrant properties | ||||||
|---|---|---|---|---|---|---|---|
| Quadrant | DetID | PixID | Counts | Sigma | Mean | Median | Sigma |
| A | 10 | 83 | 69943 | 280.32 | 1226 | 1203 | 245.2 |
| A | 15 | 169 | 28238 | 110.25 | 1226 | 1203 | 245.2 |
| A | 13 | 6 | 19248 | 73.59 | 1226 | 1203 | 245.2 |
| B | 0 | 189 | 327231 | 1386.6 | 1227 | 1195 | 235.1 |
| B | 0 | 190 | 190110 | 803.44 | 1227 | 1195 | 235.1 |
| B | 5 | 172 | 178714 | 754.97 | 1227 | 1195 | 235.1 |
| C | 15 | 214 | 447818 | 1610.01 | 1194 | 1206 | 277.4 |
| C | 0 | 10 | 114279 | 407.62 | 1194 | 1206 | 277.4 |
| C | 14 | 67 | 66772 | 236.36 | 1194 | 1206 | 277.4 |
| D | 8 | 195 | 1811635 | 6411.02 | 1153 | 1119 | 282.4 |
| D | 2 | 250 | 1771500 | 6268.9 | 1153 | 1119 | 282.4 |
| D | 13 | 249 | 477490 | 1686.82 | 1153 | 1119 | 282.4 |
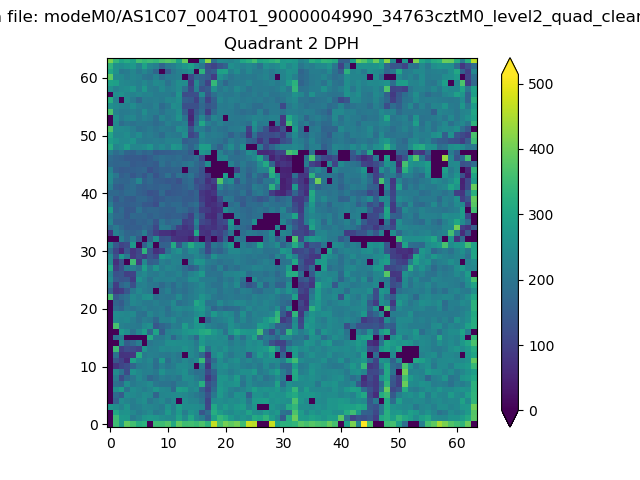
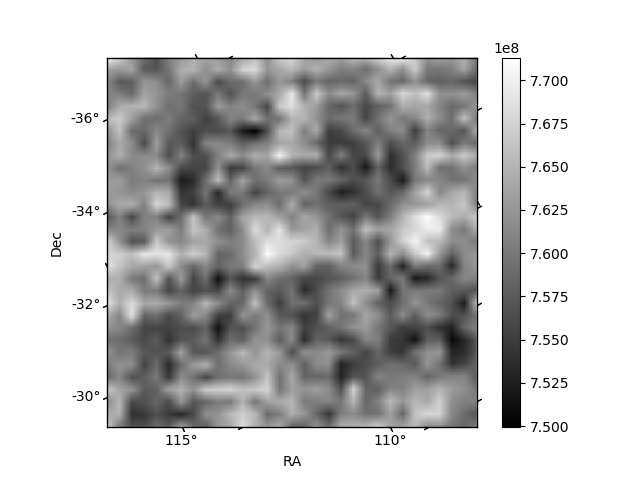
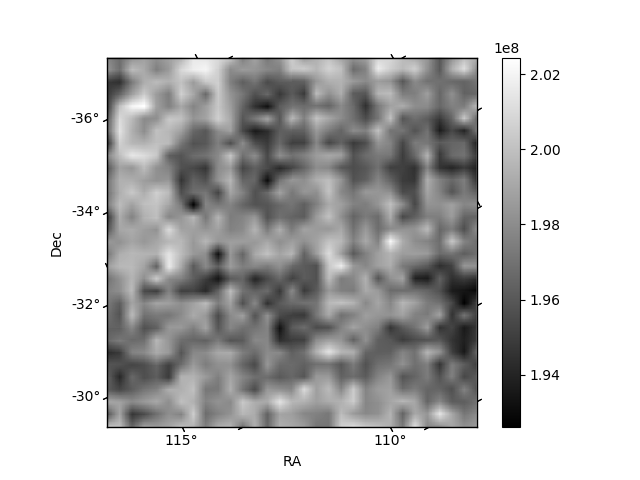
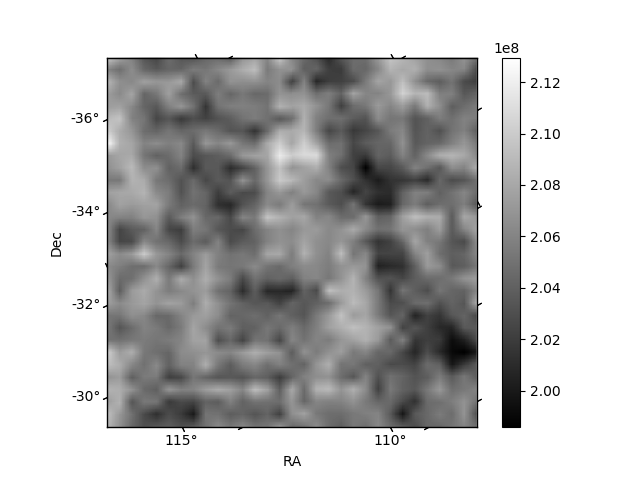
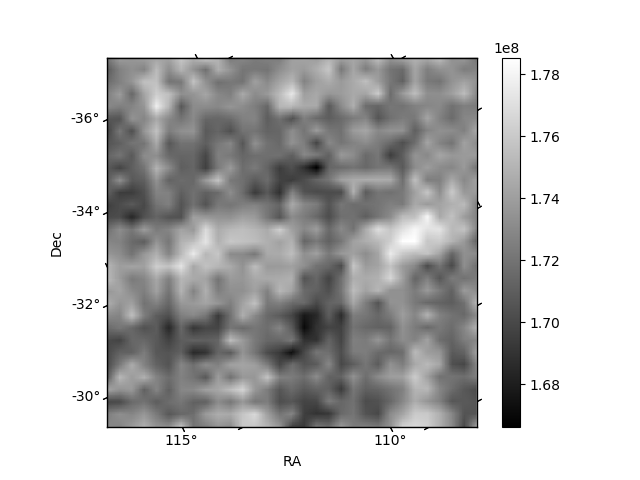
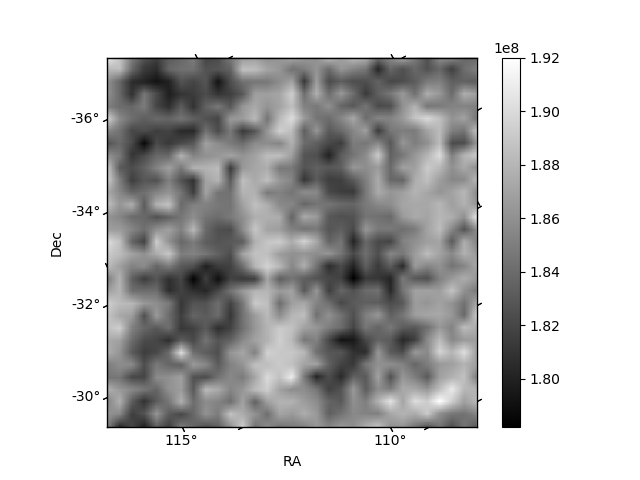
Histogram calculated using DETX and DETY for each event in the final _common_clean file
| Quadrant A | 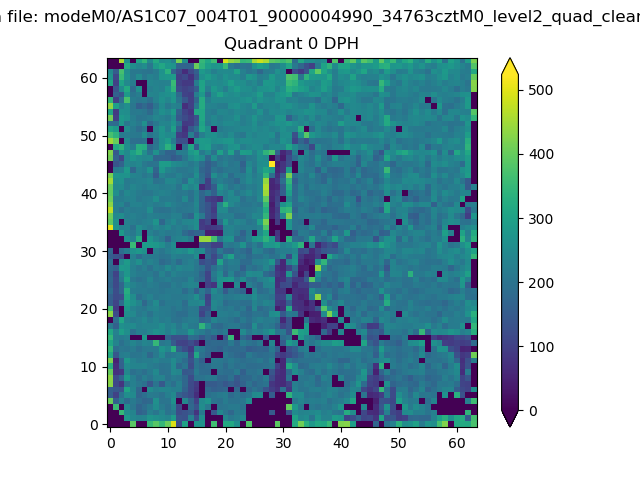 |
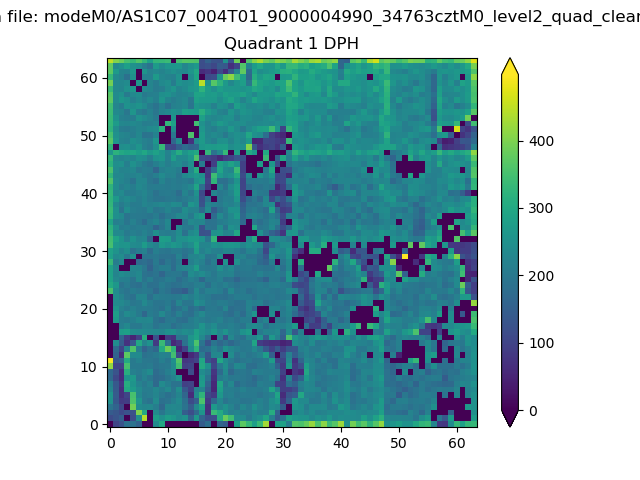 |
Quadrant B |
|---|---|---|---|
| Quadrant D | 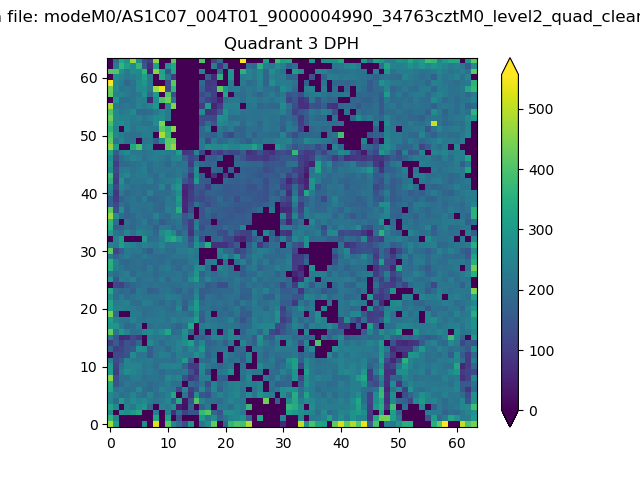 |
 |
Quadrant C |
| Plot type | Count rate plots | Images |
|---|---|---|
| Comparison with Poisson distribution Blue bars denote a histogram of data divided into 1 sec bins. Red curve is a Poisson curve with rate = median count rate of data. |
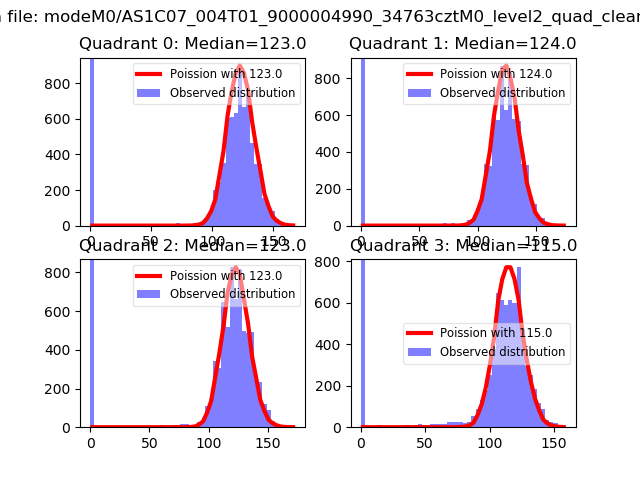 |
 |
| Quadrant-wise count rates Data is divided into 100 sec bins |
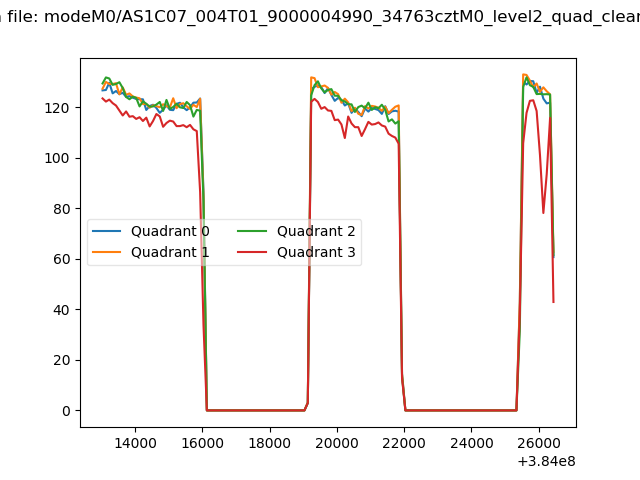 |
|
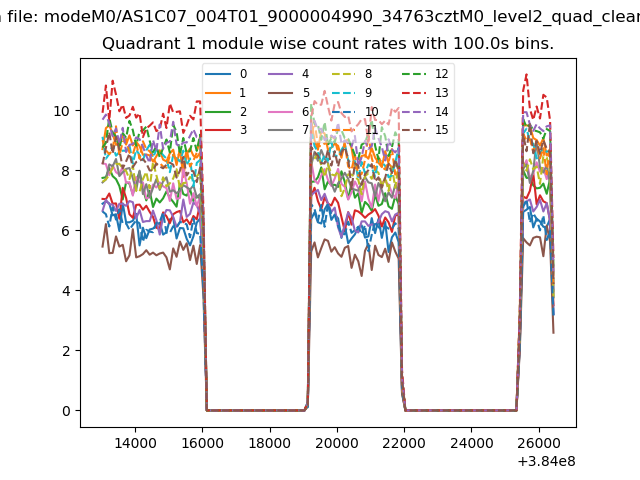
| Module-wise count rates for Quadrant A Data is divided into 100 sec bins |
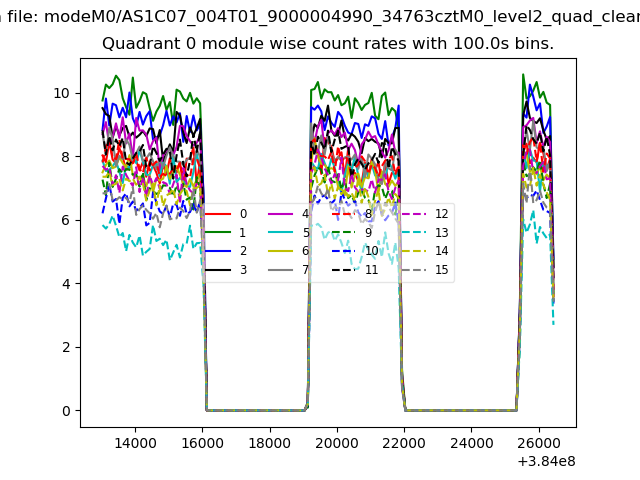 |
 |
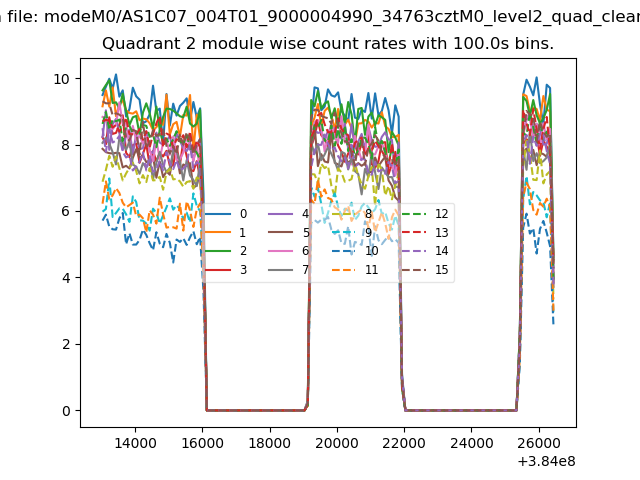
| Module-wise count rates for Quadrant B Data is divided into 100 sec bins |
 |
 |
| Module-wise count rates for Quadrant C Data is divided into 100 sec bins |
 |
 |
| Module-wise count rates for Quadrant D Data is divided into 100 sec bins |
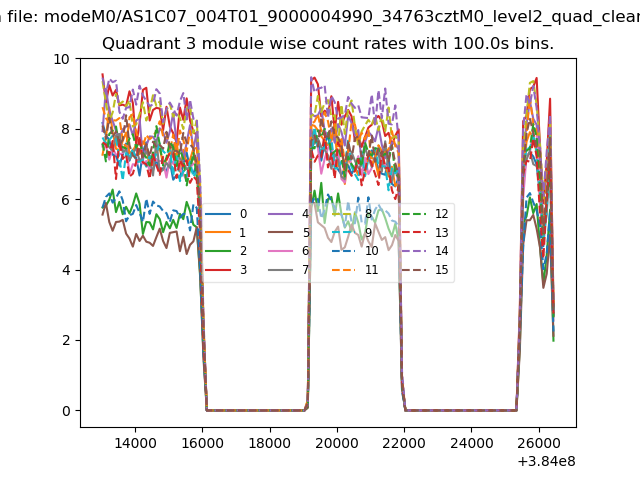 |
 |
| Parameter | Plot |
|---|---|
| CZT HV Monitor | 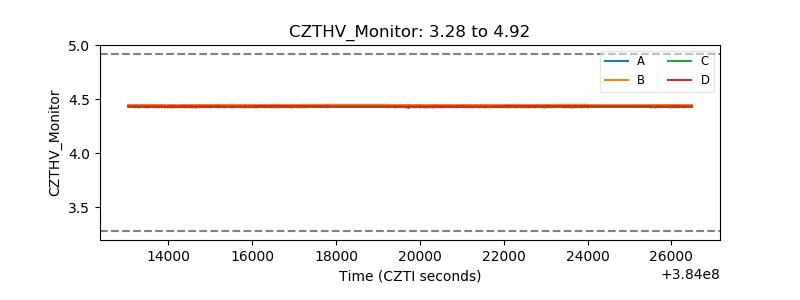 |
| D_VDD | 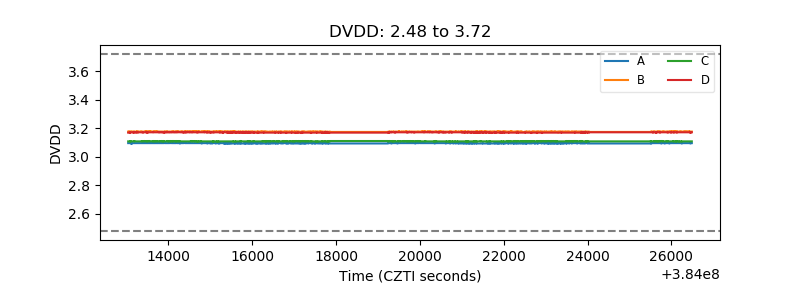 |
| Temperature 1 | 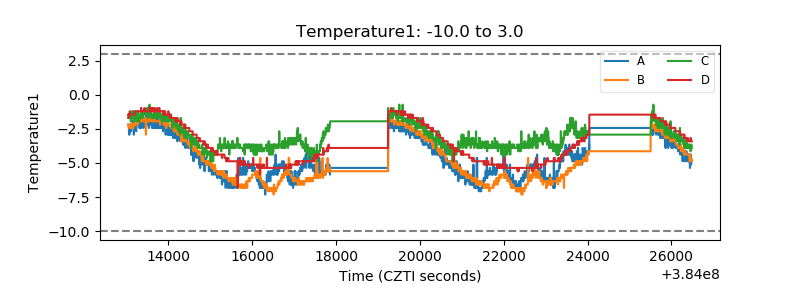 |
| Veto HV Monitor | 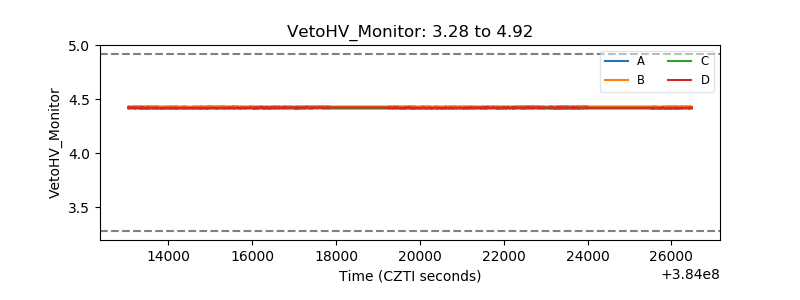 |
| Veto LLD | 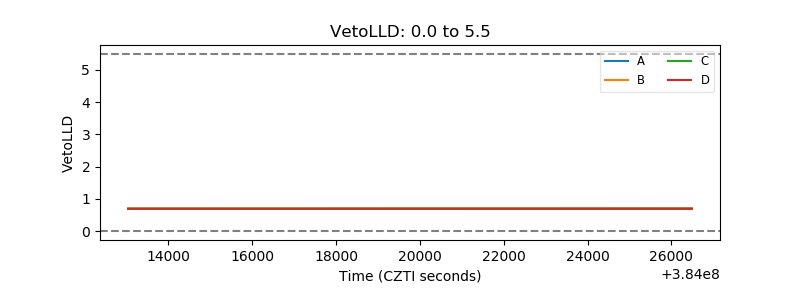 |
| Alpha Counter | 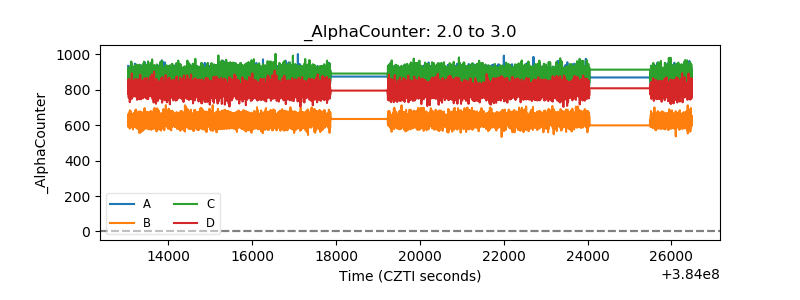 |
| _CPM_Rate | 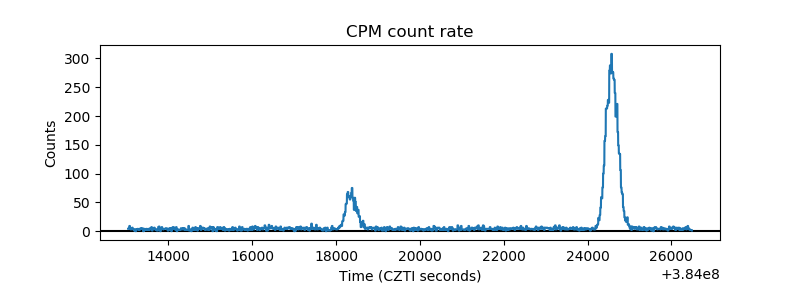 |
| CZT Counter | 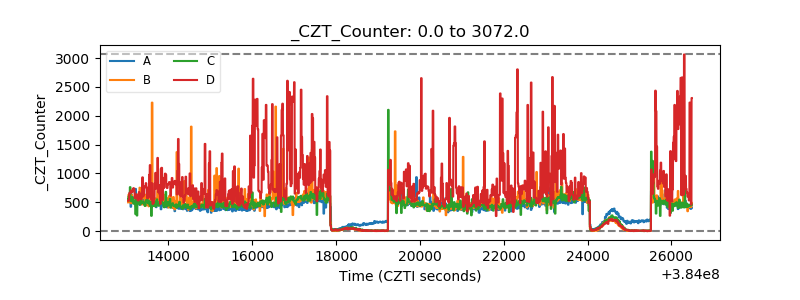 |
| +2.5 Volts monitor | 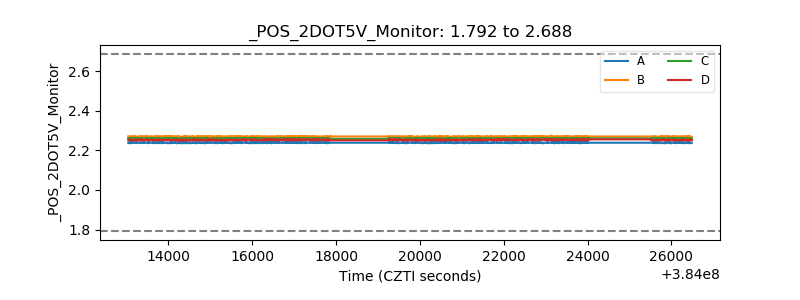 |
| +5 Volts monitor | 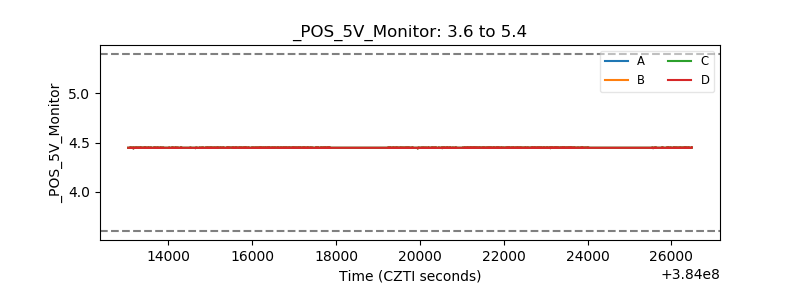 |
| _ROLL_ROT | 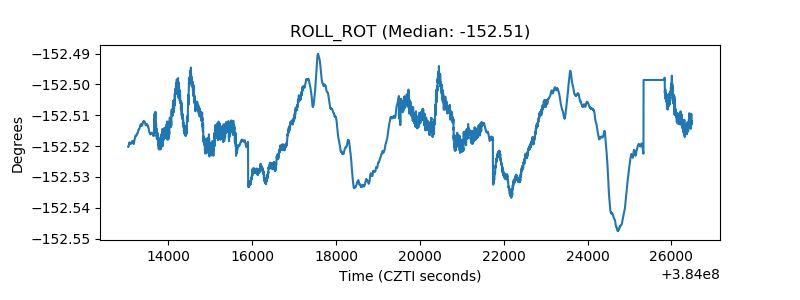 |
| _Roll_DEC | 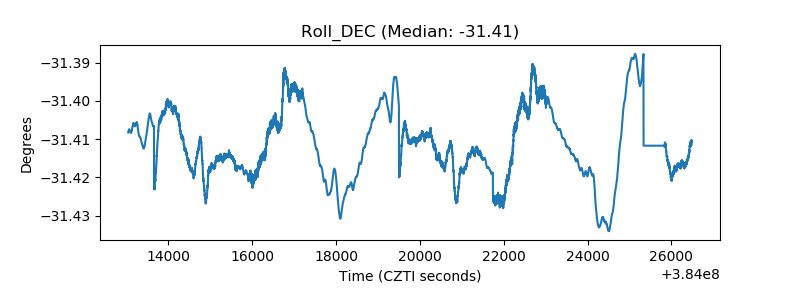 |
| _Roll_RA | 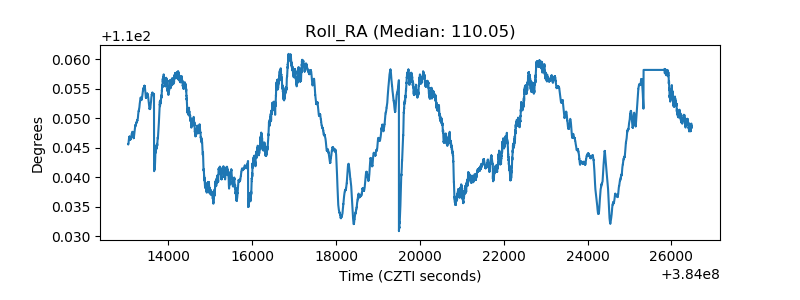 |
| Veto Counter | 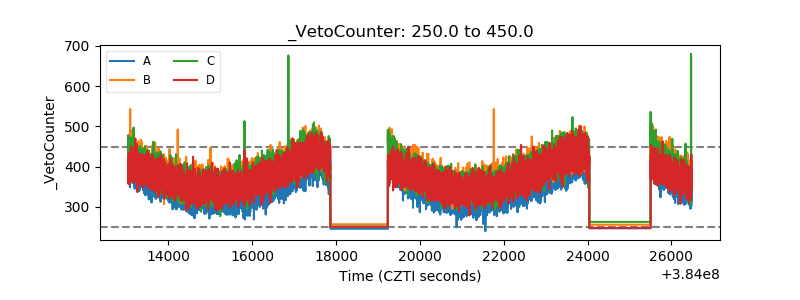 |