| Param | Original file | Final file |
|---|---|---|
| Filename | modeM0/AS1C07_004T01_9000004990_34756cztM0_level2.evt | modeM0/AS1C07_004T01_9000004990_34756cztM0_level2_quad_clean.evt |
| Size (bytes) | 570,769,920 | 47,940,480 |
| Size | 544.3 MB | 45.7 MB |
| Events in quadrant A | 2,551,067 | 295,164 |
| Events in quadrant B | 4,858,023 | 295,854 |
| Events in quadrant C | 2,890,314 | 304,598 |
| Events in quadrant D | 6,653,604 | 210,268 |
| Mode M9 | |||
|---|---|---|---|
| Quadrant | BADHDUFLAG | Total packets | Discarded packets |
| A | 0 | 26 | 0 |
| B | 0 | 26 | 0 |
| C | 0 | 26 | 0 |
| D | 0 | 27 | 0 |
| Mode M0 | |||
|---|---|---|---|
| Quadrant | BADHDUFLAG | Total packets | Discarded packets |
| A | 0 | 10217 | 3 |
| B | 0 | 17477 | 2 |
| C | 0 | 11408 | 2 |
| D | 0 | 23185 | 2 |
| Mode SS | |||
|---|---|---|---|
| Quadrant | BADHDUFLAG | Total packets | Discarded packets |
| A | 0 | 100 | 0 |
| B | 0 | 100 | 0 |
| C | 0 | 100 | 0 |
| D | 0 | 100 | 0 |
| Quadrant | Total seconds | Saturated seconds | Saturation percentage |
|---|---|---|---|
| A | 4915 | 11 | 0.223805% |
| B | 4915 | 923 | 18.779247% |
| C | 4915 | 38 | 0.773143% |
| D | 4915 | 1319 | 26.836216% |
Noise dominated data is calculated using 1-second bins in cleaned event files. If a bin has >2000 counts, and if more than 50% of those come from <1% of pixels, then it is considered to be noise-dominated and hence unusable.
| Quadrant | # 1 sec bins | Bins with >0 counts | Bins with >2000 counts | High rate bins dominated by noise | Noise dominated (total time) | Noise dominated (detector-on time) | Marked lightcurve |
|---|---|---|---|---|---|---|---|
| A | 7069 | 4916 | 4 | 4 | 0.06% | 0.08% | 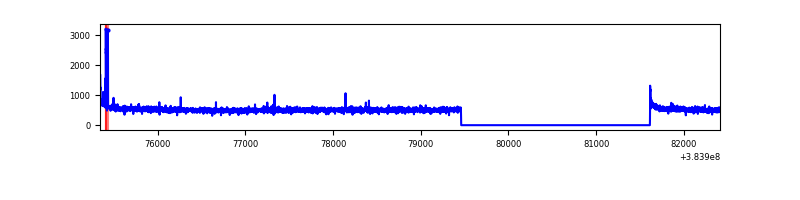 |
| B | 7069 | 4916 | 639 | 639 | 9.04% | 13.00% | 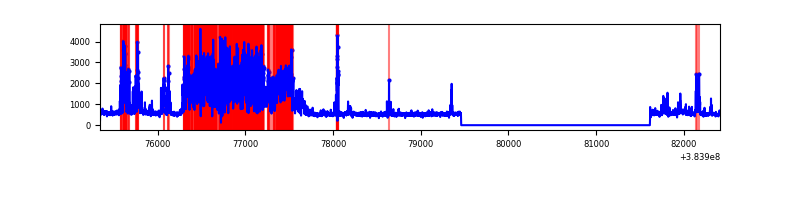 |
| C | 7069 | 4916 | 25 | 25 | 0.35% | 0.51% | 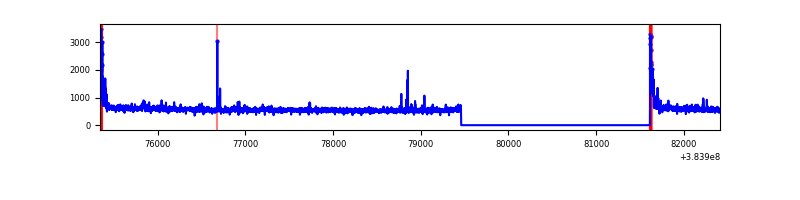 |
| D | 7069 | 4916 | 1092 | 1092 | 15.45% | 22.21% | 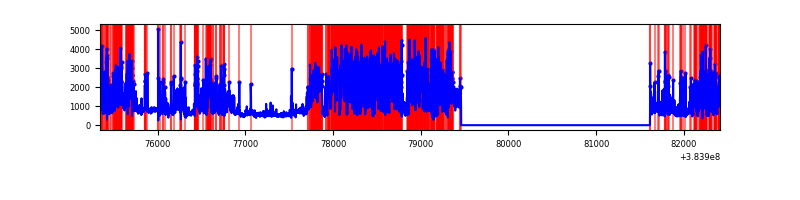 |
Top three noisy pixels from each quadrant. If the there are fewer than three noisy pixels in the level2.evt file, extra rows are filled as -1
| Pixel properties | Quadrant properties | ||||||
|---|---|---|---|---|---|---|---|
| Quadrant | DetID | PixID | Counts | Sigma | Mean | Median | Sigma |
| A | 10 | 83 | 47734 | 370.99 | 638 | 629 | 127.0 |
| A | 15 | 223 | 18943 | 144.24 | 638 | 629 | 127.0 |
| A | 13 | 6 | 12828 | 96.08 | 638 | 629 | 127.0 |
| B | 5 | 255 | 2386023 | 21036.76 | 600 | 586 | 113.4 |
| B | 5 | 172 | 34084 | 295.41 | 600 | 586 | 113.4 |
| B | 0 | 190 | 28301 | 244.41 | 600 | 586 | 113.4 |
| C | 15 | 214 | 211811 | 1452.01 | 632 | 640 | 145.4 |
| C | 0 | 10 | 129160 | 883.7 | 632 | 640 | 145.4 |
| C | 14 | 67 | 63660 | 433.33 | 632 | 640 | 145.4 |
| D | 2 | 250 | 2794846 | 20620.8 | 558 | 544 | 135.5 |
| D | 8 | 195 | 432562 | 3188.11 | 558 | 544 | 135.5 |
| D | 12 | 6 | 364275 | 2684.18 | 558 | 544 | 135.5 |
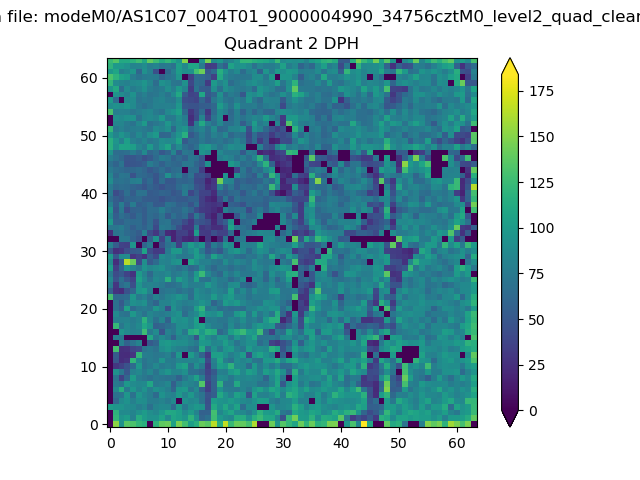
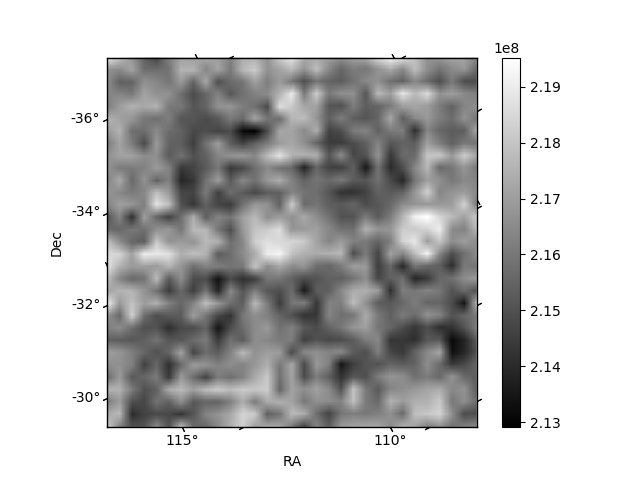
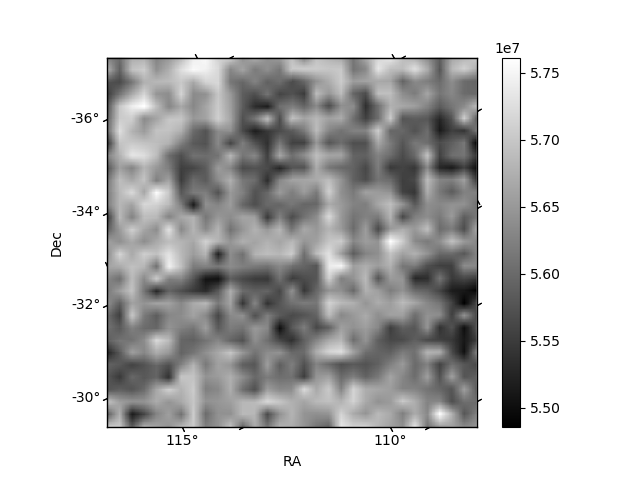
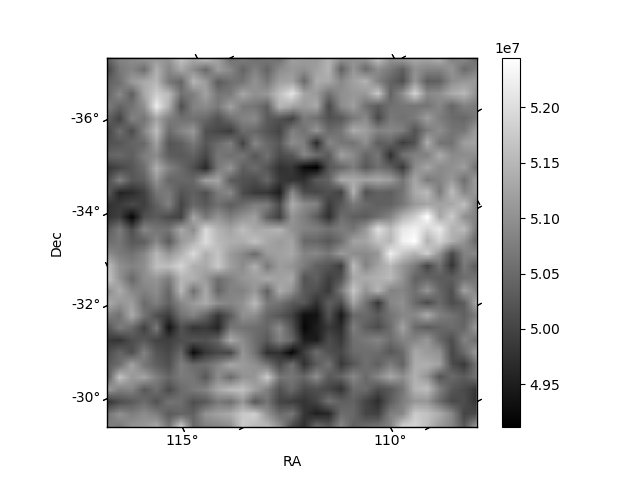
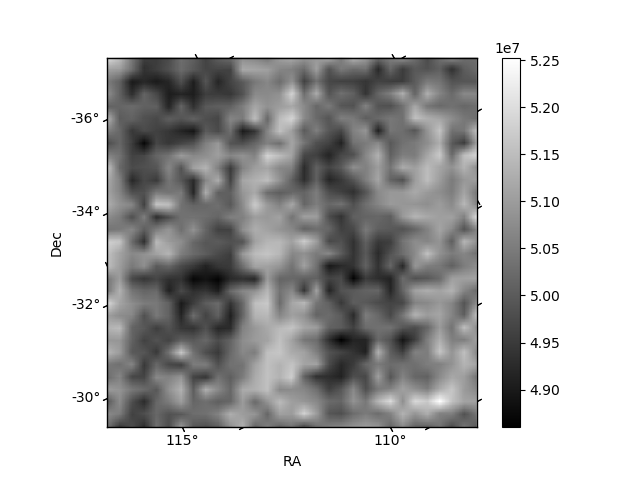
Histogram calculated using DETX and DETY for each event in the final _common_clean file
| Quadrant A | 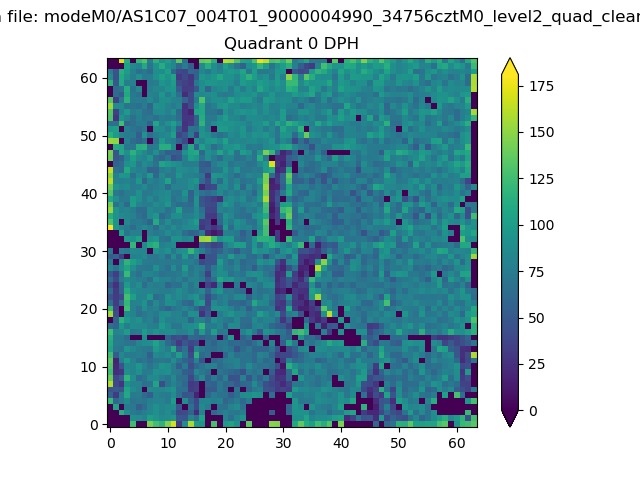 |
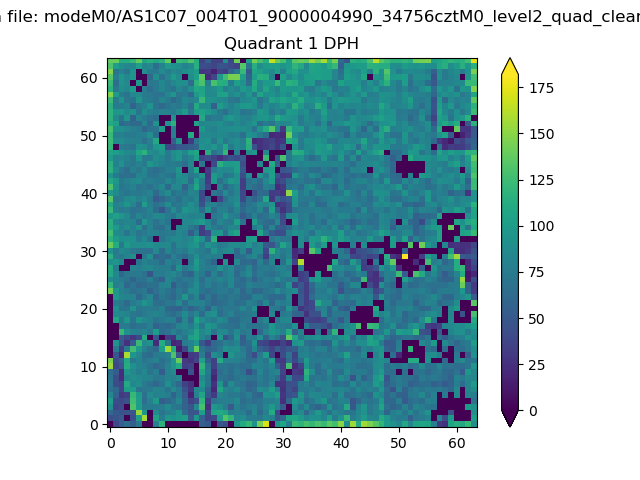 |
Quadrant B |
|---|---|---|---|
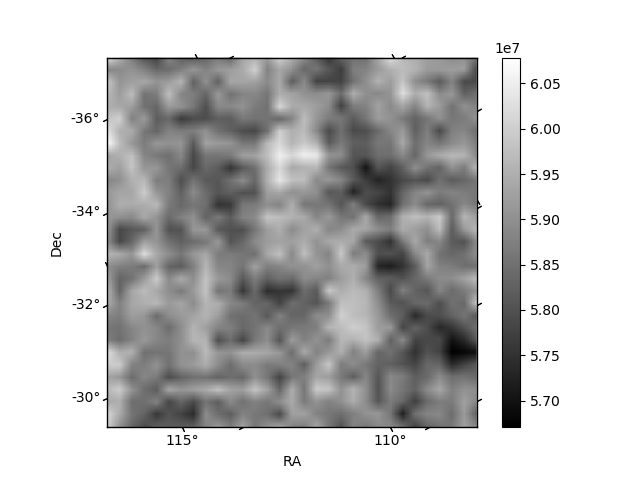
| Quadrant D | 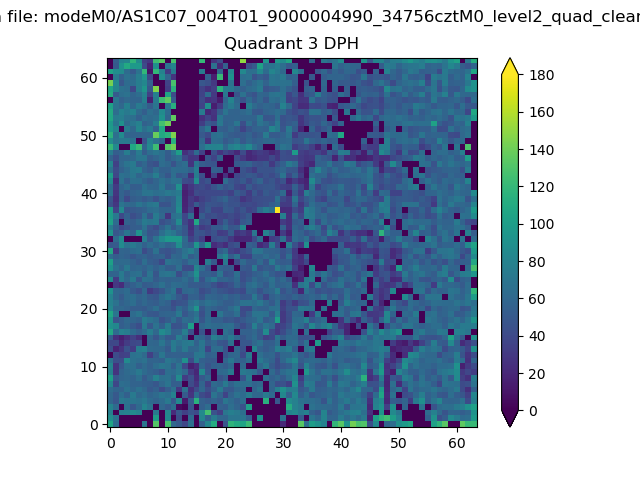 |
 |
Quadrant C |
| Plot type | Count rate plots | Images |
|---|---|---|
| Comparison with Poisson distribution Blue bars denote a histogram of data divided into 1 sec bins. Red curve is a Poisson curve with rate = median count rate of data. |
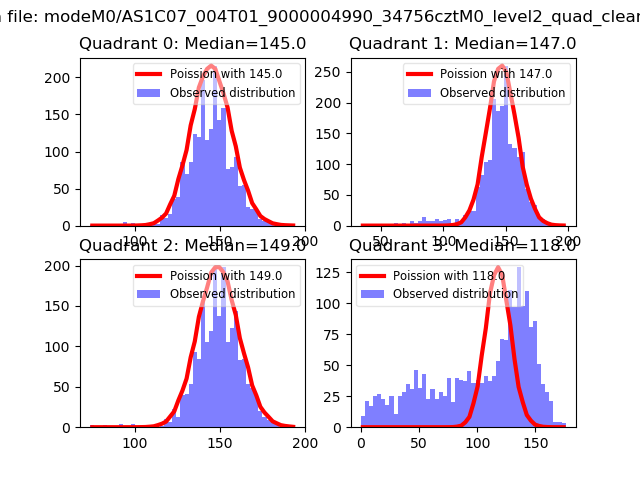 |
 |
| Quadrant-wise count rates Data is divided into 100 sec bins |
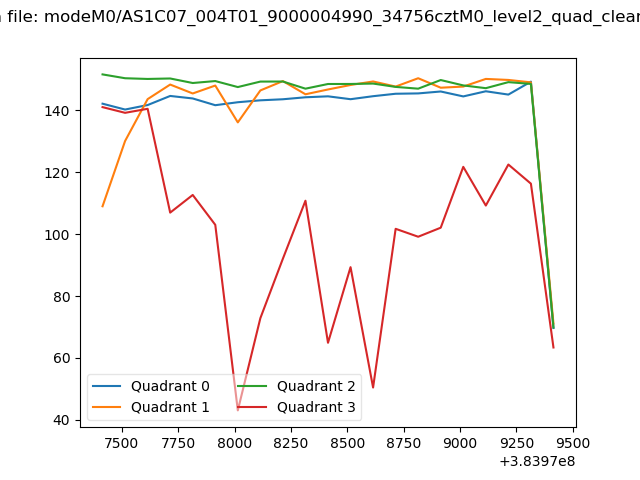 |
|
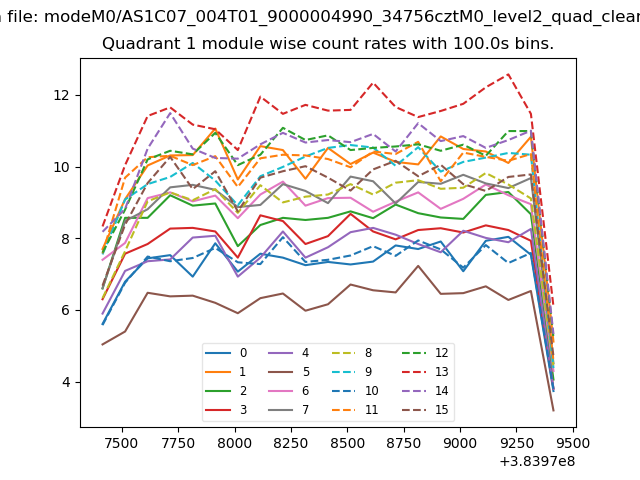
| Module-wise count rates for Quadrant A Data is divided into 100 sec bins |
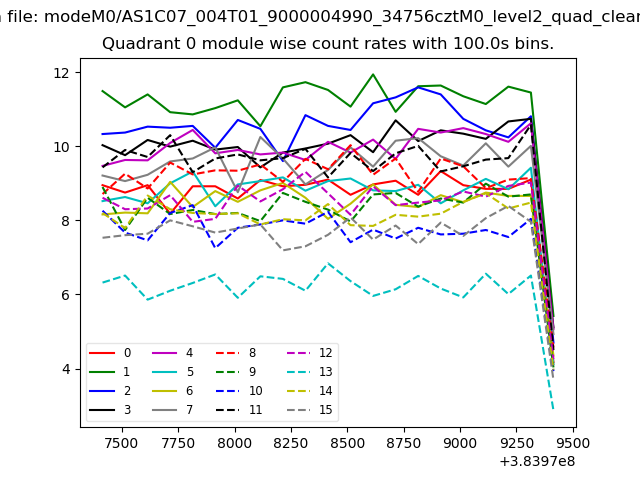 |
 |
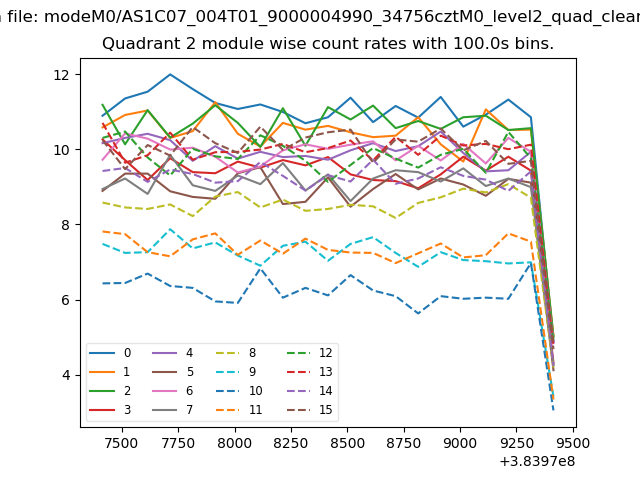
| Module-wise count rates for Quadrant B Data is divided into 100 sec bins |
 |
 |
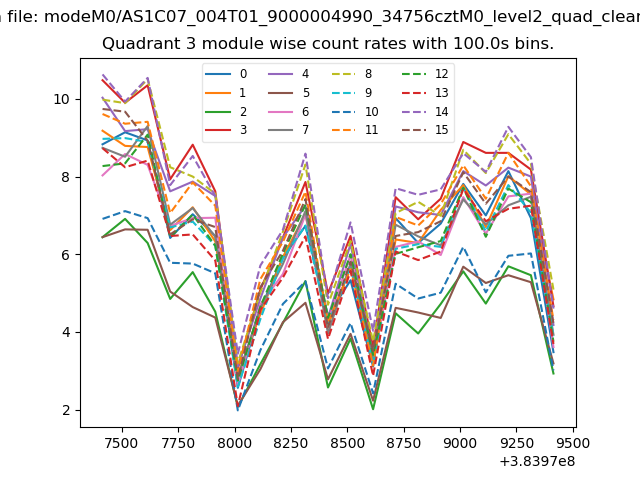
| Module-wise count rates for Quadrant C Data is divided into 100 sec bins |
 |
 |
| Module-wise count rates for Quadrant D Data is divided into 100 sec bins |
 |
 |
| Parameter | Plot |
|---|---|
| CZT HV Monitor | 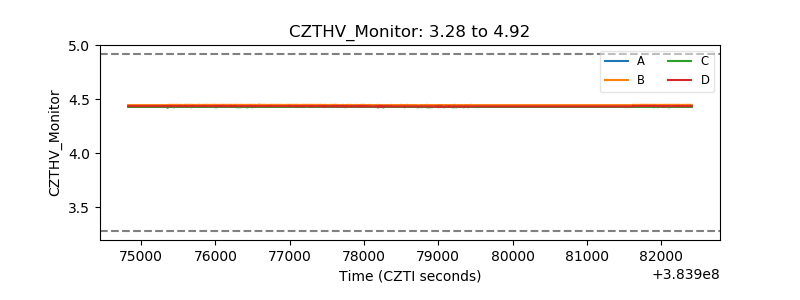 |
| D_VDD | 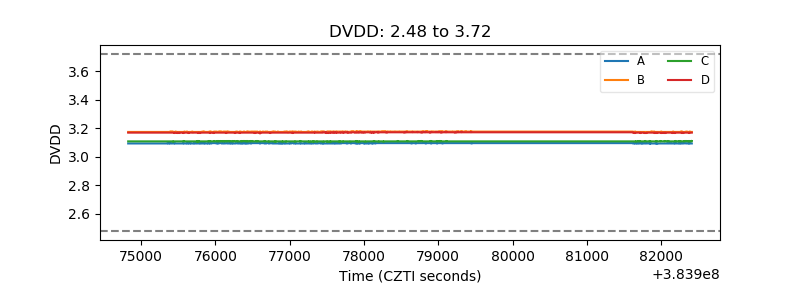 |
| Temperature 1 | 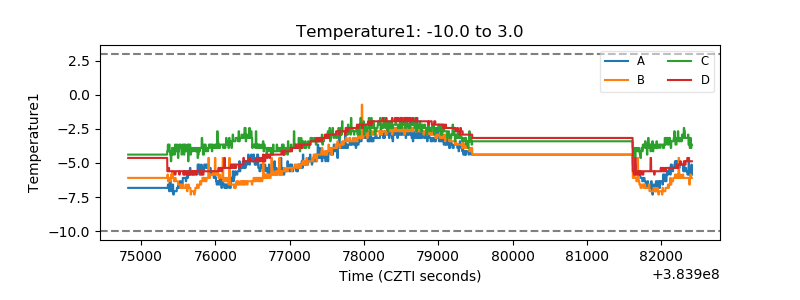 |
| Veto HV Monitor | 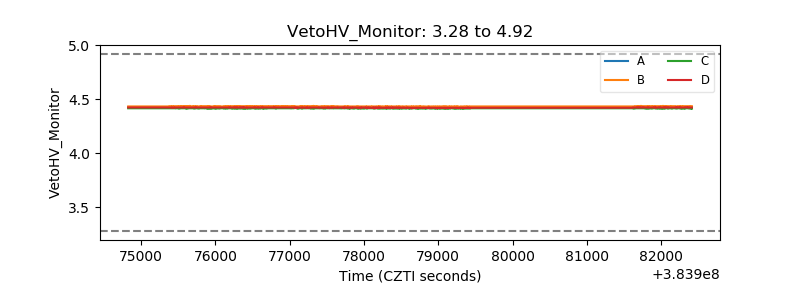 |
| Veto LLD | 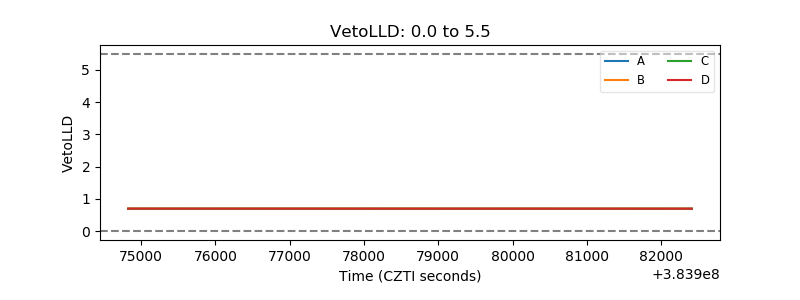 |
| Alpha Counter | 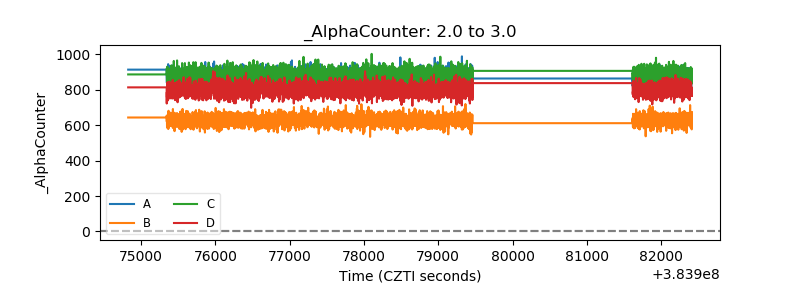 |
| _CPM_Rate | 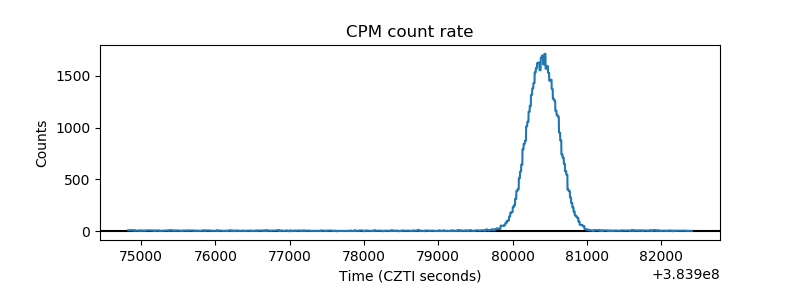 |
| CZT Counter | 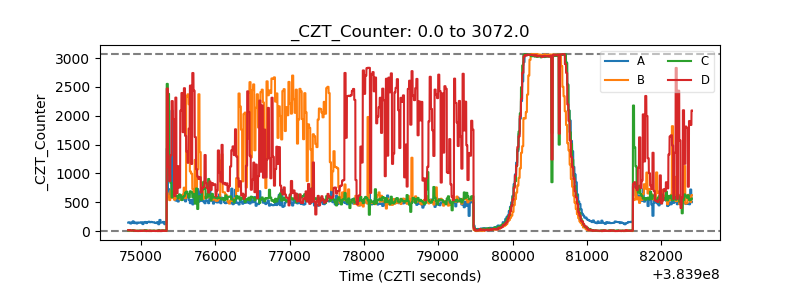 |
| +2.5 Volts monitor | 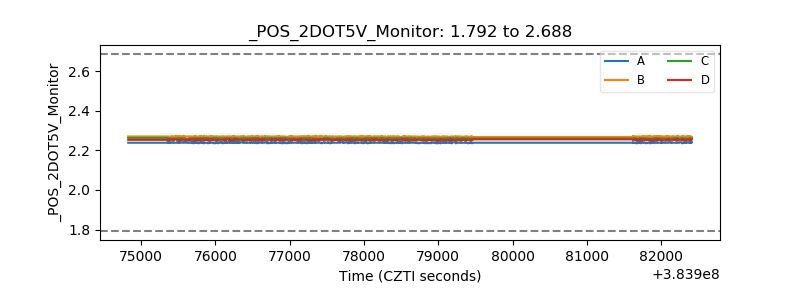 |
| +5 Volts monitor | 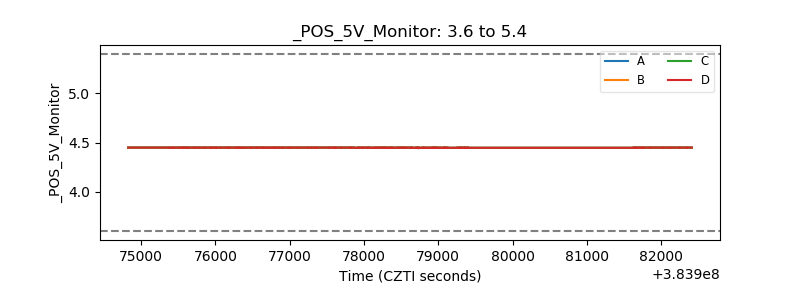 |
| _ROLL_ROT | 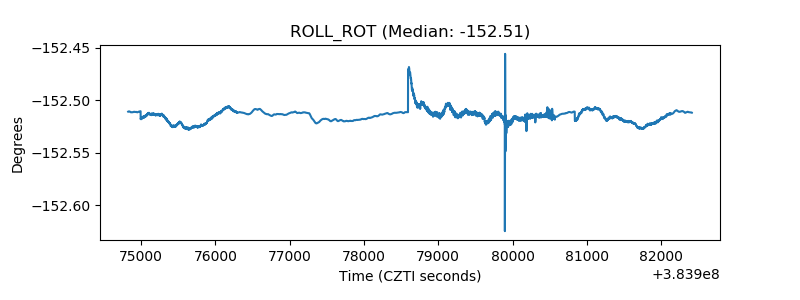 |
| _Roll_DEC | 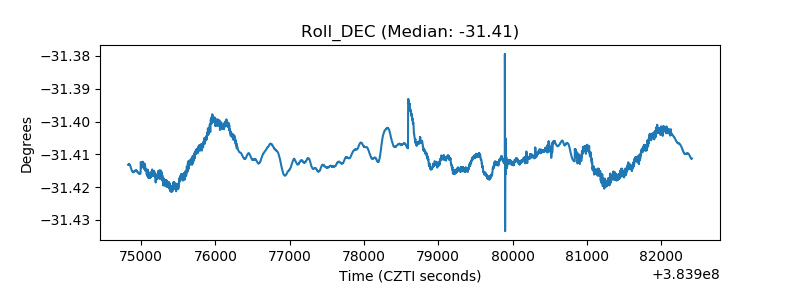 |
| _Roll_RA | 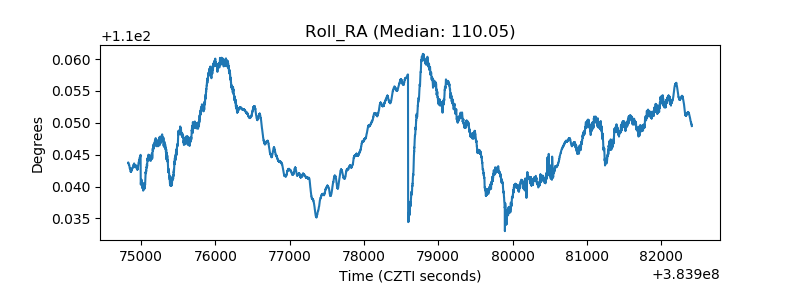 |
| Veto Counter | 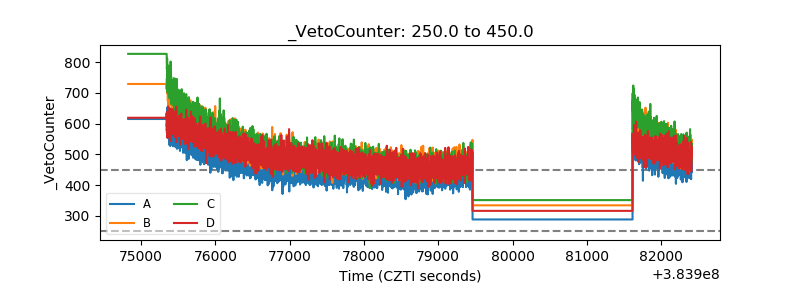 |