| Param | Original file | Final file |
|---|---|---|
| Filename | modeM0/AS1C07_004T01_9000004990_34755cztM0_level2.evt | modeM0/AS1C07_004T01_9000004990_34755cztM0_level2_quad_clean.evt |
| Size (bytes) | 557,527,680 | 46,995,840 |
| Size | 531.7 MB | 44.8 MB |
| Events in quadrant A | 2,792,181 | 290,394 |
| Events in quadrant B | 3,526,062 | 301,111 |
| Events in quadrant C | 3,043,423 | 300,751 |
| Events in quadrant D | 7,173,350 | 167,769 |
| Mode M9 | |||
|---|---|---|---|
| Quadrant | BADHDUFLAG | Total packets | Discarded packets |
| A | 0 | 35 | 0 |
| B | 0 | 35 | 0 |
| C | 0 | 35 | 0 |
| D | 0 | 36 | 0 |
| Mode M0 | |||
|---|---|---|---|
| Quadrant | BADHDUFLAG | Total packets | Discarded packets |
| A | 0 | 11141 | 3 |
| B | 0 | 13548 | 2 |
| C | 0 | 12049 | 2 |
| D | 0 | 24815 | 2 |
| Mode SS | |||
|---|---|---|---|
| Quadrant | BADHDUFLAG | Total packets | Discarded packets |
| A | 0 | 106 | 0 |
| B | 0 | 106 | 0 |
| C | 0 | 106 | 0 |
| D | 0 | 106 | 0 |
| Quadrant | Total seconds | Saturated seconds | Saturation percentage |
|---|---|---|---|
| A | 5160 | 14 | 0.271318% |
| B | 5160 | 208 | 4.031008% |
| C | 5160 | 30 | 0.581395% |
| D | 5160 | 1760 | 34.108527% |
Noise dominated data is calculated using 1-second bins in cleaned event files. If a bin has >2000 counts, and if more than 50% of those come from <1% of pixels, then it is considered to be noise-dominated and hence unusable.
| Quadrant | # 1 sec bins | Bins with >0 counts | Bins with >2000 counts | High rate bins dominated by noise | Noise dominated (total time) | Noise dominated (detector-on time) | Marked lightcurve |
|---|---|---|---|---|---|---|---|
| A | 7252 | 5161 | 4 | 4 | 0.06% | 0.08% | 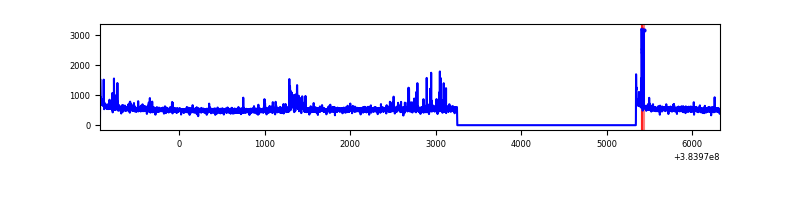 |
| B | 7252 | 5161 | 141 | 141 | 1.94% | 2.73% | 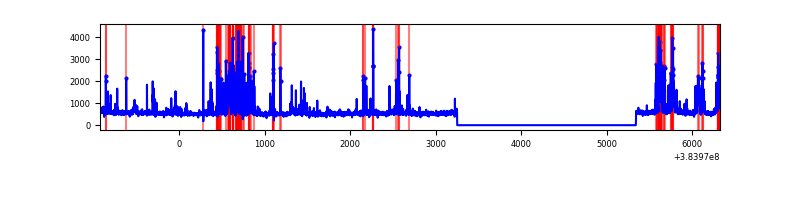 |
| C | 7252 | 5161 | 23 | 23 | 0.32% | 0.45% | 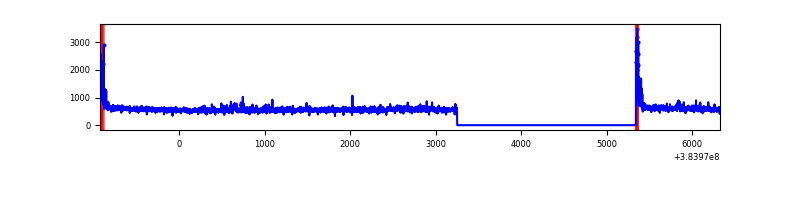 |
| D | 7252 | 5161 | 1668 | 1668 | 23.00% | 32.32% | 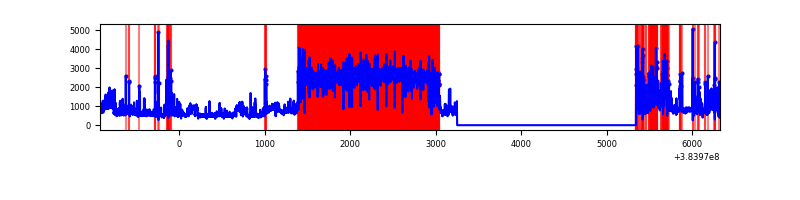 |
Top three noisy pixels from each quadrant. If the there are fewer than three noisy pixels in the level2.evt file, extra rows are filled as -1
| Pixel properties | Quadrant properties | ||||||
|---|---|---|---|---|---|---|---|
| Quadrant | DetID | PixID | Counts | Sigma | Mean | Median | Sigma |
| A | 15 | 223 | 58749 | 435.58 | 674 | 664 | 133.3 |
| A | 15 | 174 | 58188 | 431.38 | 674 | 664 | 133.3 |
| A | 10 | 83 | 48115 | 355.84 | 674 | 664 | 133.3 |
| B | 5 | 255 | 395973 | 3146.72 | 673 | 658 | 125.6 |
| B | 5 | 172 | 385077 | 3059.99 | 673 | 658 | 125.6 |
| B | 0 | 155 | 62102 | 489.1 | 673 | 658 | 125.6 |
| C | 15 | 214 | 222261 | 1426.56 | 674 | 681 | 155.3 |
| C | 0 | 10 | 116701 | 746.95 | 674 | 681 | 155.3 |
| C | 14 | 67 | 70324 | 448.37 | 674 | 681 | 155.3 |
| D | 2 | 31 | 3178553 | 23425.67 | 561 | 548 | 135.7 |
| D | 8 | 195 | 582901 | 4292.63 | 561 | 548 | 135.7 |
| D | 2 | 250 | 556963 | 4101.44 | 561 | 548 | 135.7 |
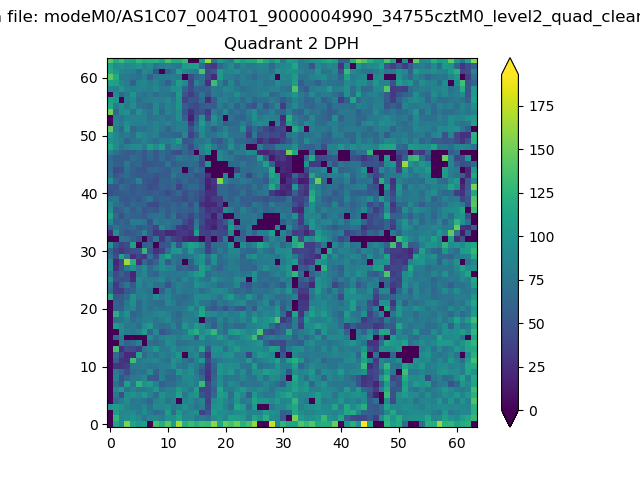
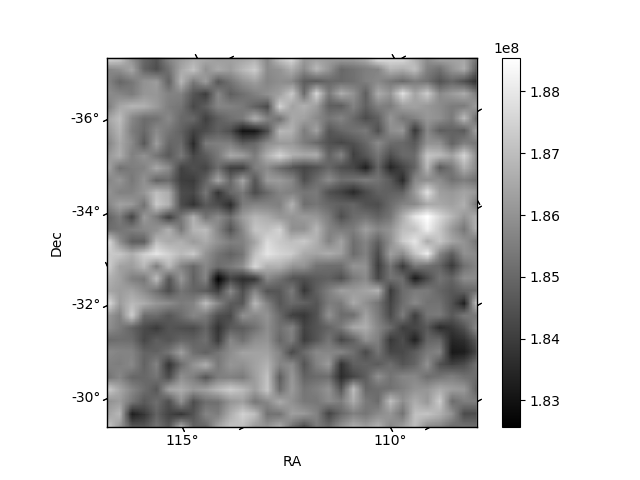
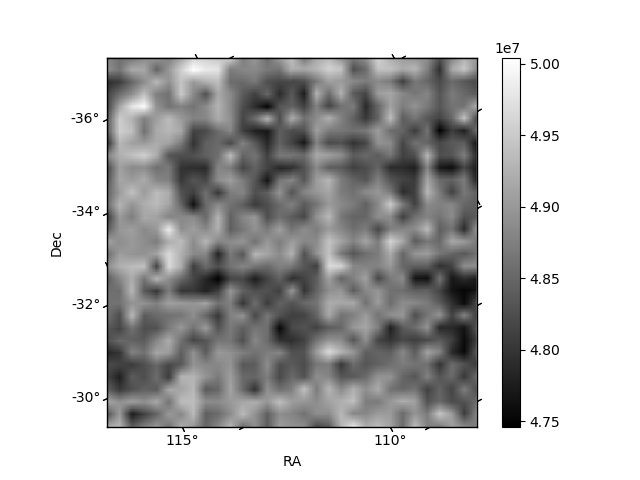
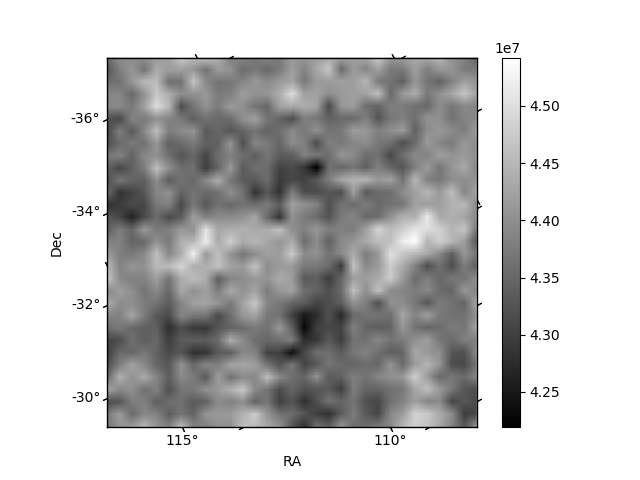
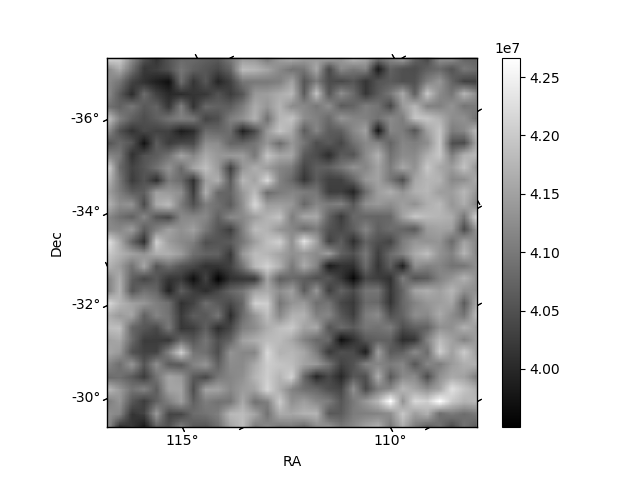
Histogram calculated using DETX and DETY for each event in the final _common_clean file
| Quadrant A | 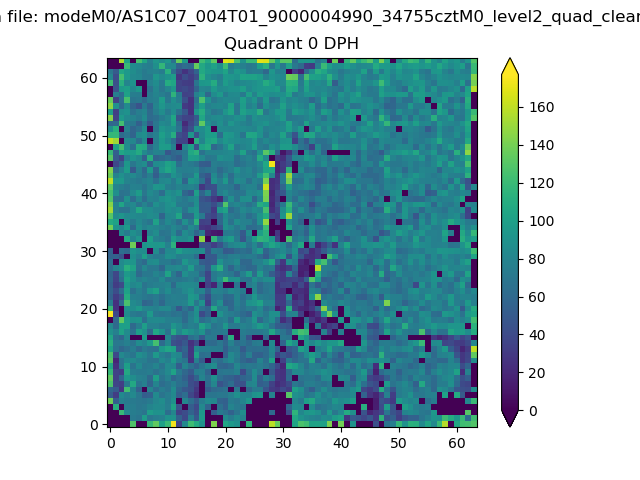 |
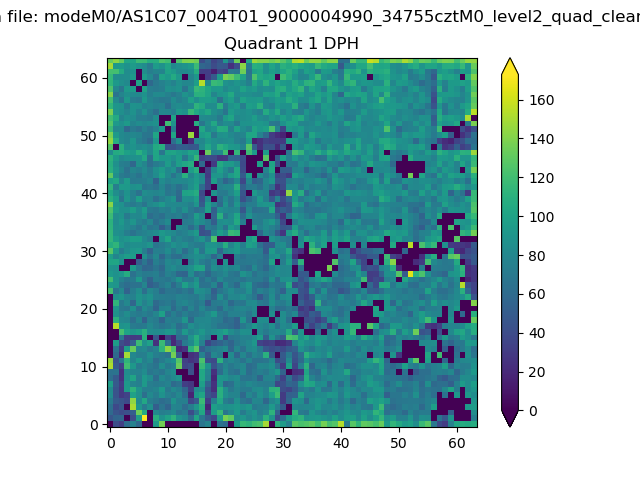 |
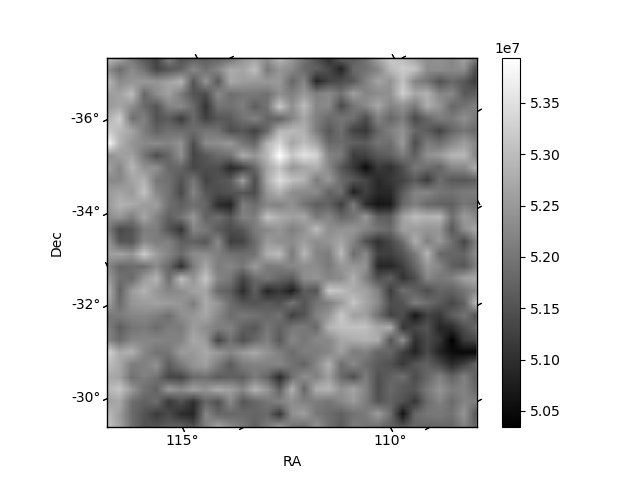
Quadrant B |
|---|---|---|---|
| Quadrant D | 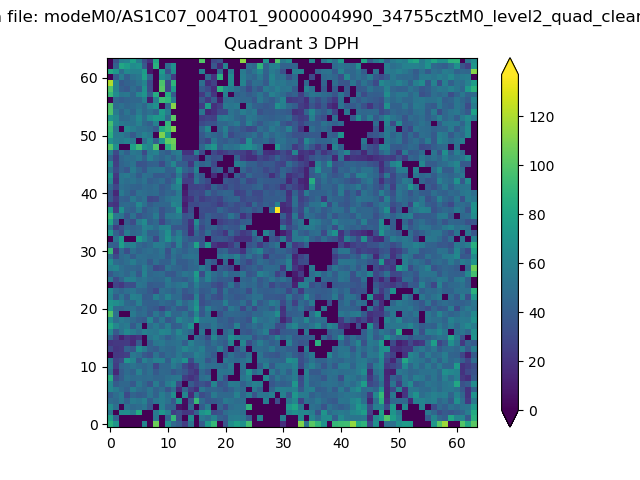 |
 |
Quadrant C |
| Plot type | Count rate plots | Images |
|---|---|---|
| Comparison with Poisson distribution Blue bars denote a histogram of data divided into 1 sec bins. Red curve is a Poisson curve with rate = median count rate of data. |
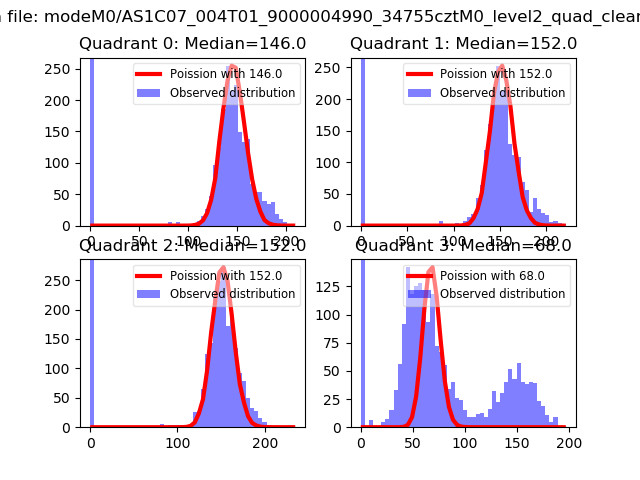 |
 |
| Quadrant-wise count rates Data is divided into 100 sec bins |
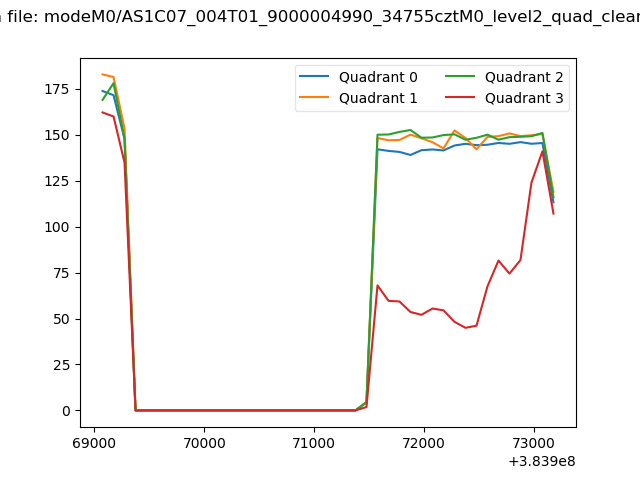 |
|
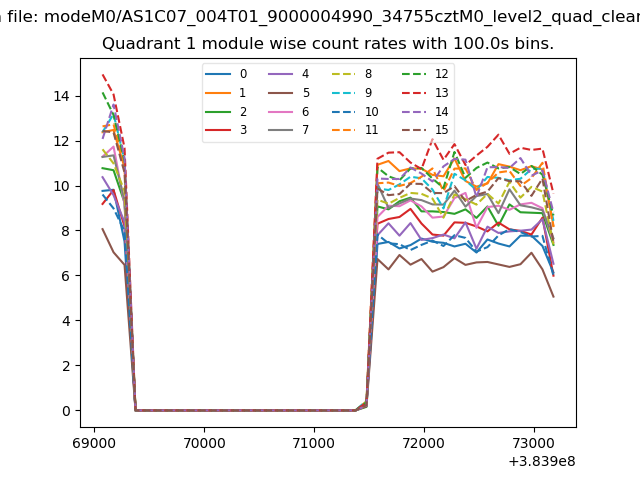
| Module-wise count rates for Quadrant A Data is divided into 100 sec bins |
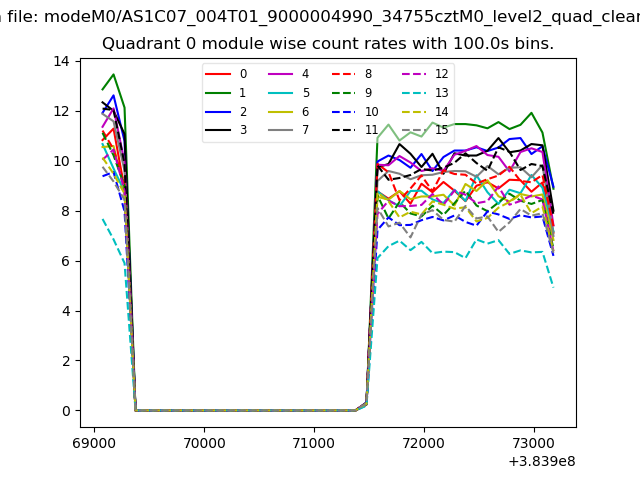 |
 |
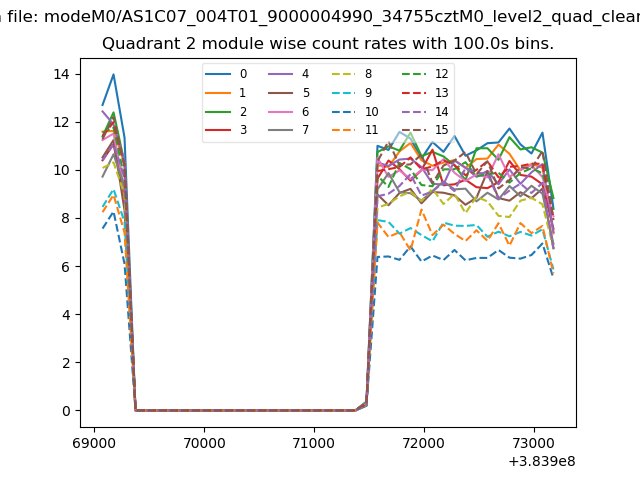
| Module-wise count rates for Quadrant B Data is divided into 100 sec bins |
 |
 |
| Module-wise count rates for Quadrant C Data is divided into 100 sec bins |
 |
 |
| Module-wise count rates for Quadrant D Data is divided into 100 sec bins |
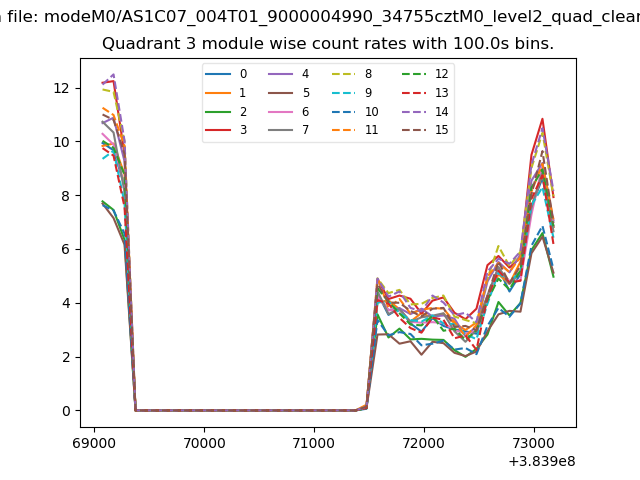 |
 |
| Parameter | Plot |
|---|---|
| CZT HV Monitor | 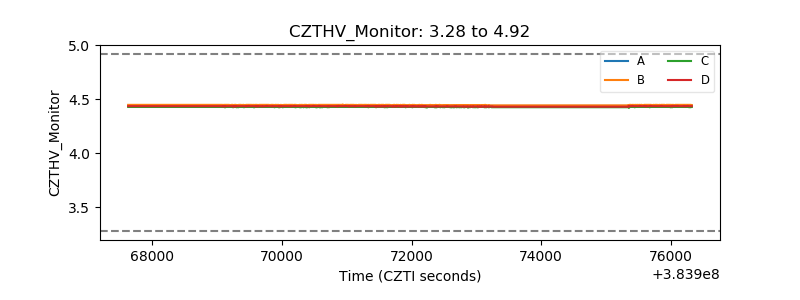 |
| D_VDD | 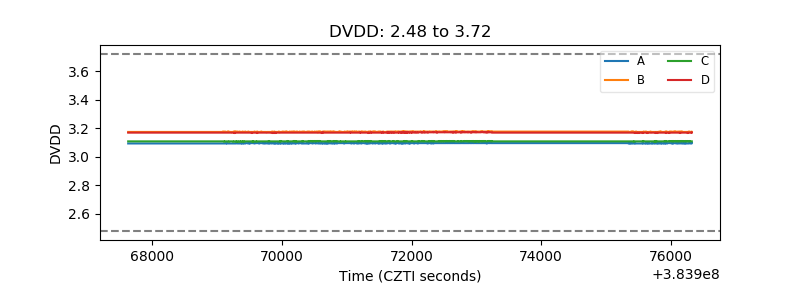 |
| Temperature 1 | 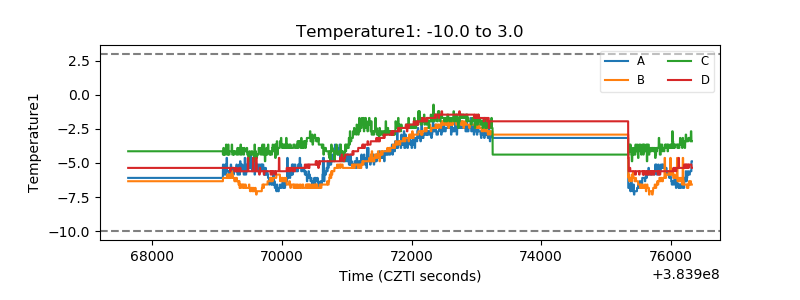 |
| Veto HV Monitor | 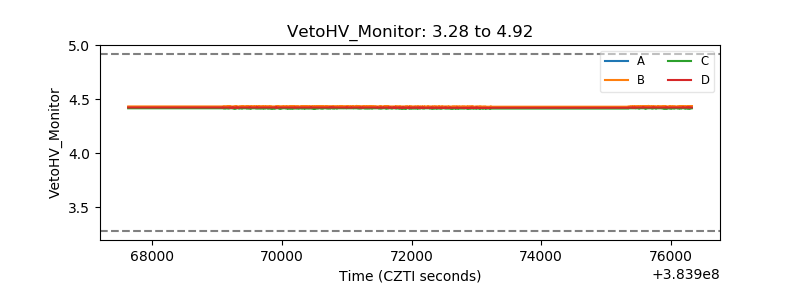 |
| Veto LLD | 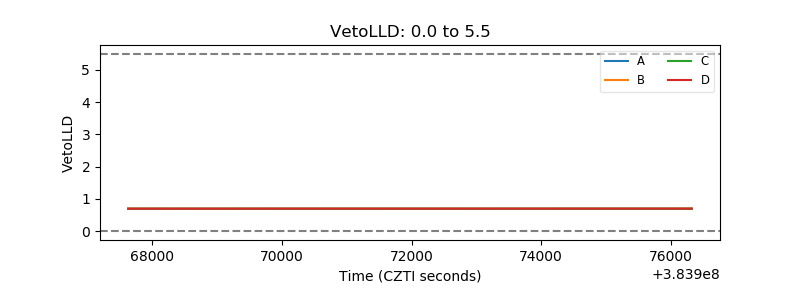 |
| Alpha Counter | 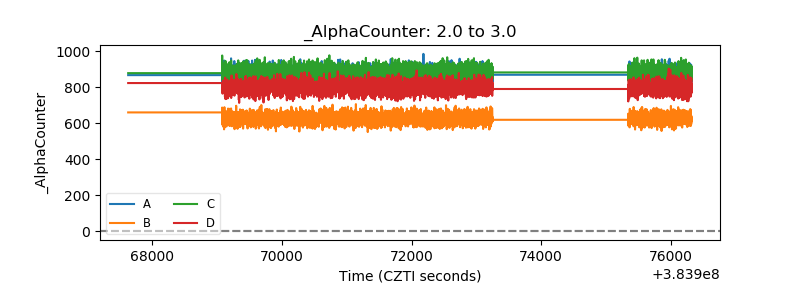 |
| _CPM_Rate | 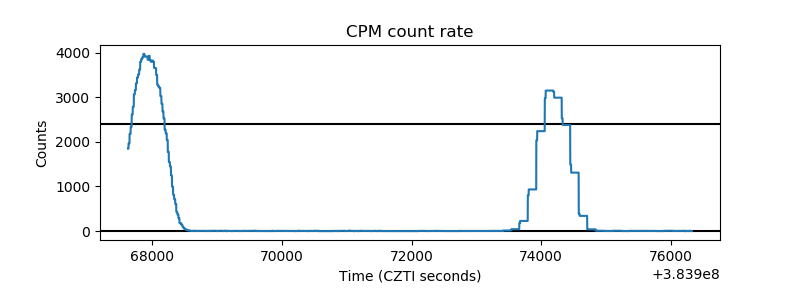 |
| CZT Counter | 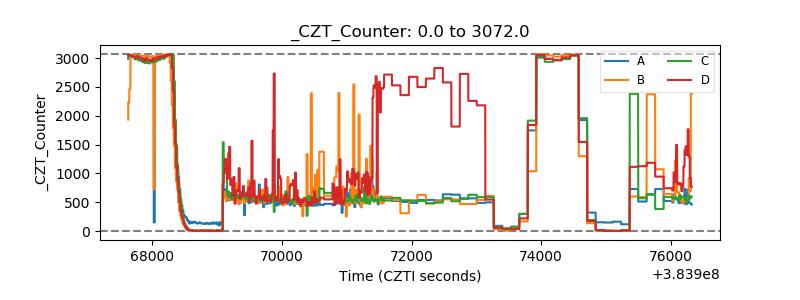 |
| +2.5 Volts monitor | 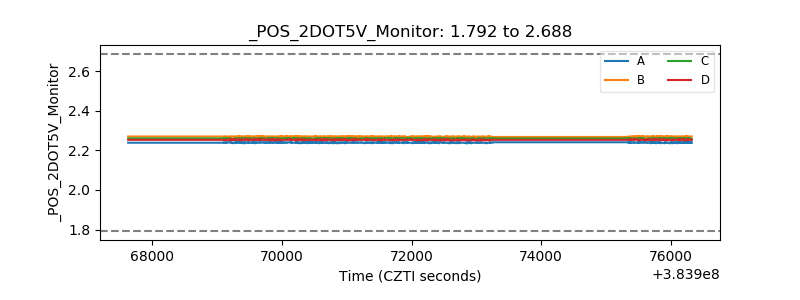 |
| +5 Volts monitor | 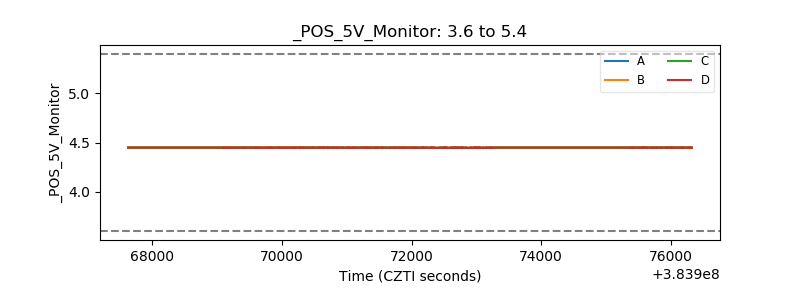 |
| _ROLL_ROT | 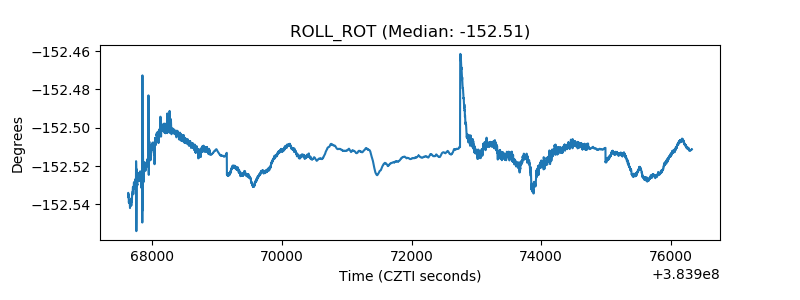 |
| _Roll_DEC | 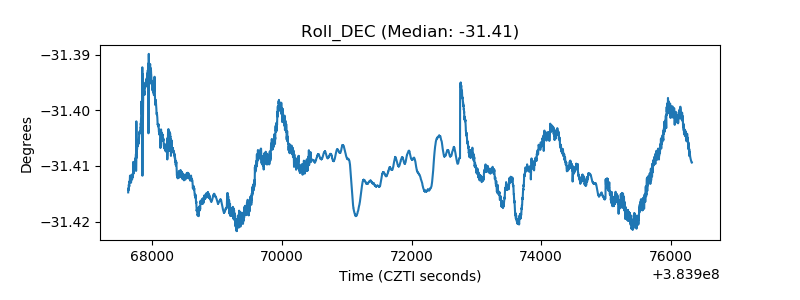 |
| _Roll_RA | 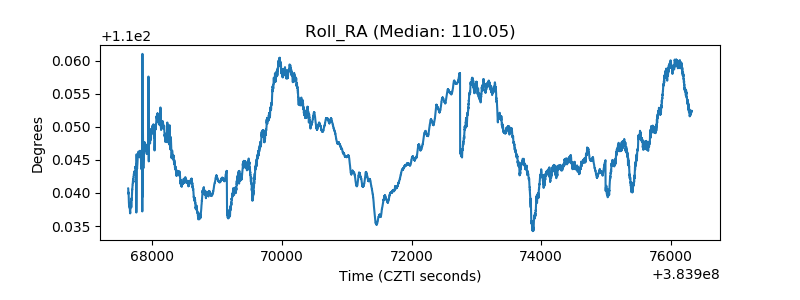 |
| Veto Counter | 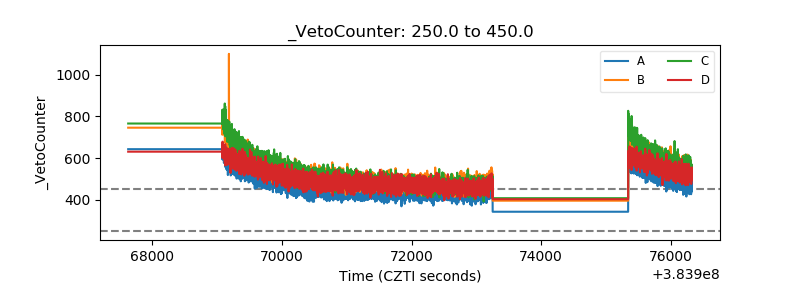 |