| Param | Original file | Final file |
|---|---|---|
| Filename | modeM0/AS1C07_004T01_9000004990_34750cztM0_level2.evt | modeM0/AS1C07_004T01_9000004990_34750cztM0_level2_quad_clean.evt |
| Size (bytes) | 737,478,720 | 60,615,360 |
| Size | 703.3 MB | 57.8 MB |
| Events in quadrant A | 2,651,672 | 416,860 |
| Events in quadrant B | 2,874,884 | 428,324 |
| Events in quadrant C | 2,920,170 | 419,497 |
| Events in quadrant D | 13,514,636 | 183,605 |
| Mode M9 | |||
|---|---|---|---|
| Quadrant | BADHDUFLAG | Total packets | Discarded packets |
| A | 0 | 26 | 0 |
| B | 0 | 26 | 0 |
| C | 0 | 26 | 0 |
| D | 0 | 27 | 0 |
| Mode M0 | |||
|---|---|---|---|
| Quadrant | BADHDUFLAG | Total packets | Discarded packets |
| A | 0 | 11524 | 3 |
| B | 0 | 12074 | 2 |
| C | 0 | 12168 | 2 |
| D | 0 | 43912 | 2 |
| Mode SS | |||
|---|---|---|---|
| Quadrant | BADHDUFLAG | Total packets | Discarded packets |
| A | 0 | 112 | 0 |
| B | 0 | 112 | 0 |
| C | 0 | 112 | 0 |
| D | 0 | 112 | 0 |
| Quadrant | Total seconds | Saturated seconds | Saturation percentage |
|---|---|---|---|
| A | 5509 | 15 | 0.272282% |
| B | 5509 | 33 | 0.599020% |
| C | 5509 | 29 | 0.526411% |
| D | 5509 | 4872 | 88.437103% |
Noise dominated data is calculated using 1-second bins in cleaned event files. If a bin has >2000 counts, and if more than 50% of those come from <1% of pixels, then it is considered to be noise-dominated and hence unusable.
| Quadrant | # 1 sec bins | Bins with >0 counts | Bins with >2000 counts | High rate bins dominated by noise | Noise dominated (total time) | Noise dominated (detector-on time) | Marked lightcurve |
|---|---|---|---|---|---|---|---|
| A | 7122 | 5510 | 5 | 5 | 0.07% | 0.09% | 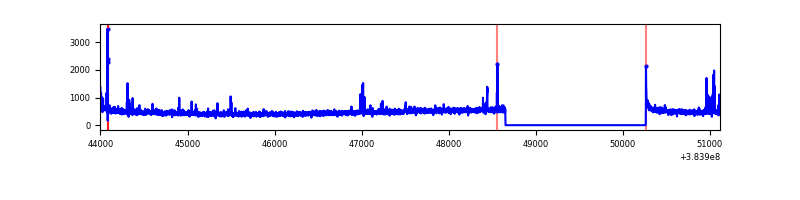 |
| B | 7122 | 5510 | 15 | 15 | 0.21% | 0.27% | 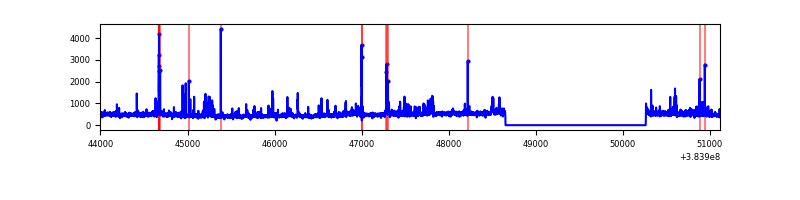 |
| C | 7122 | 5510 | 19 | 19 | 0.27% | 0.34% | 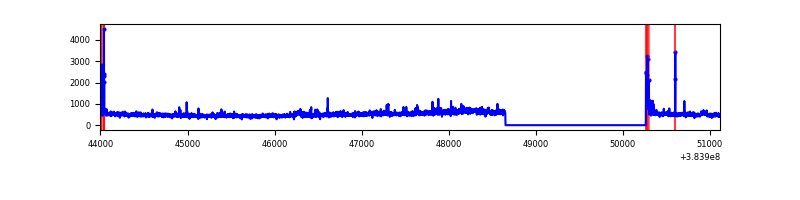 |
| D | 7122 | 5510 | 4585 | 4585 | 64.38% | 83.21% | 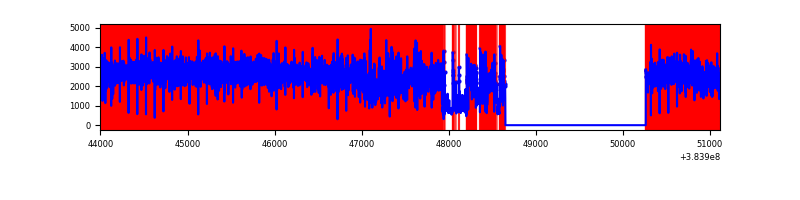 |
Top three noisy pixels from each quadrant. If the there are fewer than three noisy pixels in the level2.evt file, extra rows are filled as -1
| Pixel properties | Quadrant properties | ||||||
|---|---|---|---|---|---|---|---|
| Quadrant | DetID | PixID | Counts | Sigma | Mean | Median | Sigma |
| A | 9 | 143 | 51653 | 392.77 | 639 | 626 | 129.9 |
| A | 10 | 83 | 50686 | 385.33 | 639 | 626 | 129.9 |
| A | 15 | 174 | 27079 | 203.62 | 639 | 626 | 129.9 |
| B | 0 | 190 | 143986 | 1153.54 | 640 | 622 | 124.3 |
| B | 5 | 255 | 86542 | 691.33 | 640 | 622 | 124.3 |
| B | 4 | 232 | 78309 | 625.09 | 640 | 622 | 124.3 |
| C | 15 | 214 | 236729 | 1603.93 | 624 | 629 | 147.2 |
| C | 14 | 67 | 111378 | 752.37 | 624 | 629 | 147.2 |
| C | 0 | 10 | 97103 | 655.39 | 624 | 629 | 147.2 |
| D | 1 | 52 | 10185810 | 111303.95 | 362 | 350 | 91.5 |
| D | 2 | 250 | 799167 | 8729.26 | 362 | 350 | 91.5 |
| D | 8 | 195 | 432142 | 4718.51 | 362 | 350 | 91.5 |
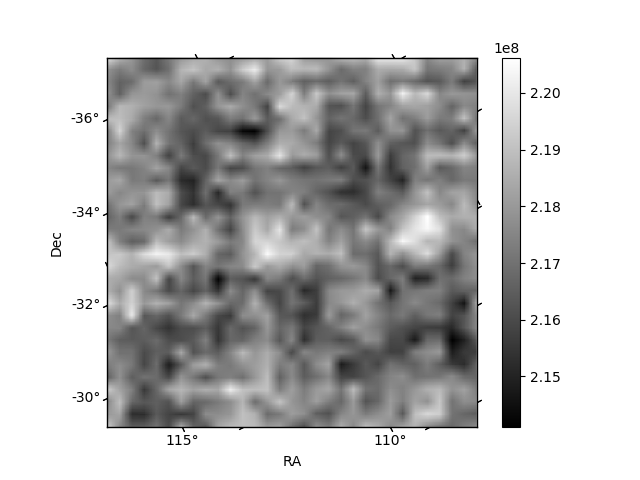
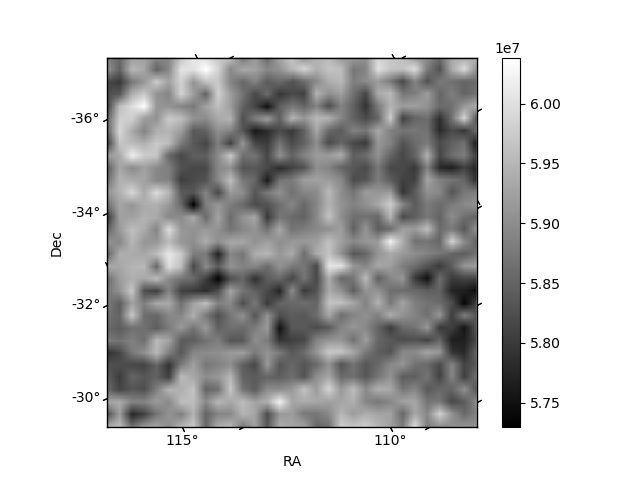
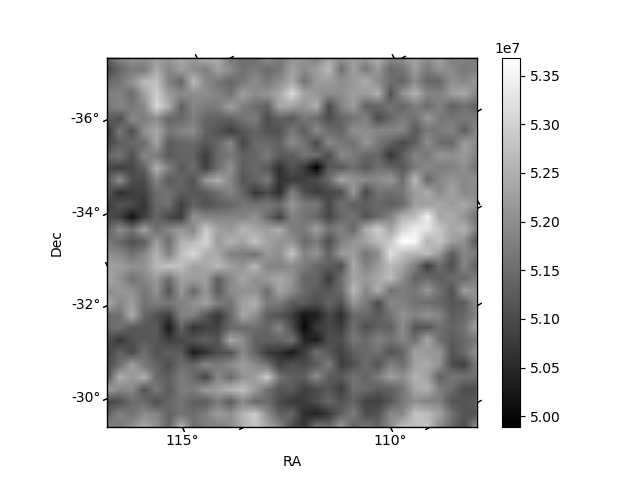
Histogram calculated using DETX and DETY for each event in the final _common_clean file
| Quadrant A | 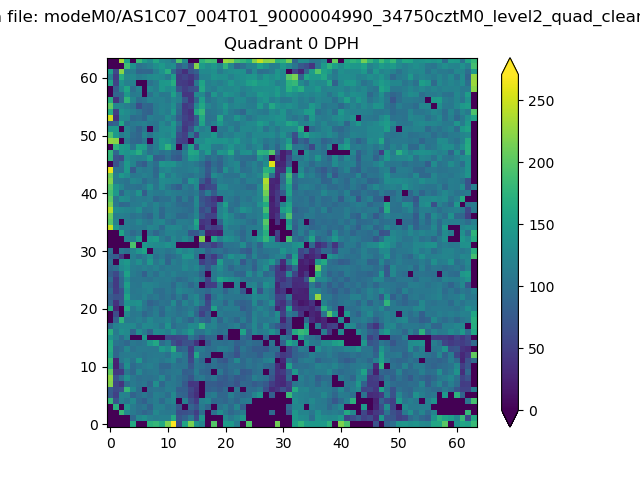 |
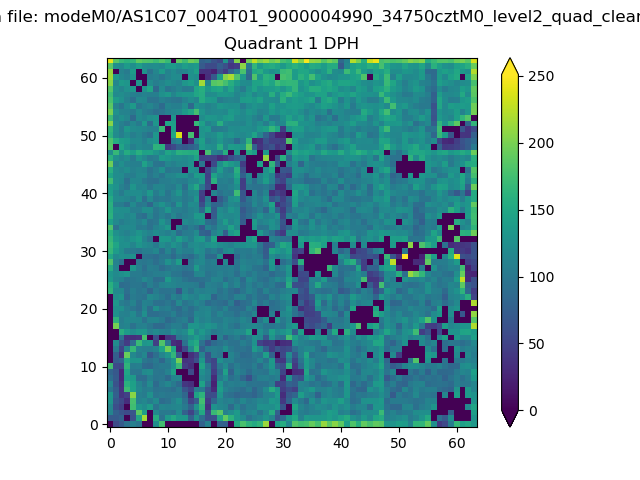 |
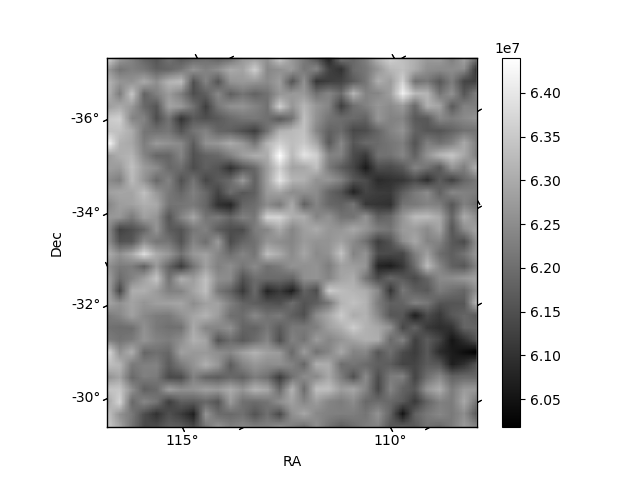
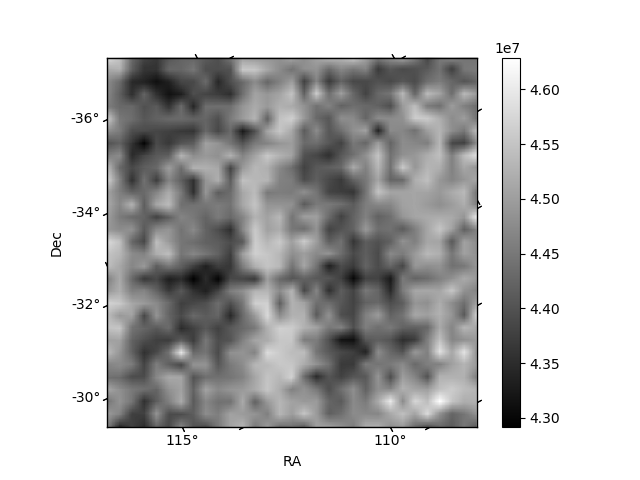
Quadrant B |
|---|---|---|---|
| Quadrant D | 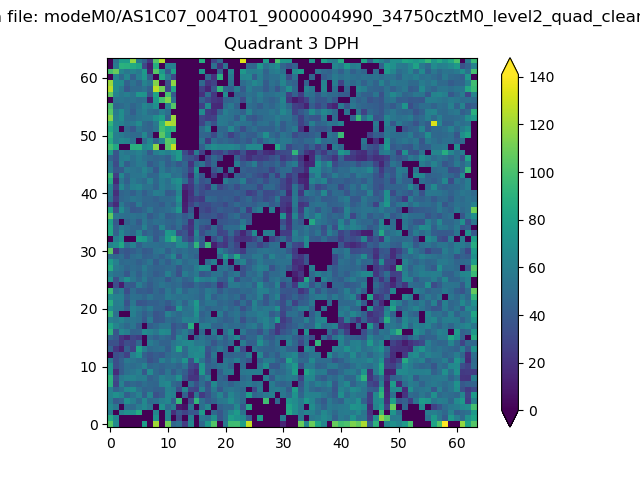 |
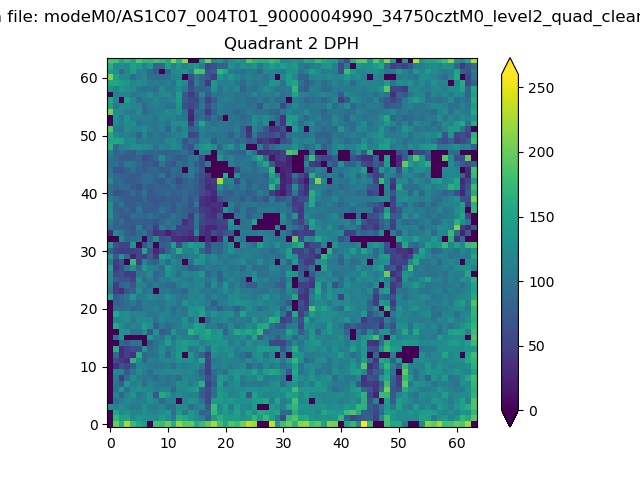 |
Quadrant C |
| Plot type | Count rate plots | Images |
|---|---|---|
| Comparison with Poisson distribution Blue bars denote a histogram of data divided into 1 sec bins. Red curve is a Poisson curve with rate = median count rate of data. |
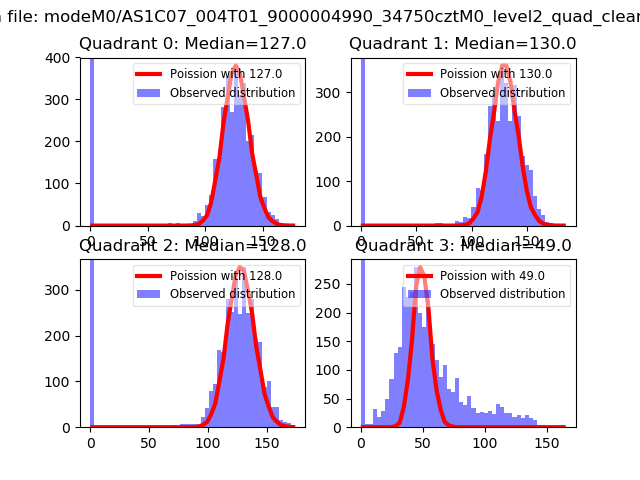 |
 |
| Quadrant-wise count rates Data is divided into 100 sec bins |
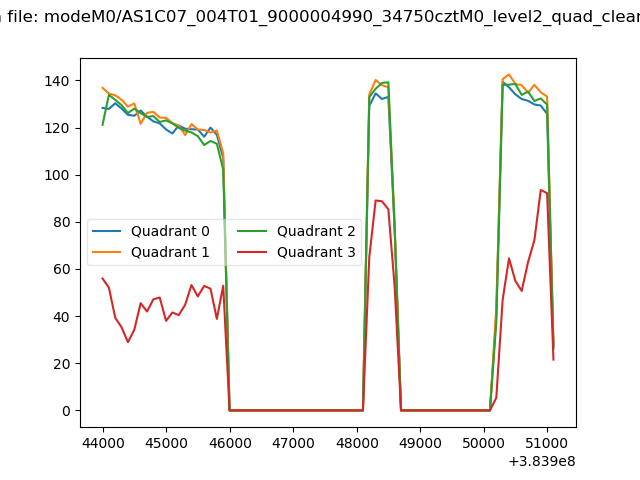 |
|
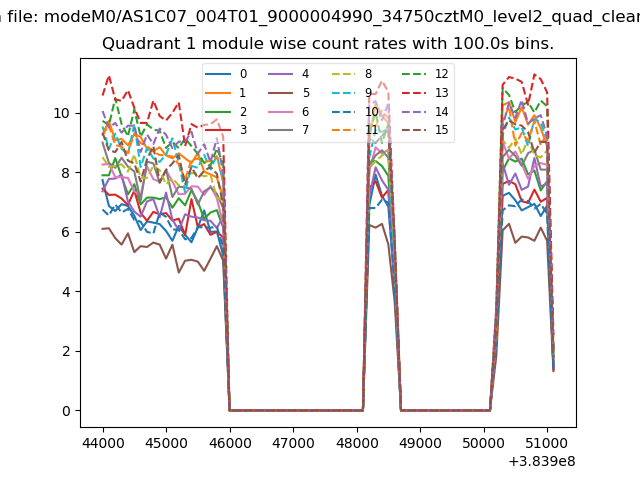
| Module-wise count rates for Quadrant A Data is divided into 100 sec bins |
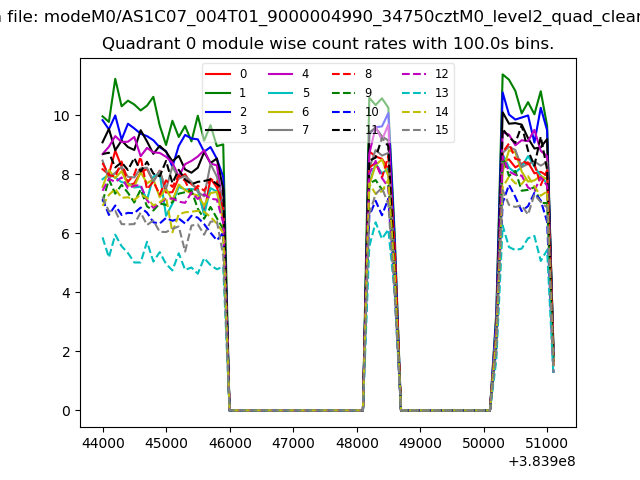 |
 |
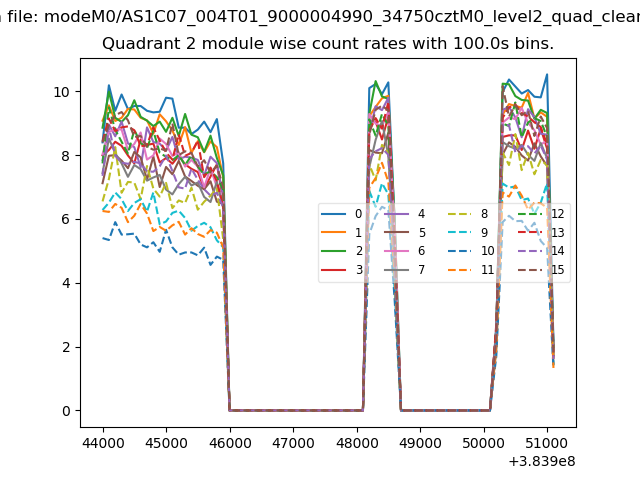
| Module-wise count rates for Quadrant B Data is divided into 100 sec bins |
 |
 |
| Module-wise count rates for Quadrant C Data is divided into 100 sec bins |
 |
 |
| Module-wise count rates for Quadrant D Data is divided into 100 sec bins |
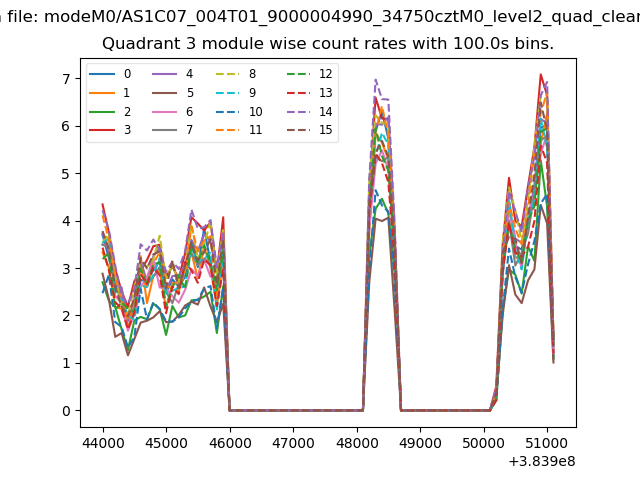 |
 |
| Parameter | Plot |
|---|---|
| CZT HV Monitor | 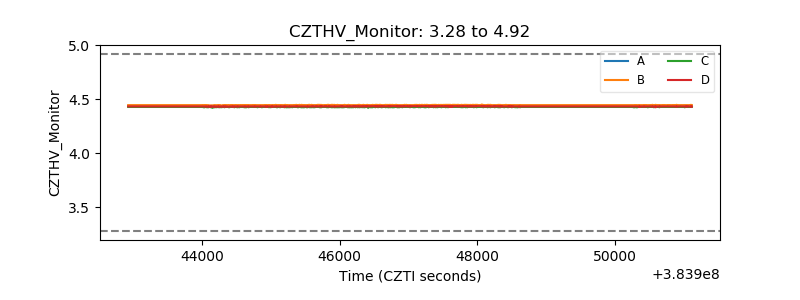 |
| D_VDD | 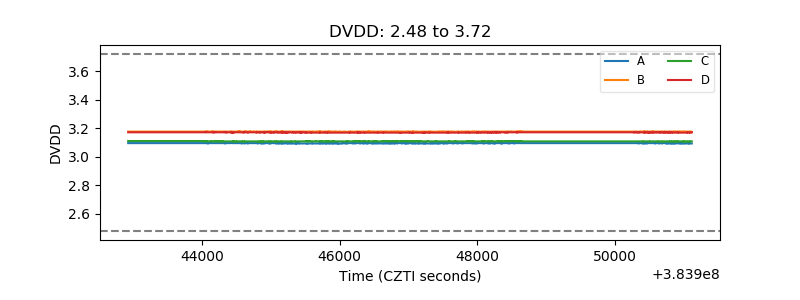 |
| Temperature 1 | 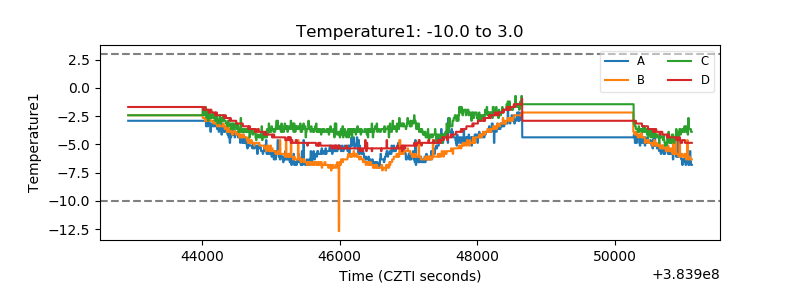 |
| Veto HV Monitor | 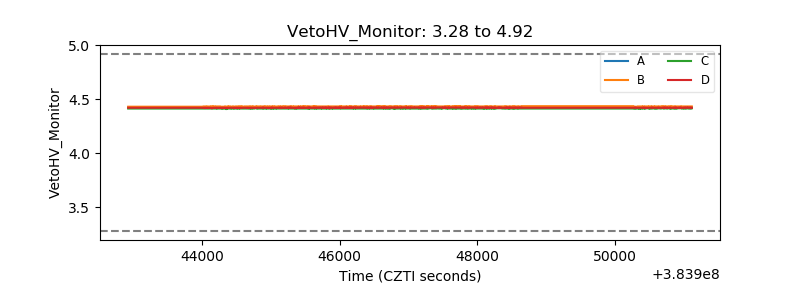 |
| Veto LLD | 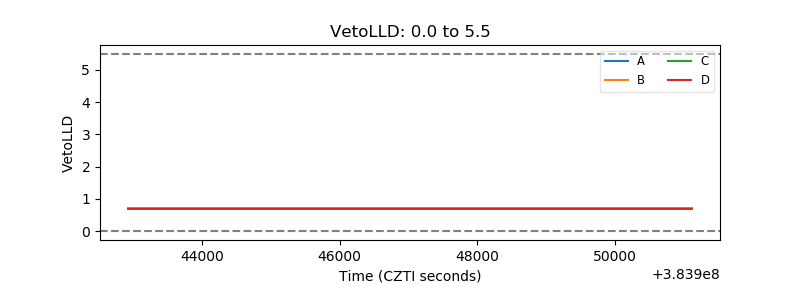 |
| Alpha Counter | 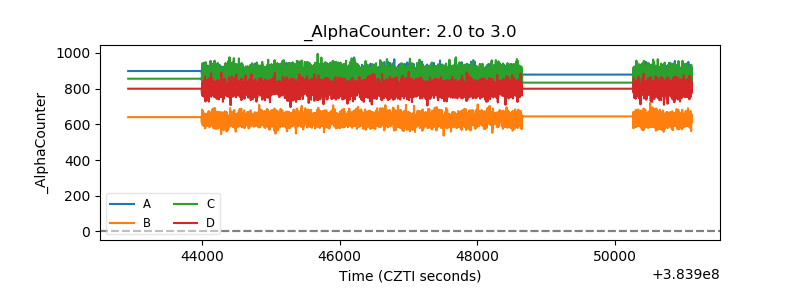 |
| _CPM_Rate | 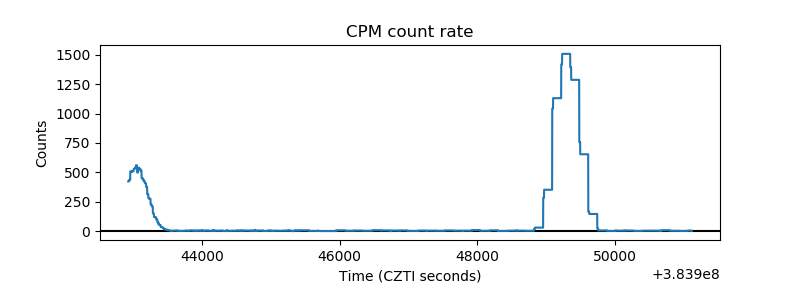 |
| CZT Counter | 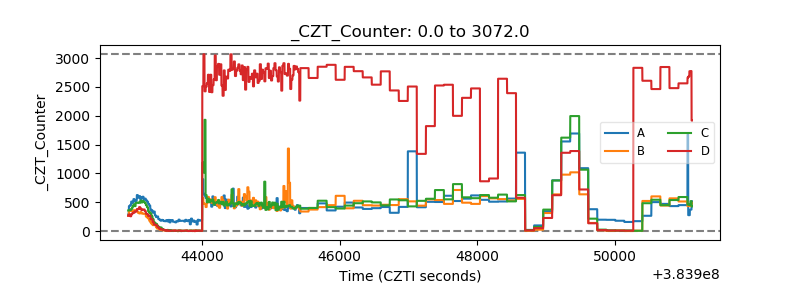 |
| +2.5 Volts monitor | 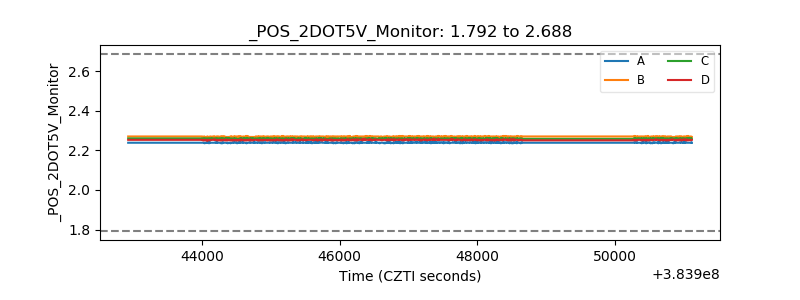 |
| +5 Volts monitor | 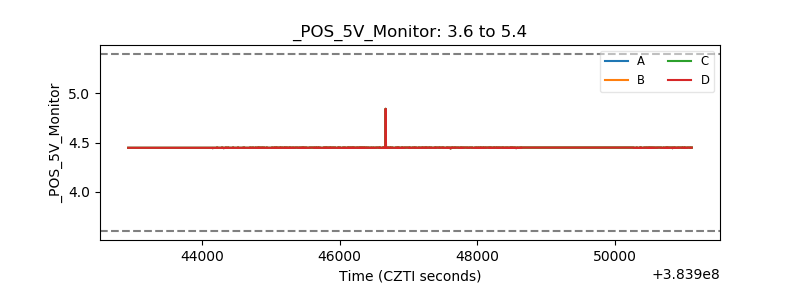 |
| _ROLL_ROT | 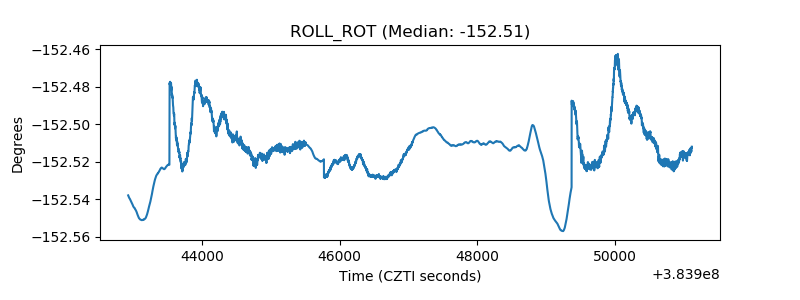 |
| _Roll_DEC | 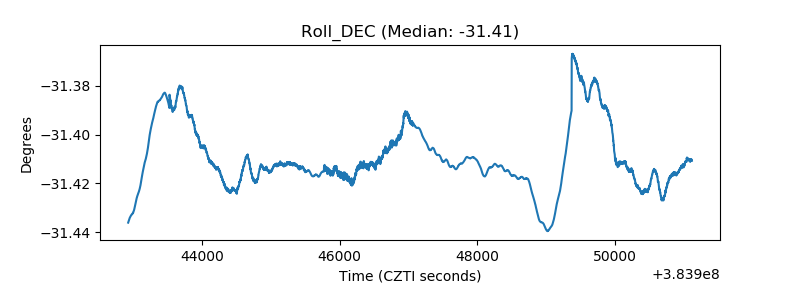 |
| _Roll_RA | 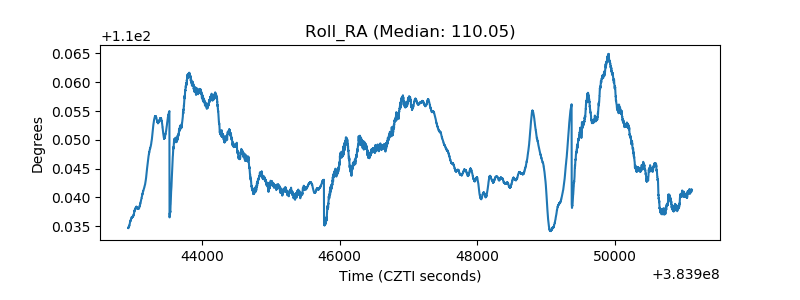 |
| Veto Counter | 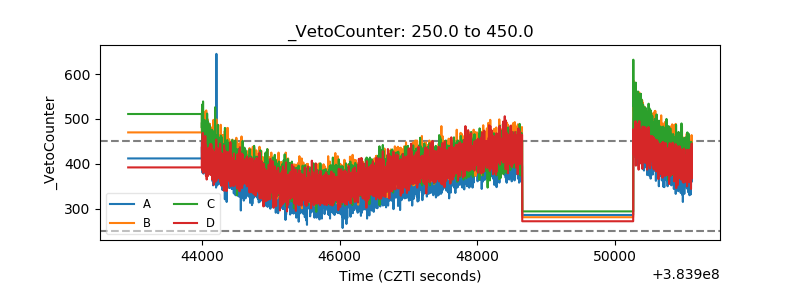 |