| Param | Original file | Final file |
|---|---|---|
| Filename | modeM0/AS1A10_094T37_9000004986_34749cztM0_level2.evt | modeM0/AS1A10_094T37_9000004986_34749cztM0_level2_quad_clean.evt |
| Size (bytes) | 300,072,960 | 61,606,080 |
| Size | 286.2 MB | 58.8 MB |
| Events in quadrant A | 1,674,352 | 412,743 |
| Events in quadrant B | 1,947,648 | 412,701 |
| Events in quadrant C | 1,704,351 | 407,556 |
| Events in quadrant D | 3,513,445 | 375,412 |
| Mode M9 | |||
|---|---|---|---|
| Quadrant | BADHDUFLAG | Total packets | Discarded packets |
| A | 0 | 1 | 0 |
| B | 0 | 1 | 0 |
| C | 0 | 1 | 0 |
| D | 0 | 2 | 0 |
| Mode M0 | |||
|---|---|---|---|
| Quadrant | BADHDUFLAG | Total packets | Discarded packets |
| A | 0 | 7606 | 1 |
| B | 0 | 8259 | 1 |
| C | 0 | 7439 | 1 |
| D | 0 | 12951 | 1 |
| Mode SS | |||
|---|---|---|---|
| Quadrant | BADHDUFLAG | Total packets | Discarded packets |
| A | 0 | 72 | 0 |
| B | 0 | 72 | 0 |
| C | 0 | 72 | 0 |
| D | 0 | 72 | 0 |
| Quadrant | Total seconds | Saturated seconds | Saturation percentage |
|---|---|---|---|
| A | 3633 | 15 | 0.412882% |
| B | 3633 | 52 | 1.431324% |
| C | 3633 | 11 | 0.302780% |
| D | 3633 | 269 | 7.404349% |
Noise dominated data is calculated using 1-second bins in cleaned event files. If a bin has >2000 counts, and if more than 50% of those come from <1% of pixels, then it is considered to be noise-dominated and hence unusable.
| Quadrant | # 1 sec bins | Bins with >0 counts | Bins with >2000 counts | High rate bins dominated by noise | Noise dominated (total time) | Noise dominated (detector-on time) | Marked lightcurve |
|---|---|---|---|---|---|---|---|
| A | 3633 | 3633 | 12 | 12 | 0.33% | 0.33% | 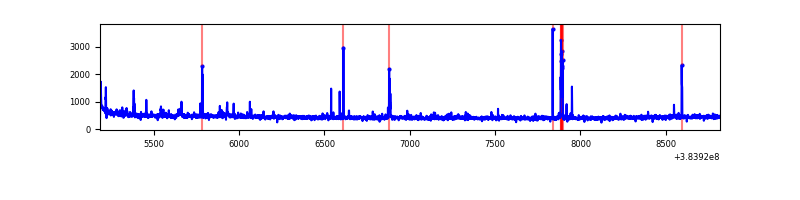 |
| B | 3633 | 3633 | 36 | 36 | 0.99% | 0.99% | 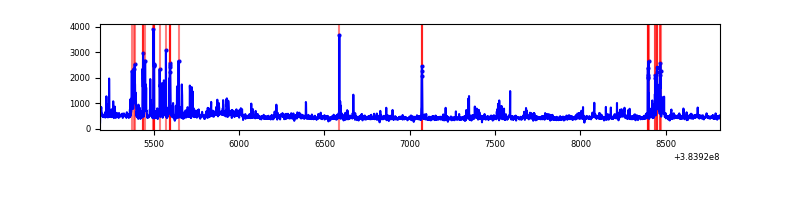 |
| C | 3633 | 3633 | 8 | 8 | 0.22% | 0.22% | 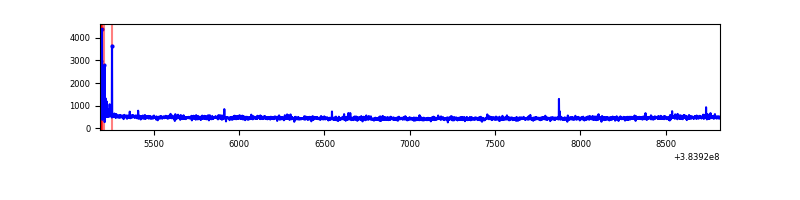 |
| D | 3633 | 3633 | 265 | 265 | 7.29% | 7.29% | 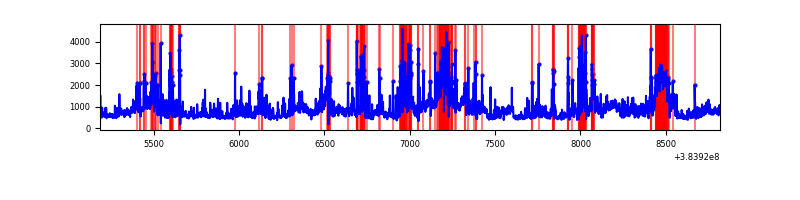 |
Top three noisy pixels from each quadrant. If the there are fewer than three noisy pixels in the level2.evt file, extra rows are filled as -1
| Pixel properties | Quadrant properties | ||||||
|---|---|---|---|---|---|---|---|
| Quadrant | DetID | PixID | Counts | Sigma | Mean | Median | Sigma |
| A | 9 | 143 | 29516 | 361.84 | 394 | 387 | 80.5 |
| A | 10 | 83 | 28880 | 353.94 | 394 | 387 | 80.5 |
| A | 15 | 174 | 26755 | 327.55 | 394 | 387 | 80.5 |
| B | 5 | 172 | 164844 | 2173.52 | 393 | 383 | 75.7 |
| B | 5 | 255 | 97938 | 1289.29 | 393 | 383 | 75.7 |
| B | 0 | 190 | 42806 | 560.66 | 393 | 383 | 75.7 |
| C | 15 | 214 | 155521 | 1721.82 | 379 | 380 | 90.1 |
| C | 0 | 10 | 42554 | 468.06 | 379 | 380 | 90.1 |
| C | 14 | 67 | 14232 | 153.74 | 379 | 380 | 90.1 |
| D | 8 | 195 | 747837 | 7471.38 | 364 | 356 | 100.0 |
| D | 1 | 52 | 304721 | 3042.26 | 364 | 356 | 100.0 |
| D | 2 | 250 | 267701 | 2672.22 | 364 | 356 | 100.0 |
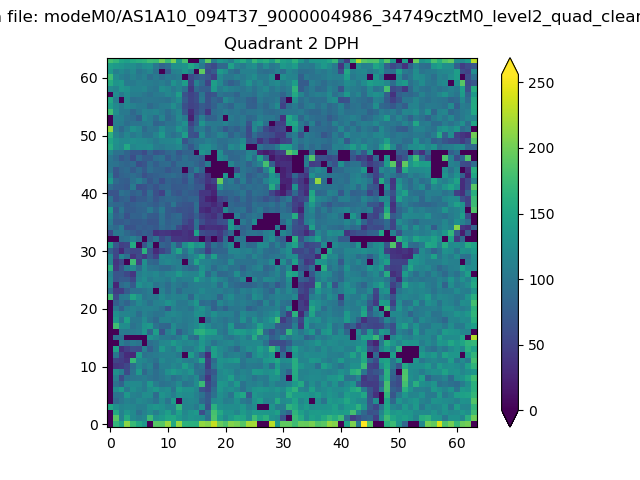
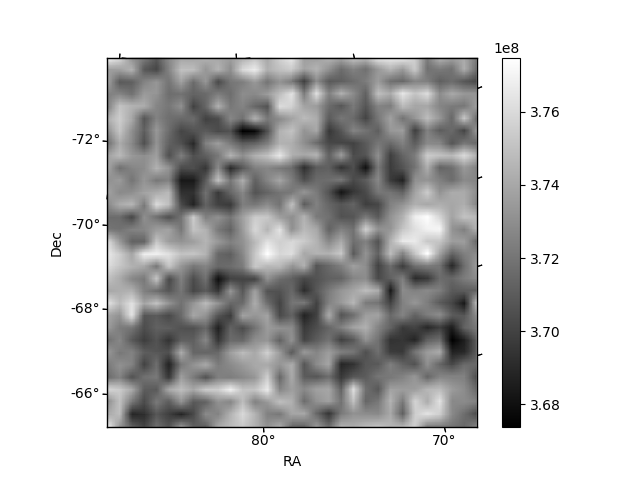
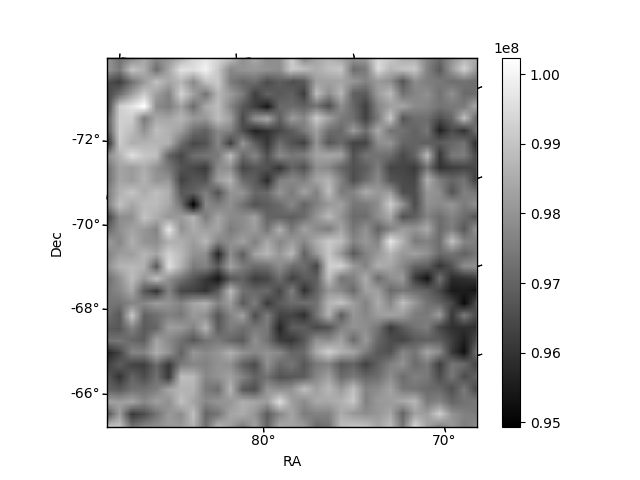
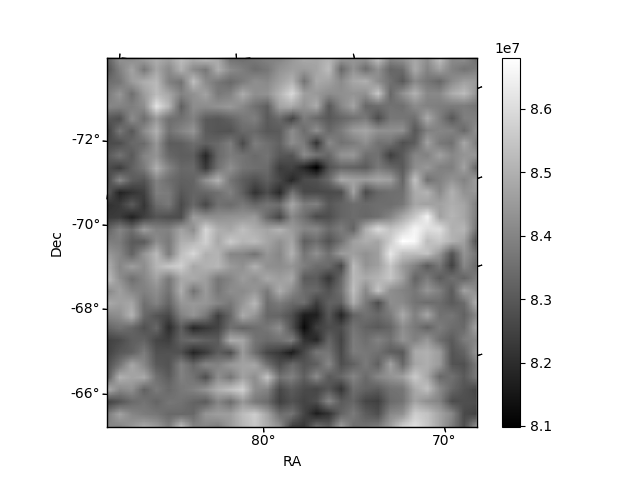
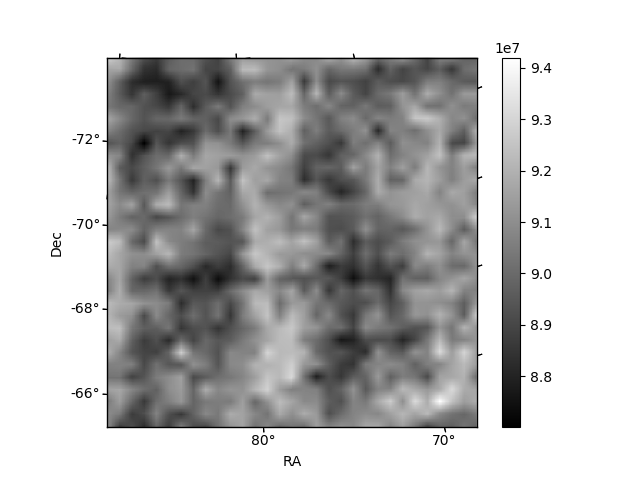
Histogram calculated using DETX and DETY for each event in the final _common_clean file
| Quadrant A | 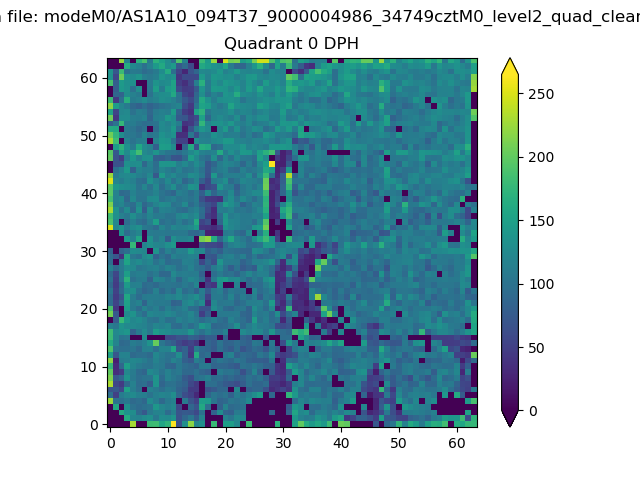 |
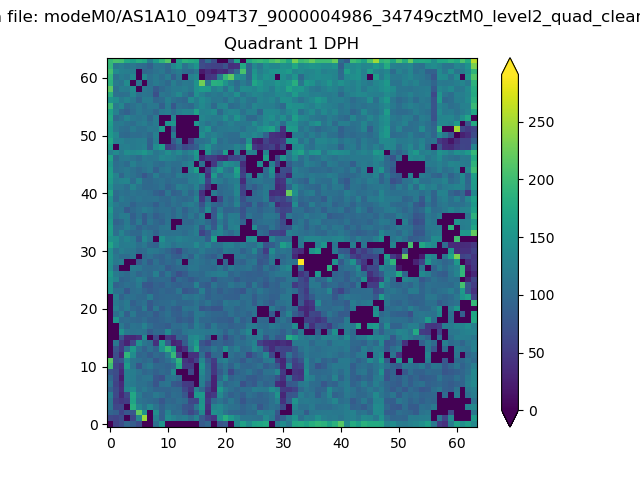 |
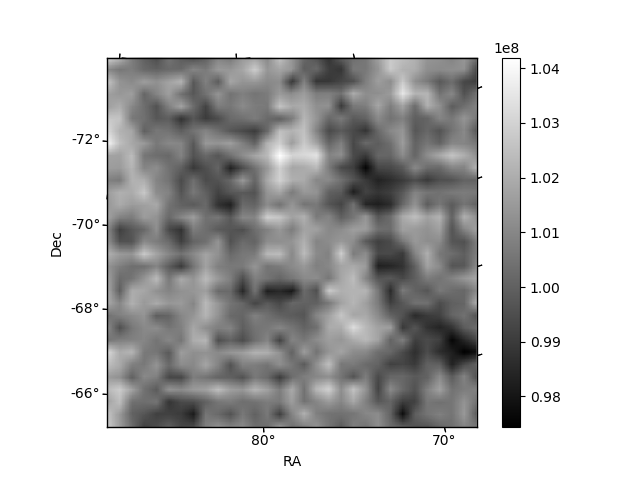
Quadrant B |
|---|---|---|---|
| Quadrant D | 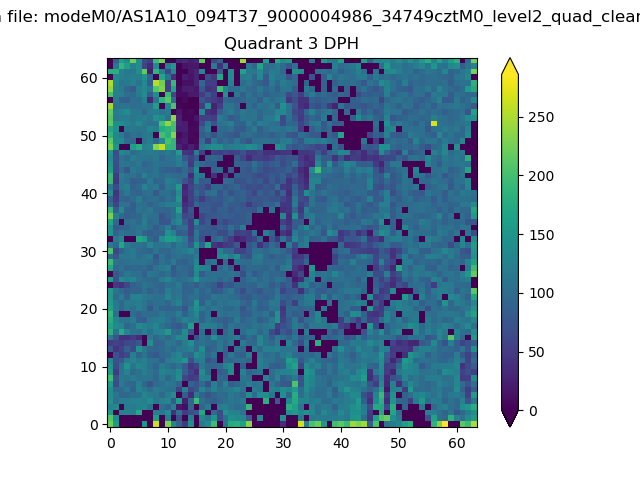 |
 |
Quadrant C |
| Plot type | Count rate plots | Images |
|---|---|---|
| Comparison with Poisson distribution Blue bars denote a histogram of data divided into 1 sec bins. Red curve is a Poisson curve with rate = median count rate of data. |
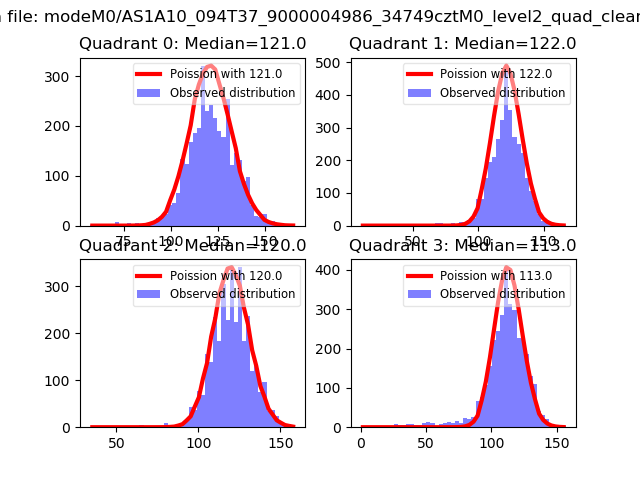 |
 |
| Quadrant-wise count rates Data is divided into 100 sec bins |
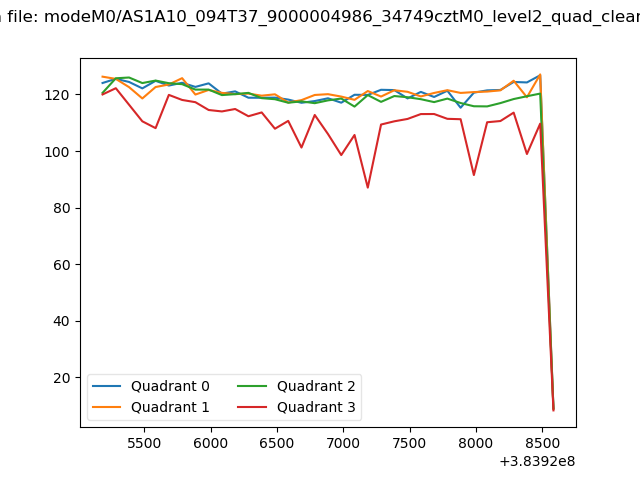 |
|
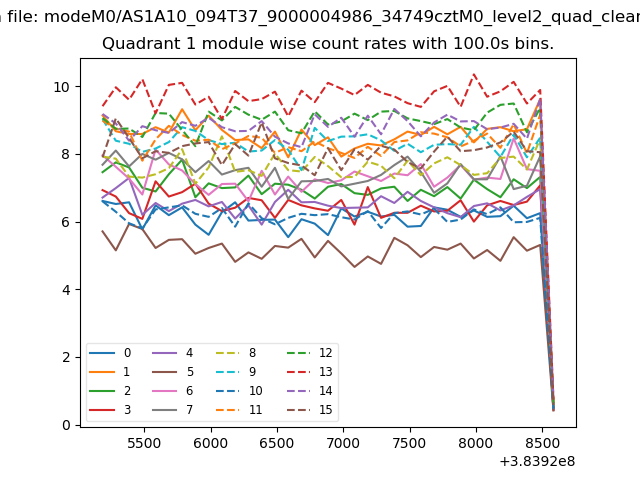
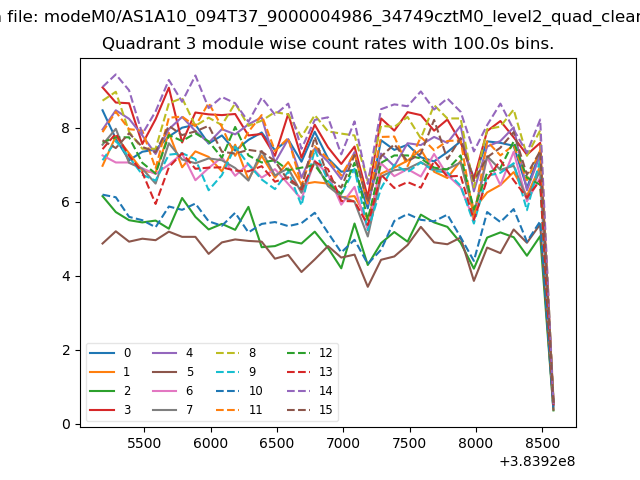
| Module-wise count rates for Quadrant A Data is divided into 100 sec bins |
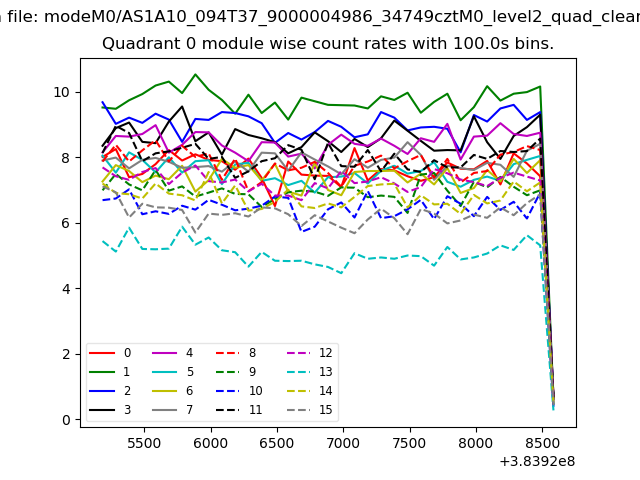 |
 |
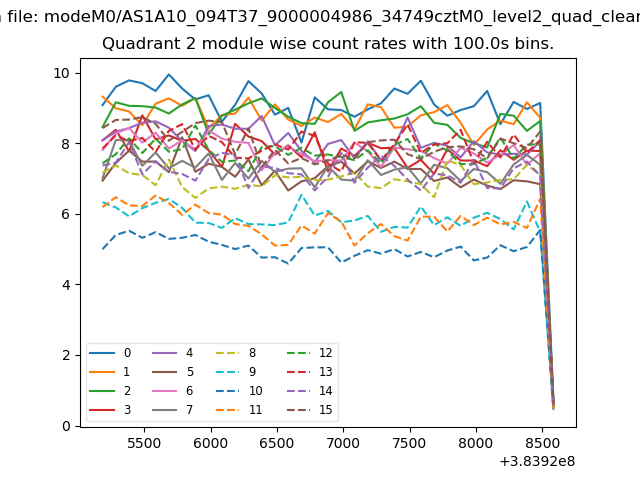
| Module-wise count rates for Quadrant B Data is divided into 100 sec bins |
 |
 |
| Module-wise count rates for Quadrant C Data is divided into 100 sec bins |
 |
 |
| Module-wise count rates for Quadrant D Data is divided into 100 sec bins |
 |
 |
| Parameter | Plot |
|---|---|
| CZT HV Monitor |  |
| D_VDD | 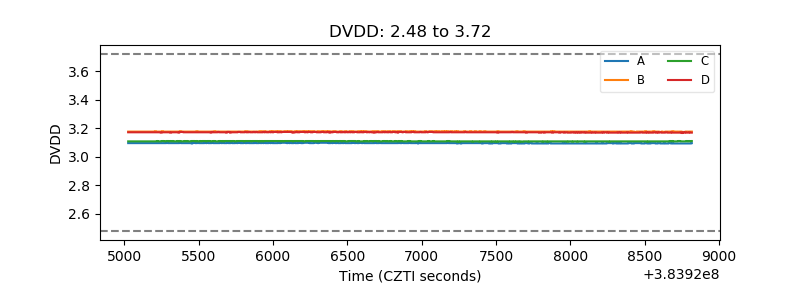 |
| Temperature 1 | 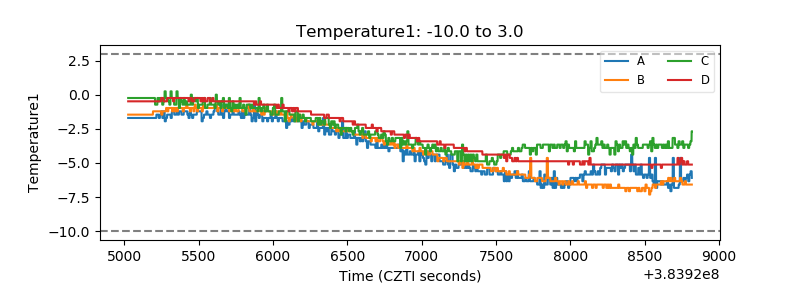 |
| Veto HV Monitor | 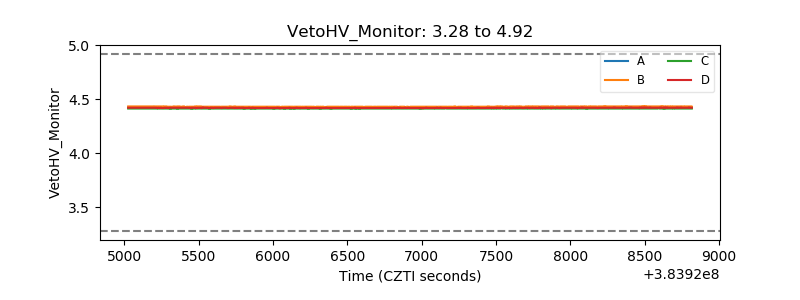 |
| Veto LLD | 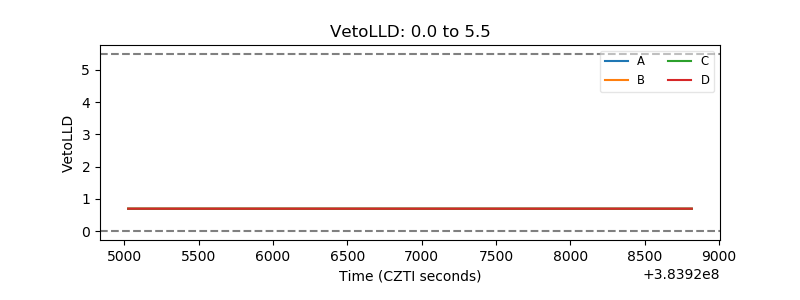 |
| Alpha Counter | 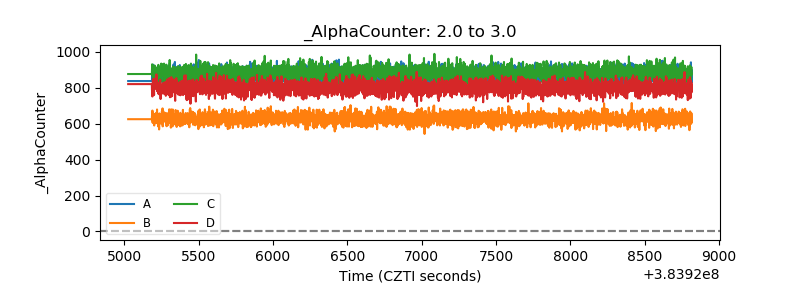 |
| _CPM_Rate | 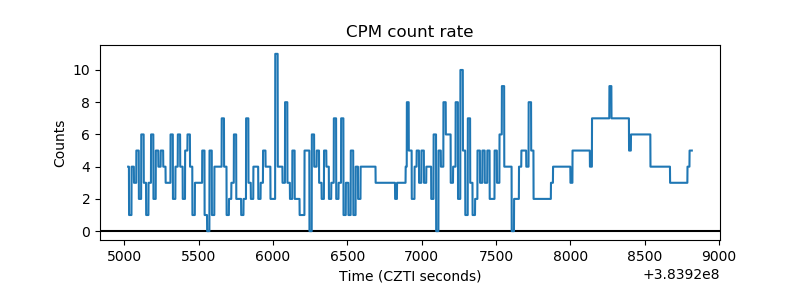 |
| CZT Counter | 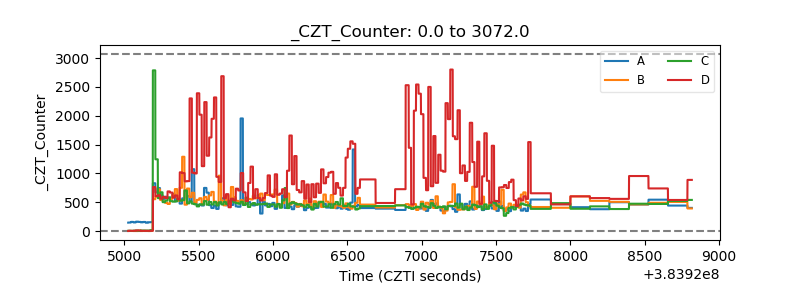 |
| +2.5 Volts monitor | 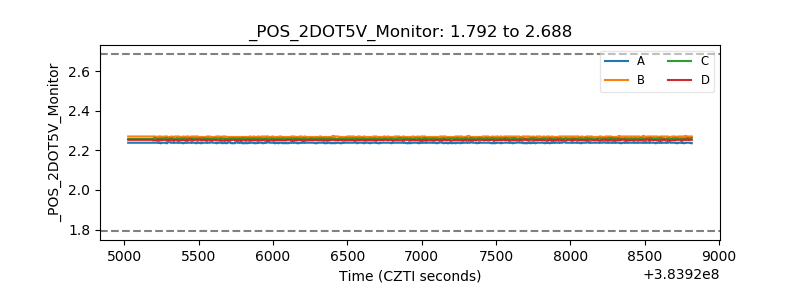 |
| +5 Volts monitor | 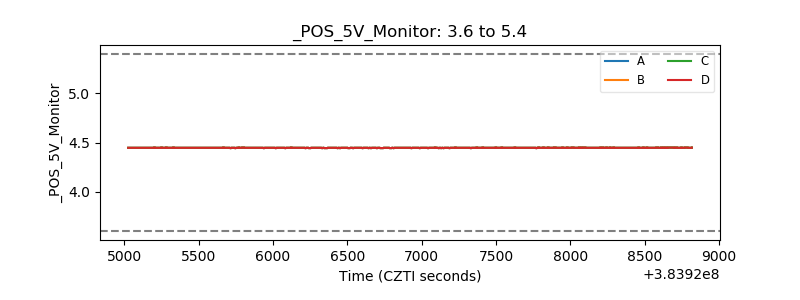 |
| _ROLL_ROT | 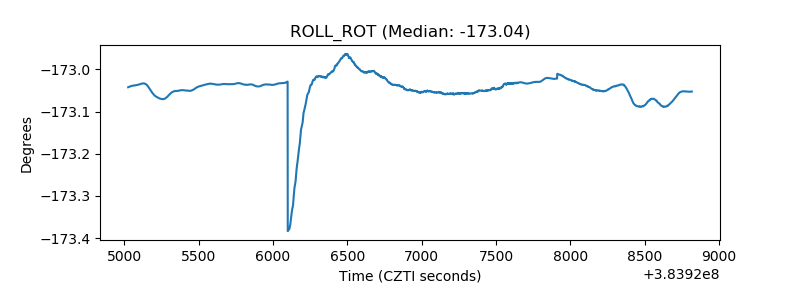 |
| _Roll_DEC | 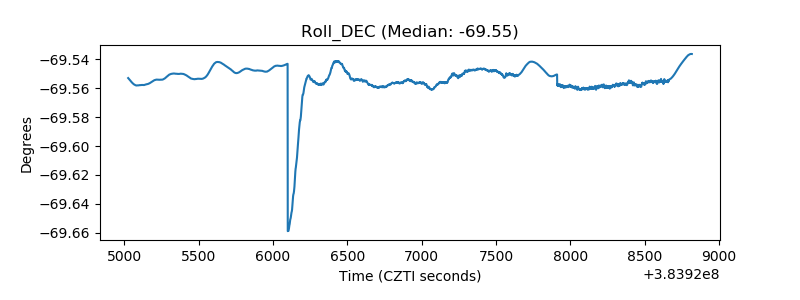 |
| _Roll_RA | 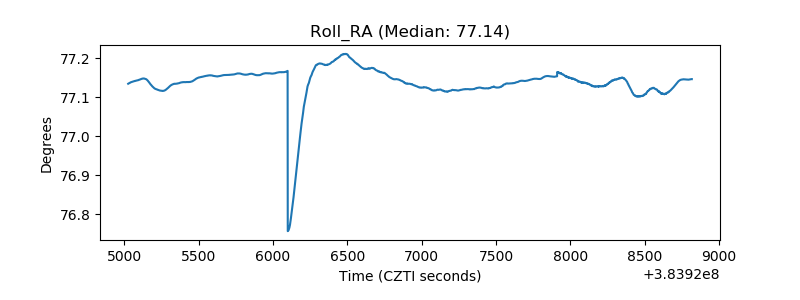 |
| Veto Counter | 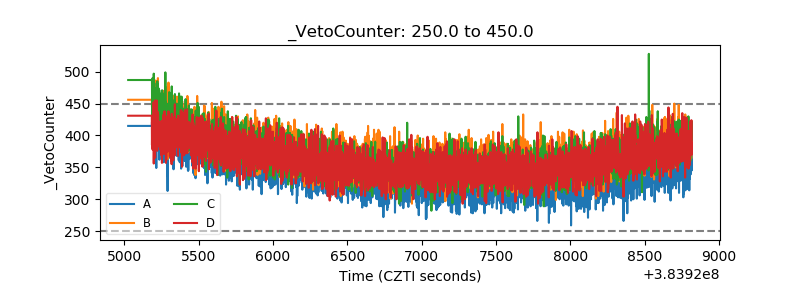 |