| Param | Original file | Final file |
|---|---|---|
| Filename | modeM0/AS1A10_094T37_9000004986_34746cztM0_level2.evt | modeM0/AS1A10_094T37_9000004986_34746cztM0_level2_quad_clean.evt |
| Size (bytes) | 205,810,560 | 26,700,480 |
| Size | 196.3 MB | 25.5 MB |
| Events in quadrant A | 1,241,054 | 162,624 |
| Events in quadrant B | 1,460,656 | 162,211 |
| Events in quadrant C | 1,291,846 | 161,608 |
| Events in quadrant D | 2,071,600 | 145,996 |
| Mode M9 | |||
|---|---|---|---|
| Quadrant | BADHDUFLAG | Total packets | Discarded packets |
| A | 0 | 13 | 0 |
| B | 0 | 13 | 0 |
| C | 0 | 13 | 0 |
| D | 0 | 13 | 0 |
| Mode M0 | |||
|---|---|---|---|
| Quadrant | BADHDUFLAG | Total packets | Discarded packets |
| A | 0 | 5149 | 2 |
| B | 0 | 5870 | 1 |
| C | 0 | 5179 | 1 |
| D | 0 | 7816 | 1 |
| Mode SS | |||
|---|---|---|---|
| Quadrant | BADHDUFLAG | Total packets | Discarded packets |
| A | 0 | 52 | 0 |
| B | 0 | 52 | 0 |
| C | 0 | 52 | 0 |
| D | 0 | 52 | 0 |
| Quadrant | Total seconds | Saturated seconds | Saturation percentage |
|---|---|---|---|
| A | 2437 | 8 | 0.328272% |
| B | 2437 | 46 | 1.887567% |
| C | 2437 | 13 | 0.533443% |
| D | 2437 | 215 | 8.822323% |
Noise dominated data is calculated using 1-second bins in cleaned event files. If a bin has >2000 counts, and if more than 50% of those come from <1% of pixels, then it is considered to be noise-dominated and hence unusable.
| Quadrant | # 1 sec bins | Bins with >0 counts | Bins with >2000 counts | High rate bins dominated by noise | Noise dominated (total time) | Noise dominated (detector-on time) | Marked lightcurve |
|---|---|---|---|---|---|---|---|
| A | 3749 | 2438 | 5 | 5 | 0.13% | 0.21% |  |
| B | 3749 | 2438 | 19 | 19 | 0.51% | 0.78% |  |
| C | 3749 | 2438 | 8 | 8 | 0.21% | 0.33% |  |
| D | 3749 | 2438 | 163 | 163 | 4.35% | 6.69% |  |
Top three noisy pixels from each quadrant. If the there are fewer than three noisy pixels in the level2.evt file, extra rows are filled as -1
| Pixel properties | Quadrant properties | ||||||
|---|---|---|---|---|---|---|---|
| Quadrant | DetID | PixID | Counts | Sigma | Mean | Median | Sigma |
| A | 15 | 223 | 26981 | 433.38 | 294 | 288 | 61.6 |
| A | 10 | 83 | 25167 | 403.93 | 294 | 288 | 61.6 |
| A | 15 | 174 | 20052 | 320.89 | 294 | 288 | 61.6 |
| B | 5 | 255 | 92883 | 1618.21 | 291 | 283 | 57.2 |
| B | 5 | 172 | 88621 | 1543.73 | 291 | 283 | 57.2 |
| B | 0 | 190 | 72129 | 1255.53 | 291 | 283 | 57.2 |
| C | 15 | 214 | 106001 | 1521.37 | 289 | 290 | 69.5 |
| C | 0 | 10 | 42670 | 609.93 | 289 | 290 | 69.5 |
| C | 8 | 79 | 6899 | 95.12 | 289 | 290 | 69.5 |
| D | 2 | 250 | 428821 | 6166.06 | 276 | 268 | 69.5 |
| D | 8 | 195 | 328480 | 4722.34 | 276 | 268 | 69.5 |
| D | 10 | 118 | 96083 | 1378.59 | 276 | 268 | 69.5 |
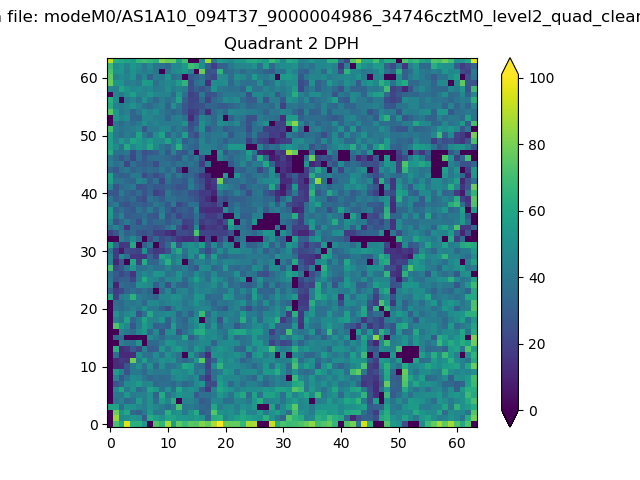
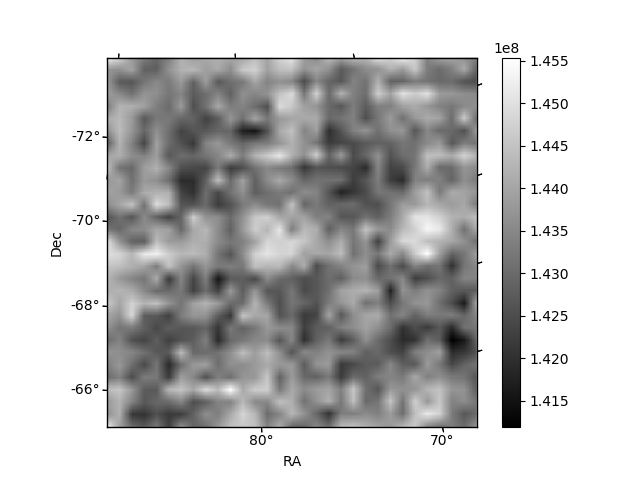
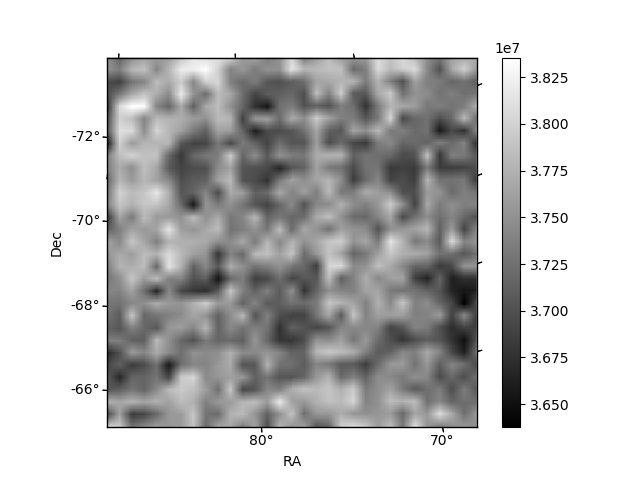
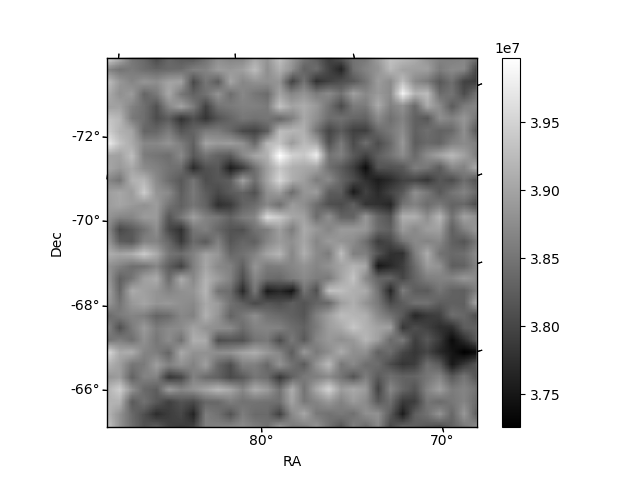
Histogram calculated using DETX and DETY for each event in the final _common_clean file
| Quadrant A | 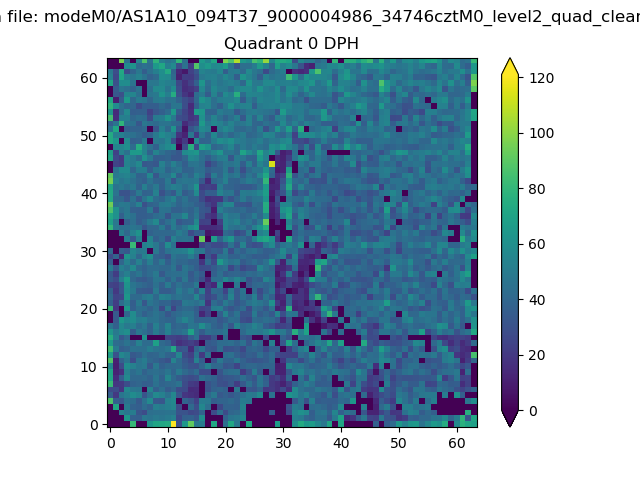 |
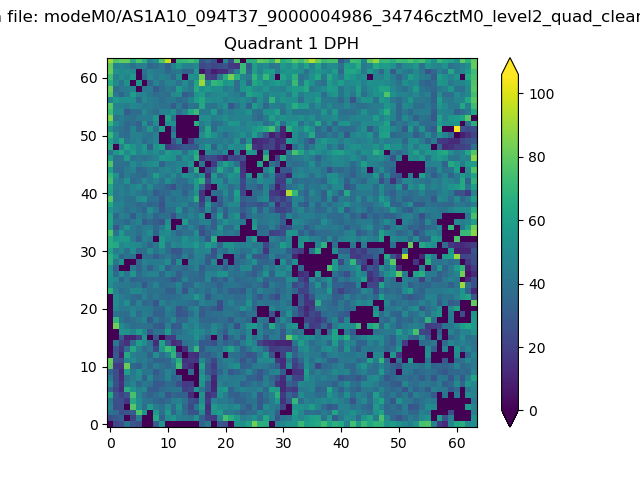 |
Quadrant B |
|---|---|---|---|
| Quadrant D | 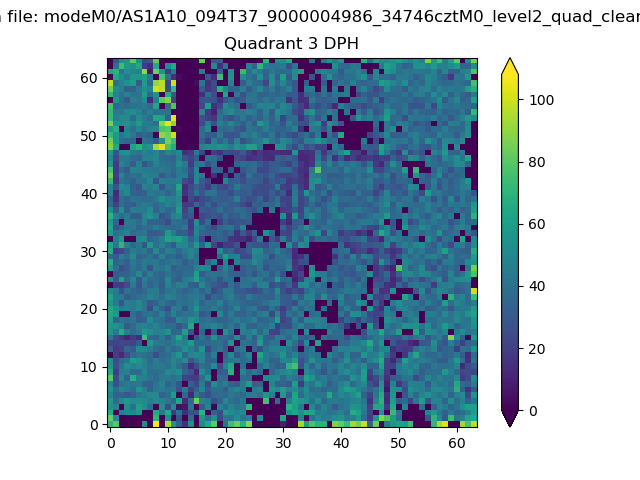 |
 |
Quadrant C |
| Plot type | Count rate plots | Images |
|---|---|---|
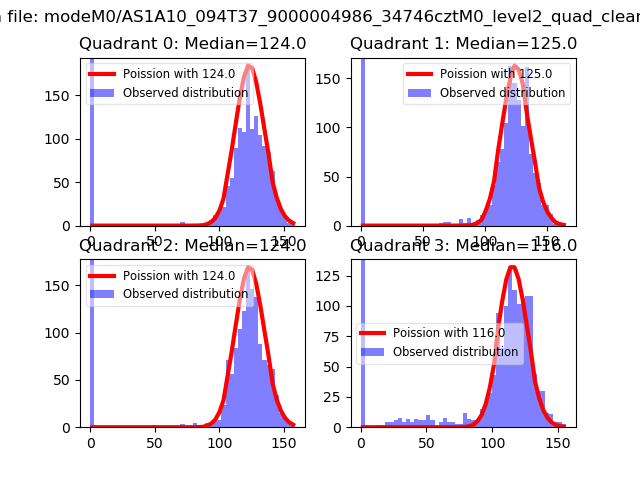
| Comparison with Poisson distribution Blue bars denote a histogram of data divided into 1 sec bins. Red curve is a Poisson curve with rate = median count rate of data. |
 |
 |
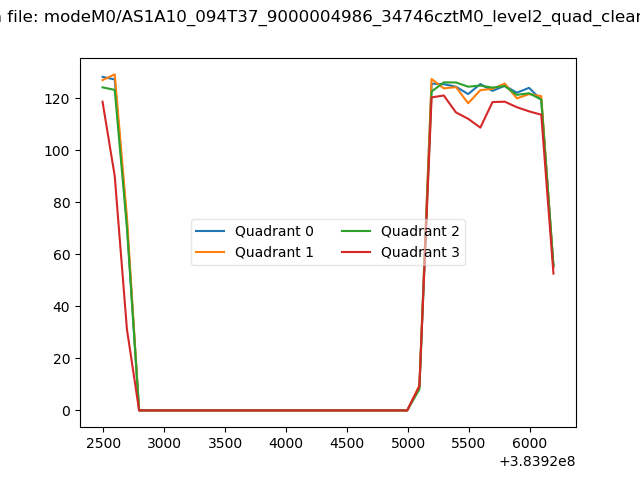
| Quadrant-wise count rates Data is divided into 100 sec bins |
 |
|
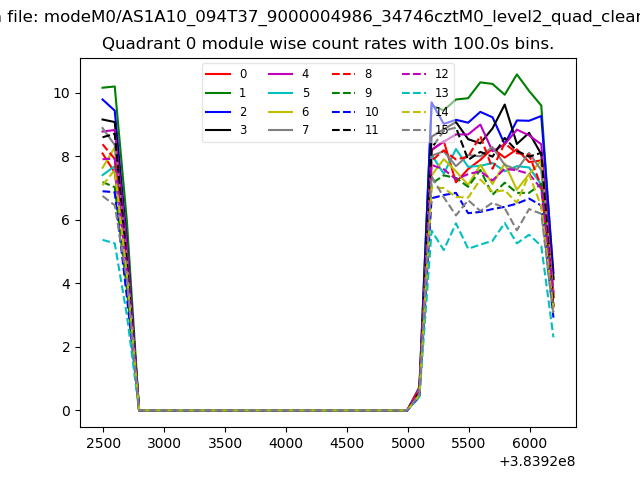
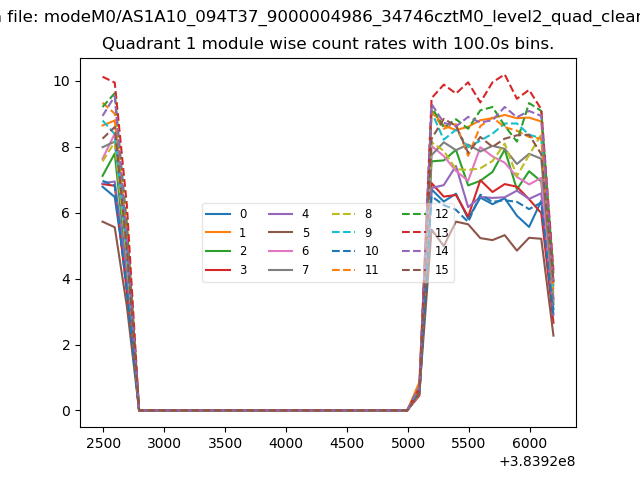
| Module-wise count rates for Quadrant A Data is divided into 100 sec bins |
 |
 |
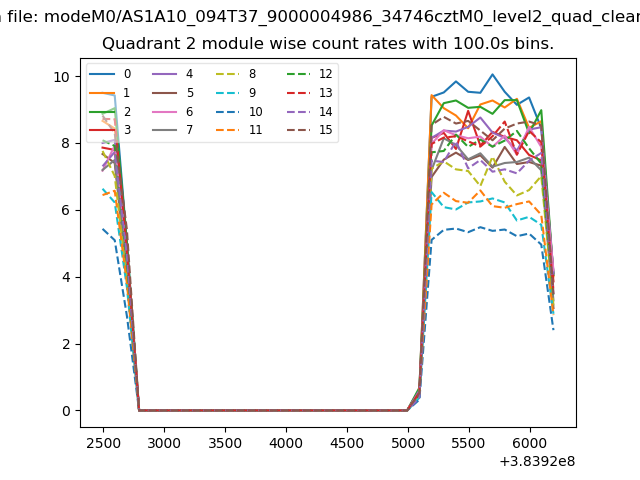
| Module-wise count rates for Quadrant B Data is divided into 100 sec bins |
 |
 |
| Module-wise count rates for Quadrant C Data is divided into 100 sec bins |
 |
 |
| Module-wise count rates for Quadrant D Data is divided into 100 sec bins |
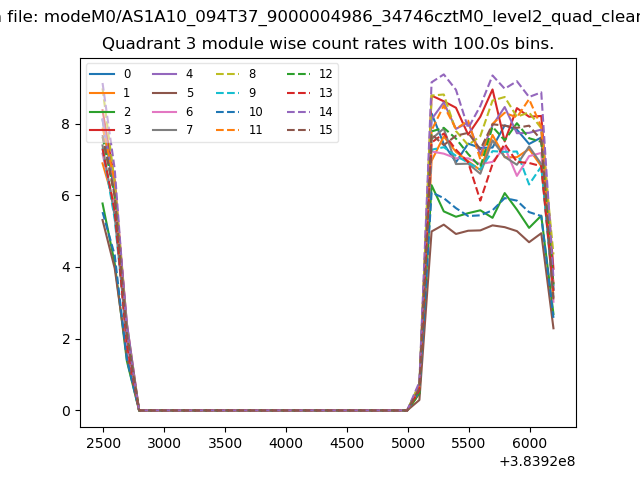 |
 |
| Parameter | Plot |
|---|---|
| CZT HV Monitor | 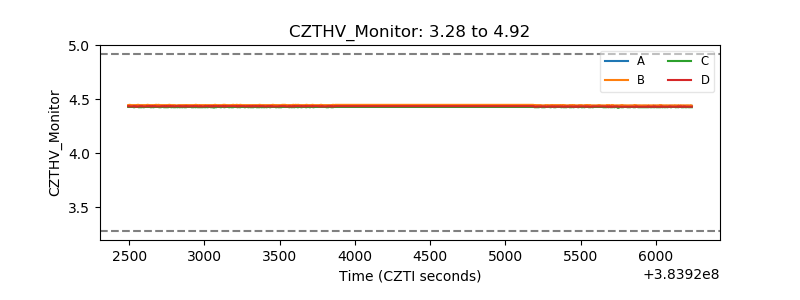 |
| D_VDD | 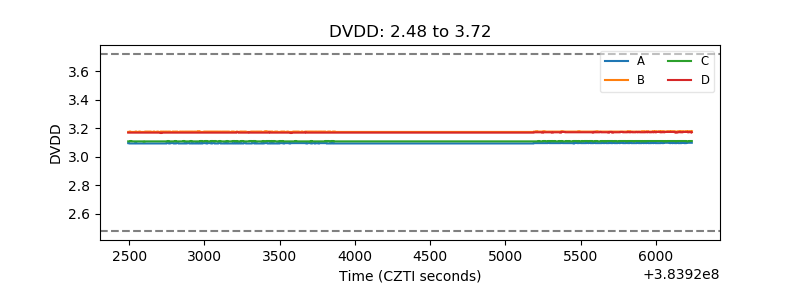 |
| Temperature 1 | 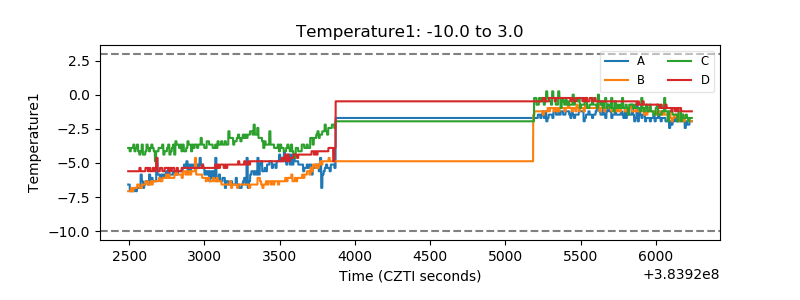 |
| Veto HV Monitor | 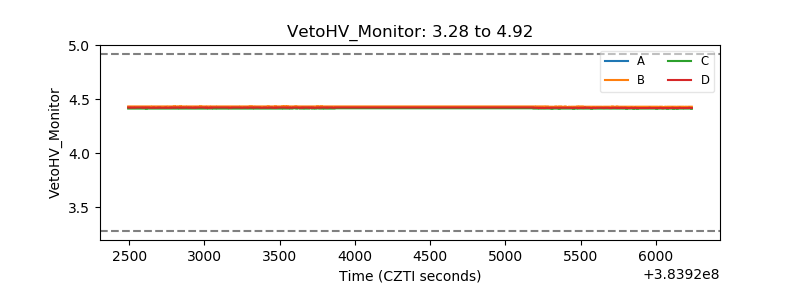 |
| Veto LLD | 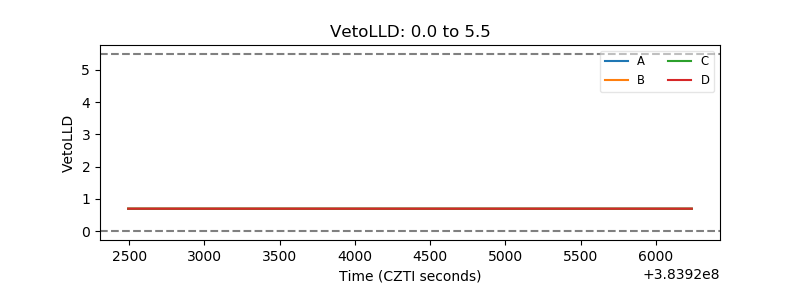 |
| Alpha Counter | 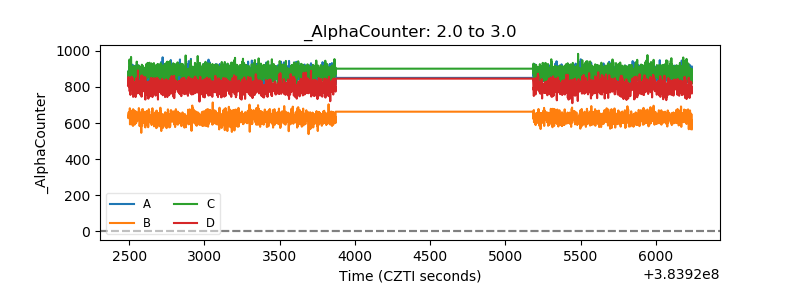 |
| _CPM_Rate | 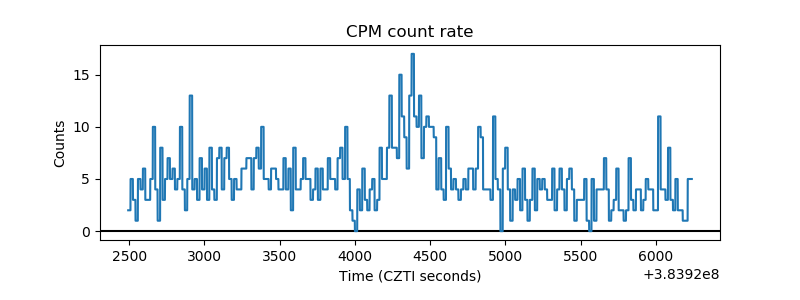 |
| CZT Counter | 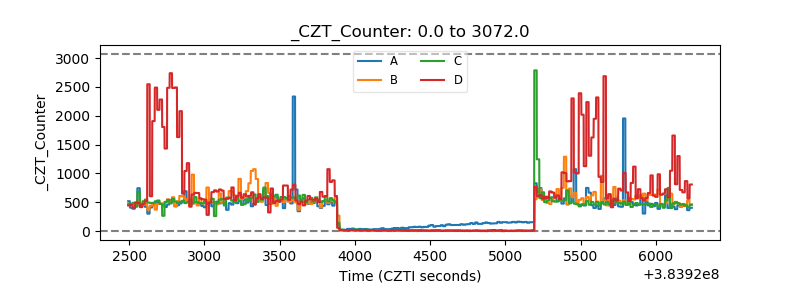 |
| +2.5 Volts monitor | 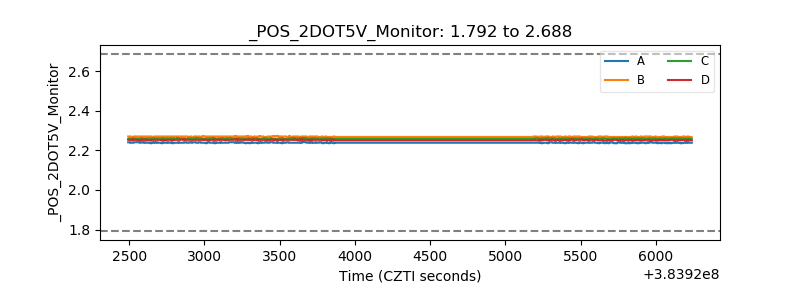 |
| +5 Volts monitor | 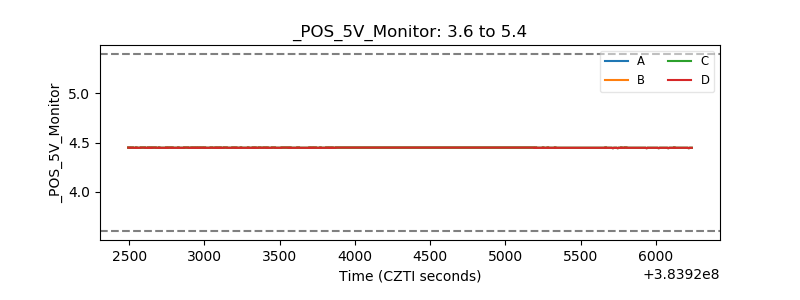 |
| _ROLL_ROT | 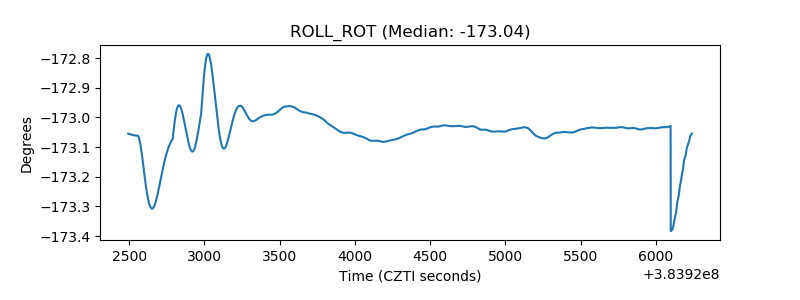 |
| _Roll_DEC | 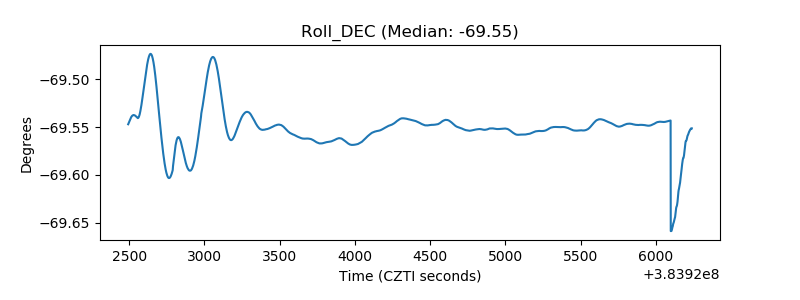 |
| _Roll_RA | 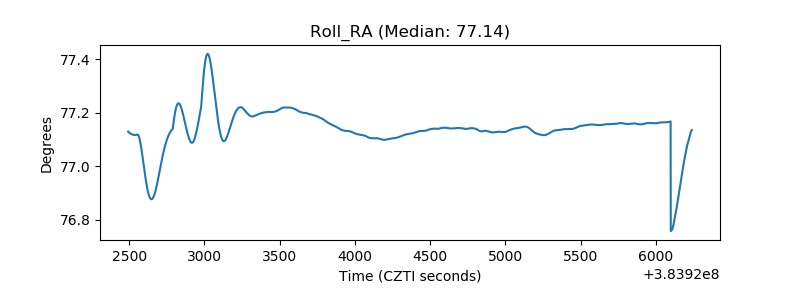 |
| Veto Counter | 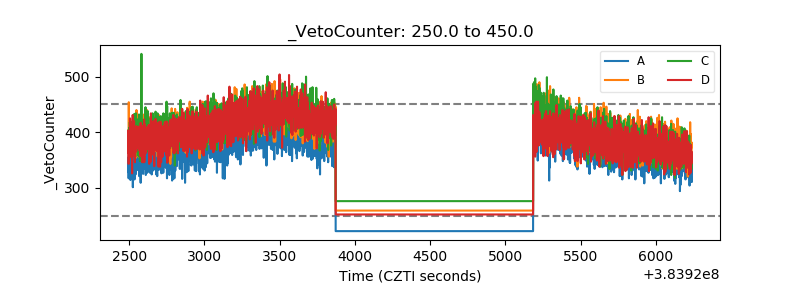 |