| Param | Original file | Final file |
|---|---|---|
| Filename | modeM0/AS1A10_048T04_9000004984_34746cztM0_level2.evt | modeM0/AS1A10_048T04_9000004984_34746cztM0_level2_quad_clean.evt |
| Size (bytes) | 226,949,760 | 30,032,640 |
| Size | 216.4 MB | 28.6 MB |
| Events in quadrant A | 1,397,606 | 176,809 |
| Events in quadrant B | 1,661,790 | 177,605 |
| Events in quadrant C | 1,475,699 | 179,048 |
| Events in quadrant D | 2,139,360 | 168,517 |
| Mode SS | |||
|---|---|---|---|
| Quadrant | BADHDUFLAG | Total packets | Discarded packets |
| A | 0 | 60 | 0 |
| B | 0 | 60 | 0 |
| C | 0 | 60 | 0 |
| D | 0 | 60 | 0 |
| Mode M0 | |||
|---|---|---|---|
| Quadrant | BADHDUFLAG | Total packets | Discarded packets |
| A | 0 | 6018 | 1 |
| B | 0 | 6759 | 1 |
| C | 0 | 6065 | 1 |
| D | 0 | 8344 | 1 |
| Mode M9 | |||
|---|---|---|---|
| Quadrant | BADHDUFLAG | Total packets | Discarded packets |
| A | 0 | 14 | 0 |
| B | 0 | 14 | 0 |
| C | 0 | 14 | 0 |
| D | 0 | 14 | 0 |
| Quadrant | Total seconds | Saturated seconds | Saturation percentage |
|---|---|---|---|
| A | 2898 | 9 | 0.310559% |
| B | 2898 | 20 | 0.690131% |
| C | 2898 | 20 | 0.690131% |
| D | 2898 | 95 | 3.278123% |
Noise dominated data is calculated using 1-second bins in cleaned event files. If a bin has >2000 counts, and if more than 50% of those come from <1% of pixels, then it is considered to be noise-dominated and hence unusable.
| Quadrant | # 1 sec bins | Bins with >0 counts | Bins with >2000 counts | High rate bins dominated by noise | Noise dominated (total time) | Noise dominated (detector-on time) | Marked lightcurve |
|---|---|---|---|---|---|---|---|
| A | 4301 | 2899 | 3 | 3 | 0.07% | 0.10% | 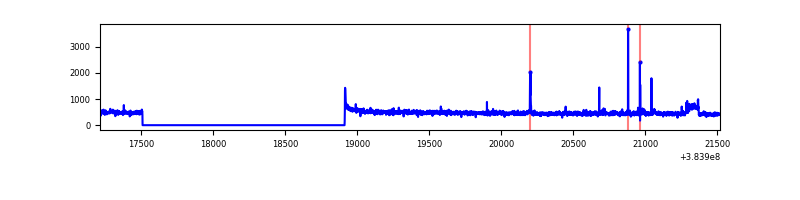 |
| B | 4301 | 2899 | 6 | 6 | 0.14% | 0.21% | 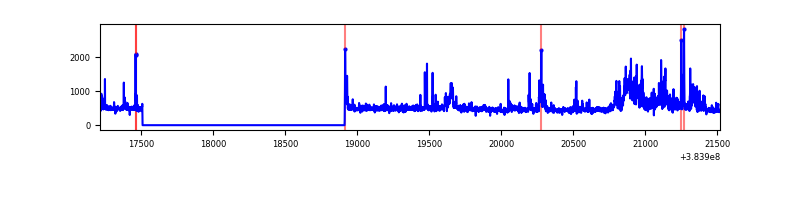 |
| C | 4301 | 2899 | 10 | 10 | 0.23% | 0.34% | 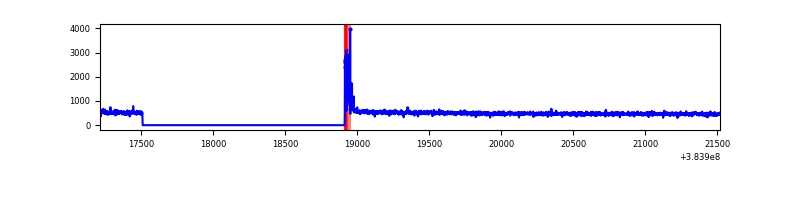 |
| D | 4301 | 2899 | 64 | 64 | 1.49% | 2.21% | 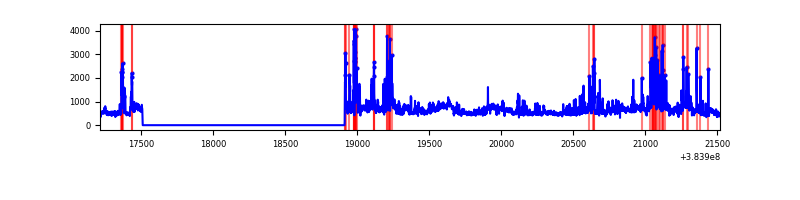 |
Top three noisy pixels from each quadrant. If the there are fewer than three noisy pixels in the level2.evt file, extra rows are filled as -1
| Pixel properties | Quadrant properties | ||||||
|---|---|---|---|---|---|---|---|
| Quadrant | DetID | PixID | Counts | Sigma | Mean | Median | Sigma |
| A | 10 | 83 | 24812 | 348.2 | 338 | 331 | 70.3 |
| A | 15 | 169 | 24705 | 346.67 | 338 | 331 | 70.3 |
| A | 9 | 143 | 12390 | 171.52 | 338 | 331 | 70.3 |
| B | 0 | 190 | 143831 | 2154.18 | 336 | 327 | 66.6 |
| B | 5 | 172 | 98525 | 1474.08 | 336 | 327 | 66.6 |
| B | 5 | 255 | 85598 | 1280.03 | 336 | 327 | 66.6 |
| C | 15 | 214 | 122530 | 1548.98 | 329 | 330 | 78.9 |
| C | 0 | 10 | 60152 | 758.29 | 329 | 330 | 78.9 |
| C | 0 | 207 | 6993 | 84.46 | 329 | 330 | 78.9 |
| D | 8 | 195 | 457091 | 5580.5 | 326 | 317 | 81.9 |
| D | 2 | 250 | 205700 | 2509.2 | 326 | 317 | 81.9 |
| D | 12 | 6 | 109357 | 1332.16 | 326 | 317 | 81.9 |
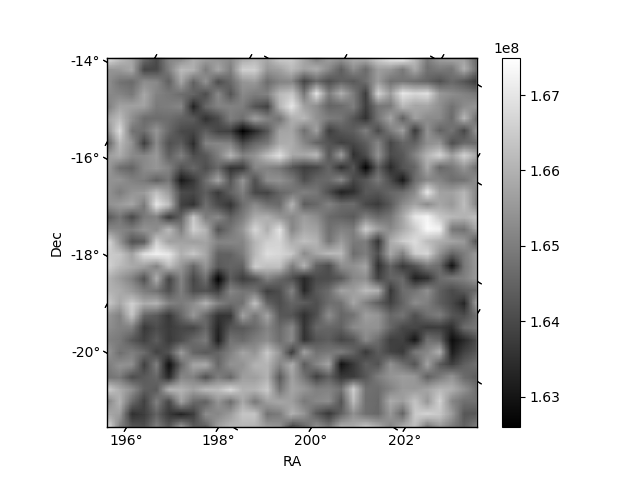
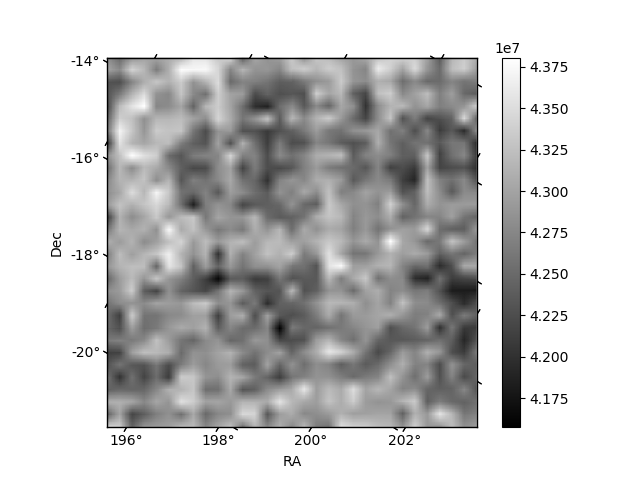
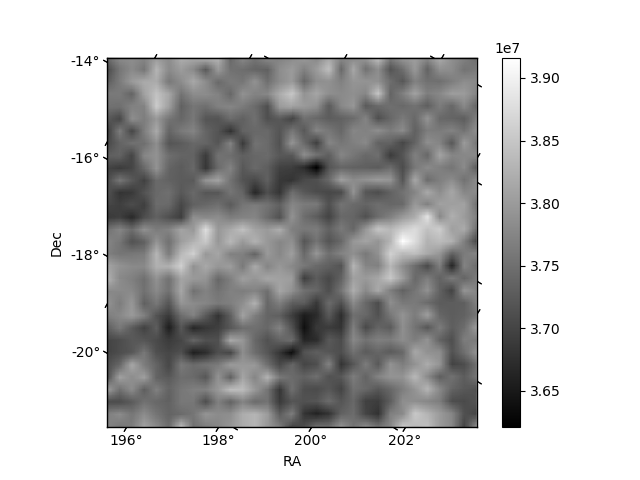
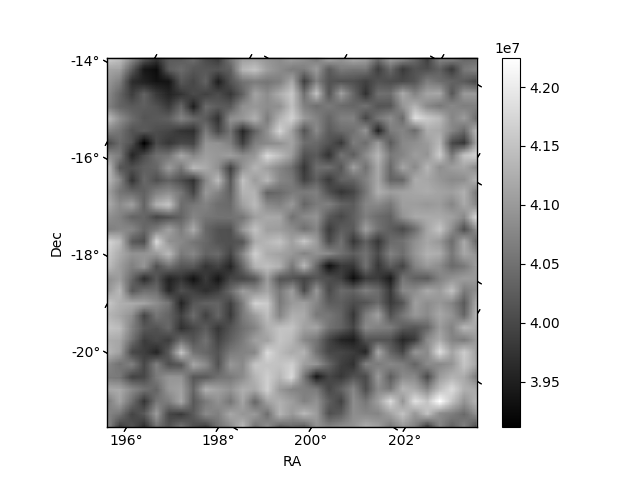
Histogram calculated using DETX and DETY for each event in the final _common_clean file
| Quadrant A | 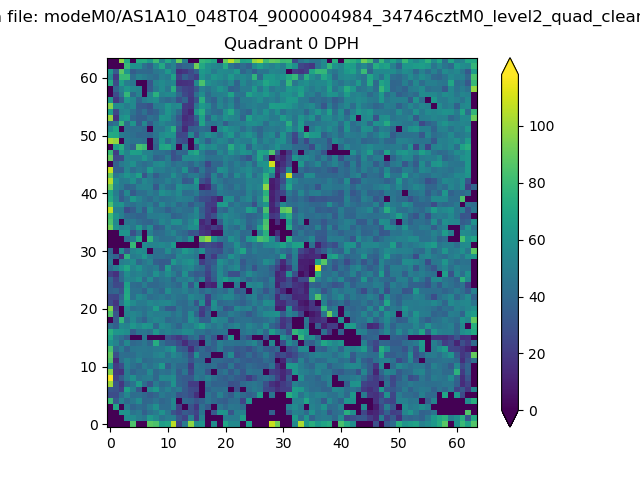 |
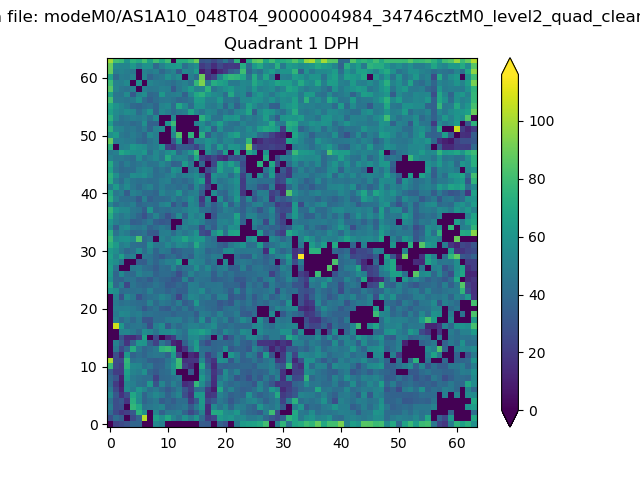 |
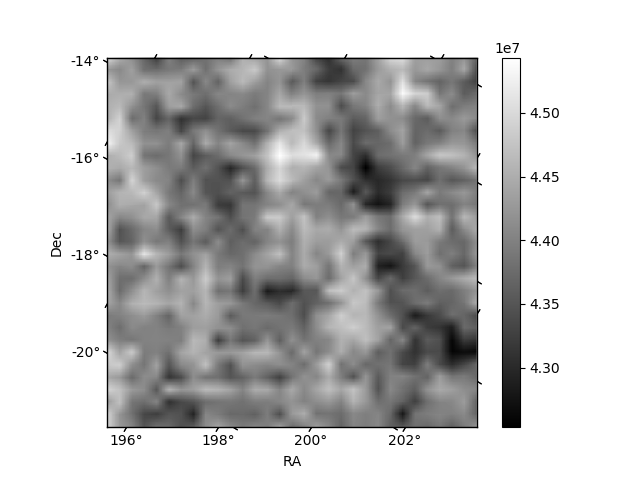
Quadrant B |
|---|---|---|---|
| Quadrant D | 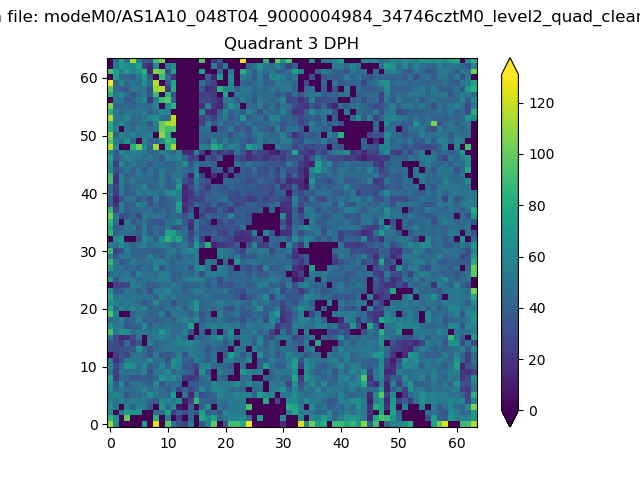 |
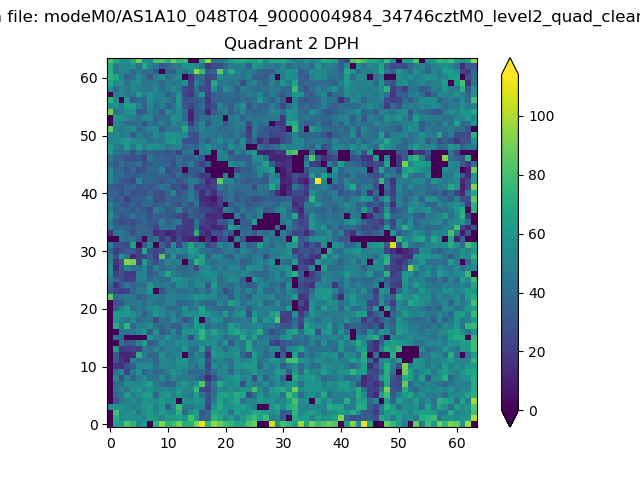 |
Quadrant C |
| Plot type | Count rate plots | Images |
|---|---|---|
| Comparison with Poisson distribution Blue bars denote a histogram of data divided into 1 sec bins. Red curve is a Poisson curve with rate = median count rate of data. |
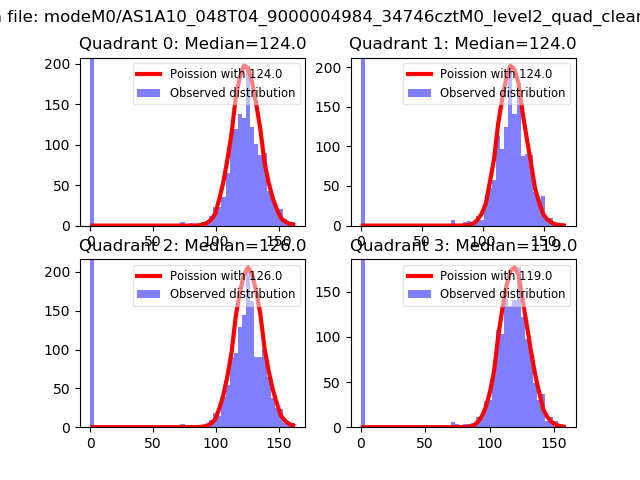 |
 |
| Quadrant-wise count rates Data is divided into 100 sec bins |
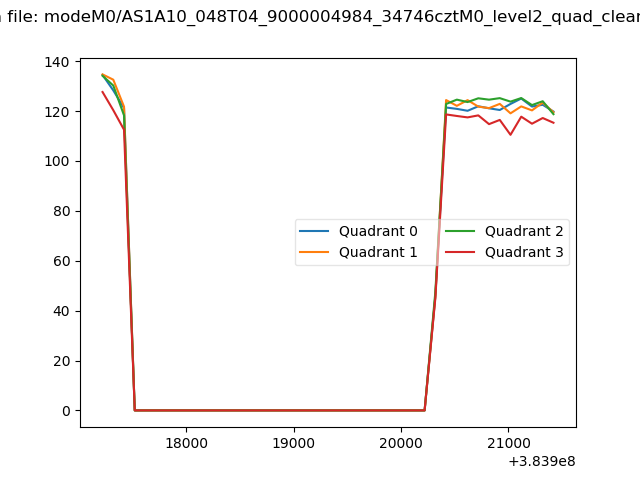 |
|
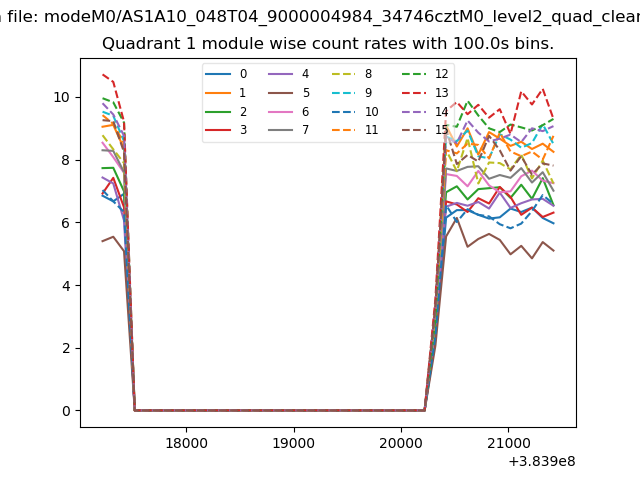
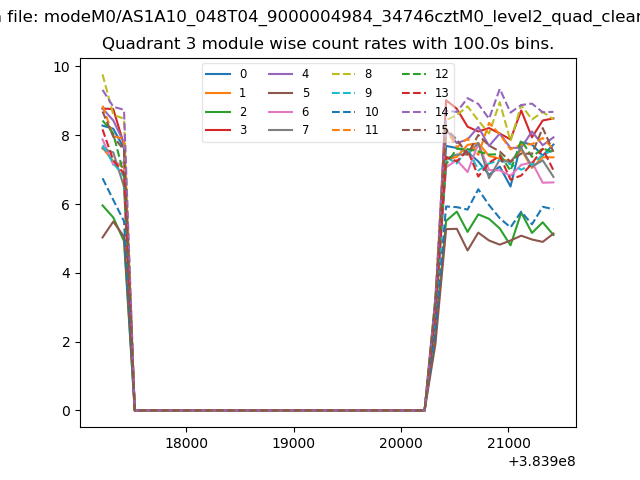
| Module-wise count rates for Quadrant A Data is divided into 100 sec bins |
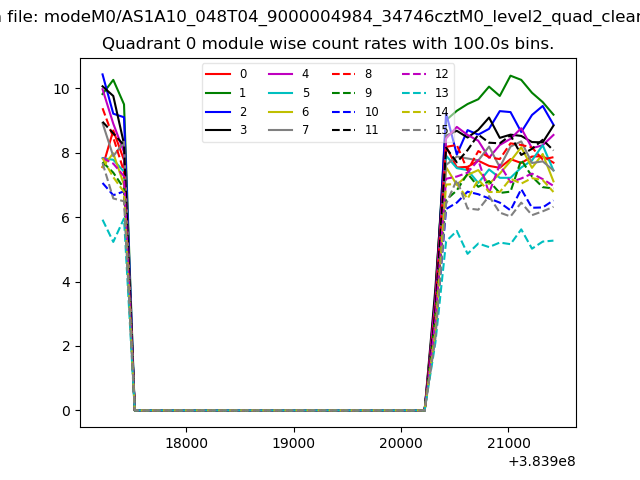 |
 |
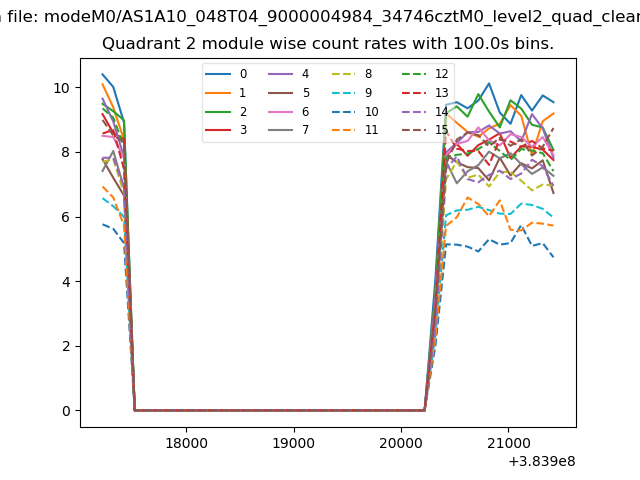
| Module-wise count rates for Quadrant B Data is divided into 100 sec bins |
 |
 |
| Module-wise count rates for Quadrant C Data is divided into 100 sec bins |
 |
 |
| Module-wise count rates for Quadrant D Data is divided into 100 sec bins |
 |
 |
| Parameter | Plot |
|---|---|
| CZT HV Monitor | 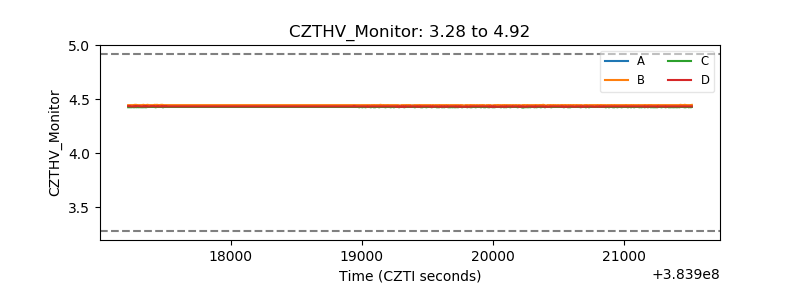 |
| D_VDD | 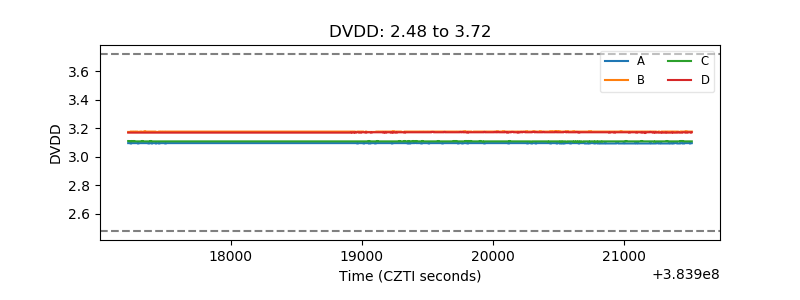 |
| Temperature 1 | 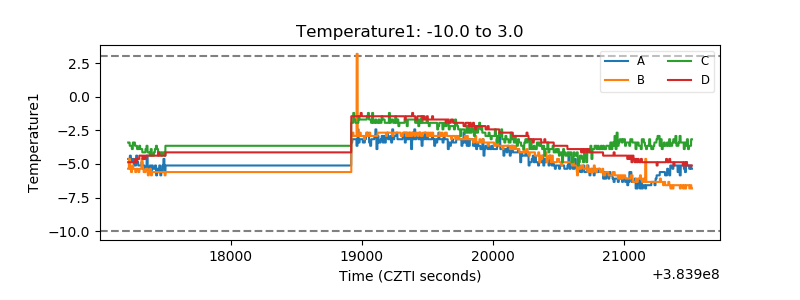 |
| Veto HV Monitor | 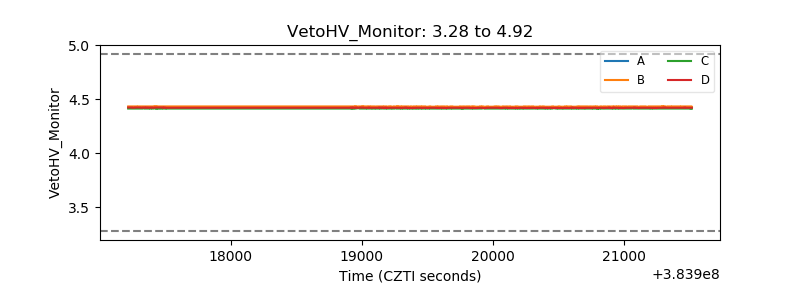 |
| Veto LLD | 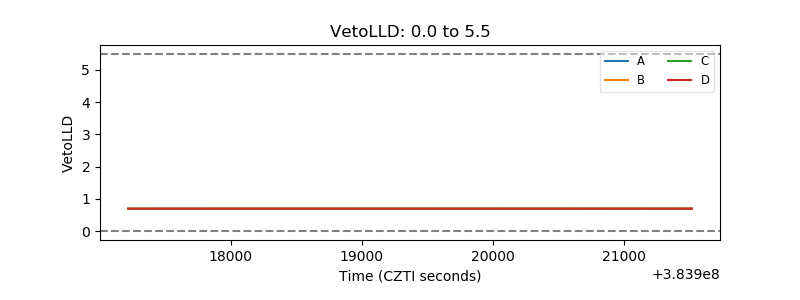 |
| Alpha Counter | 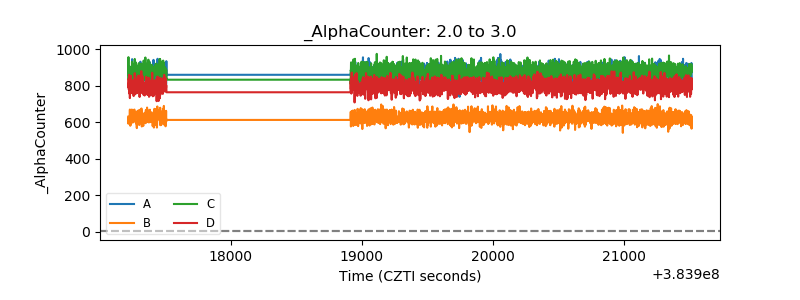 |
| _CPM_Rate | 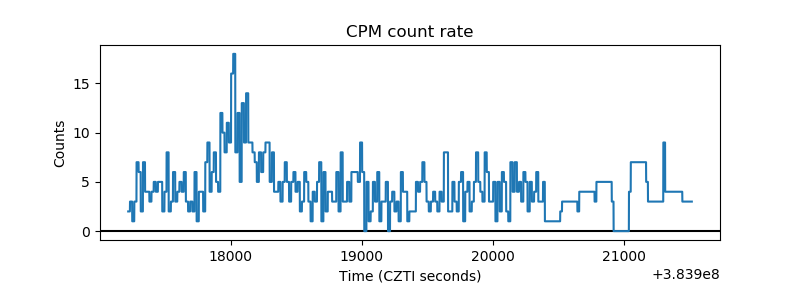 |
| CZT Counter | 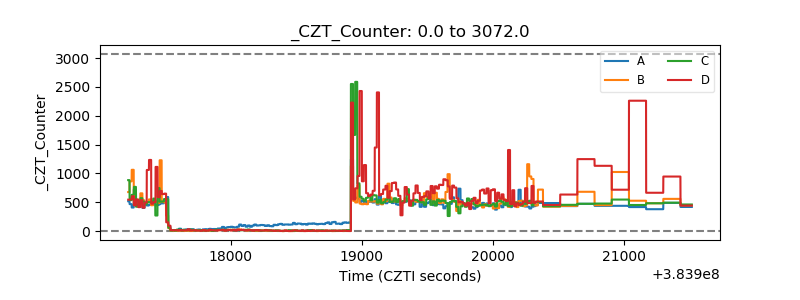 |
| +2.5 Volts monitor | 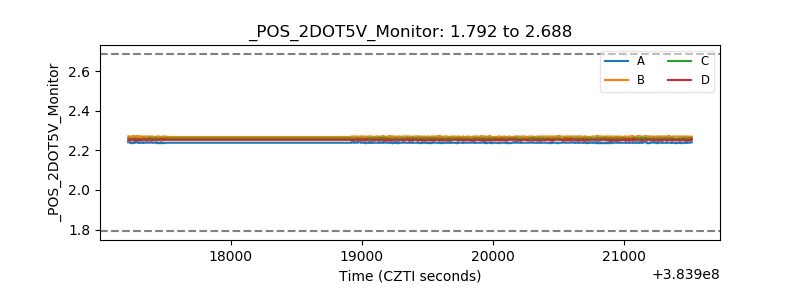 |
| +5 Volts monitor | 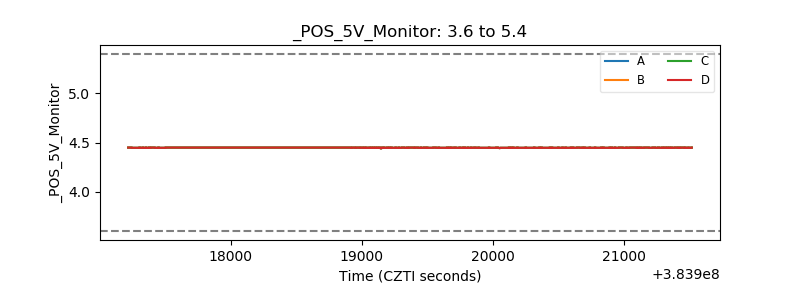 |
| _ROLL_ROT | 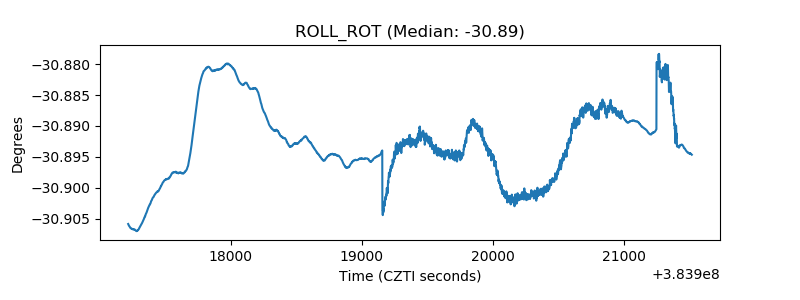 |
| _Roll_DEC | 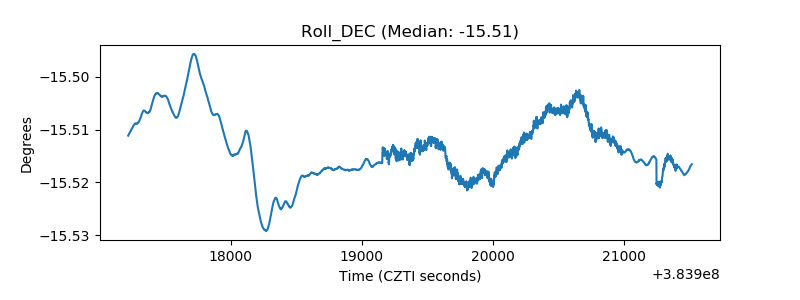 |
| _Roll_RA | 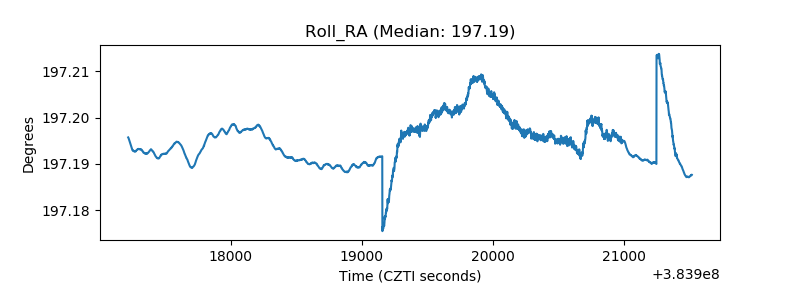 |
| Veto Counter | 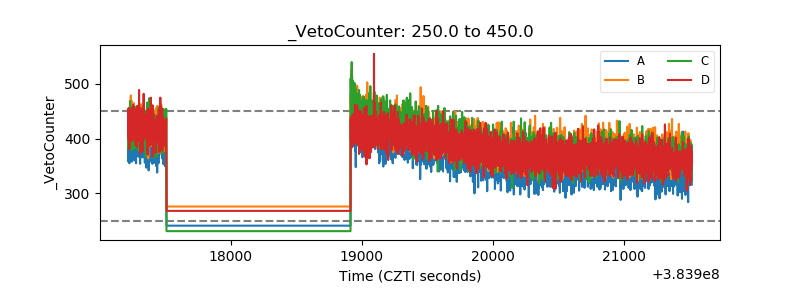 |