| Param | Original file | Final file |
|---|---|---|
| Filename | modeM0/AS1A10_048T04_9000004984_34745cztM0_level2.evt | modeM0/AS1A10_048T04_9000004984_34745cztM0_level2_quad_clean.evt |
| Size (bytes) | 456,088,320 | 62,778,240 |
| Size | 435.0 MB | 59.9 MB |
| Events in quadrant A | 2,741,166 | 379,115 |
| Events in quadrant B | 3,563,013 | 382,815 |
| Events in quadrant C | 2,978,856 | 382,223 |
| Events in quadrant D | 4,145,659 | 360,996 |
| Mode SS | |||
|---|---|---|---|
| Quadrant | BADHDUFLAG | Total packets | Discarded packets |
| A | 0 | 114 | 0 |
| B | 0 | 114 | 0 |
| C | 0 | 114 | 0 |
| D | 0 | 114 | 0 |
| Mode M0 | |||
|---|---|---|---|
| Quadrant | BADHDUFLAG | Total packets | Discarded packets |
| A | 0 | 11732 | 3 |
| B | 0 | 14187 | 2 |
| C | 0 | 12107 | 2 |
| D | 0 | 16146 | 2 |
| Mode M9 | |||
|---|---|---|---|
| Quadrant | BADHDUFLAG | Total packets | Discarded packets |
| A | 0 | 24 | 0 |
| B | 0 | 24 | 0 |
| C | 0 | 24 | 0 |
| D | 0 | 25 | 0 |
| Quadrant | Total seconds | Saturated seconds | Saturation percentage |
|---|---|---|---|
| A | 5658 | 20 | 0.353482% |
| B | 5658 | 272 | 4.807352% |
| C | 5658 | 44 | 0.777660% |
| D | 5658 | 183 | 3.234358% |
Noise dominated data is calculated using 1-second bins in cleaned event files. If a bin has >2000 counts, and if more than 50% of those come from <1% of pixels, then it is considered to be noise-dominated and hence unusable.
| Quadrant | # 1 sec bins | Bins with >0 counts | Bins with >2000 counts | High rate bins dominated by noise | Noise dominated (total time) | Noise dominated (detector-on time) | Marked lightcurve |
|---|---|---|---|---|---|---|---|
| A | 7061 | 5659 | 12 | 12 | 0.17% | 0.21% | 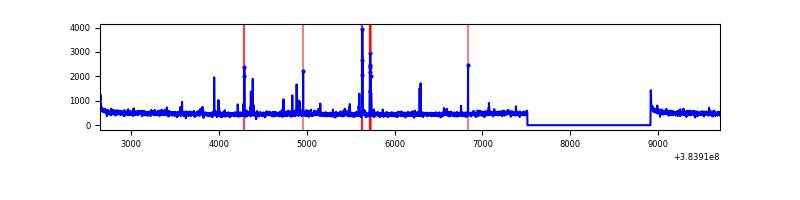 |
| B | 7061 | 5659 | 195 | 195 | 2.76% | 3.45% | 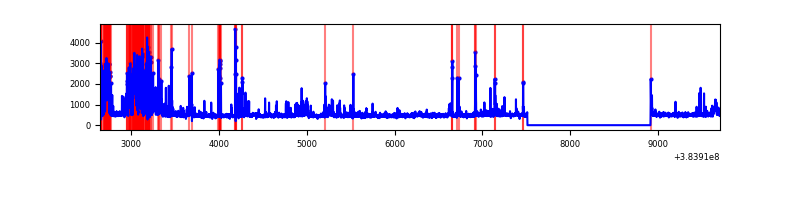 |
| C | 7061 | 5659 | 23 | 23 | 0.33% | 0.41% | 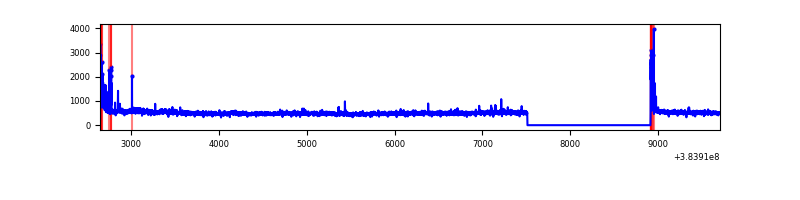 |
| D | 7061 | 5659 | 141 | 141 | 2.00% | 2.49% | 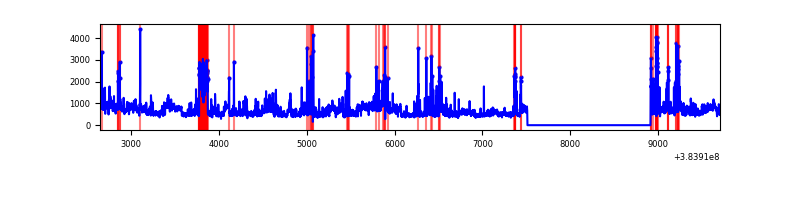 |
Top three noisy pixels from each quadrant. If the there are fewer than three noisy pixels in the level2.evt file, extra rows are filled as -1
| Pixel properties | Quadrant properties | ||||||
|---|---|---|---|---|---|---|---|
| Quadrant | DetID | PixID | Counts | Sigma | Mean | Median | Sigma |
| A | 15 | 223 | 57725 | 425.58 | 664 | 651 | 134.1 |
| A | 10 | 83 | 48953 | 360.17 | 664 | 651 | 134.1 |
| A | 9 | 143 | 34571 | 252.93 | 664 | 651 | 134.1 |
| B | 4 | 171 | 631489 | 5072.88 | 650 | 633 | 124.4 |
| B | 5 | 255 | 152256 | 1219.24 | 650 | 633 | 124.4 |
| B | 5 | 172 | 131834 | 1055.02 | 650 | 633 | 124.4 |
| C | 15 | 214 | 239066 | 1568.37 | 649 | 653 | 152.0 |
| C | 0 | 10 | 139516 | 913.49 | 649 | 653 | 152.0 |
| C | 14 | 67 | 37919 | 245.15 | 649 | 653 | 152.0 |
| D | 8 | 195 | 820856 | 5190.64 | 642 | 624 | 158.0 |
| D | 2 | 250 | 410325 | 2592.69 | 642 | 624 | 158.0 |
| D | 8 | 230 | 171223 | 1079.59 | 642 | 624 | 158.0 |
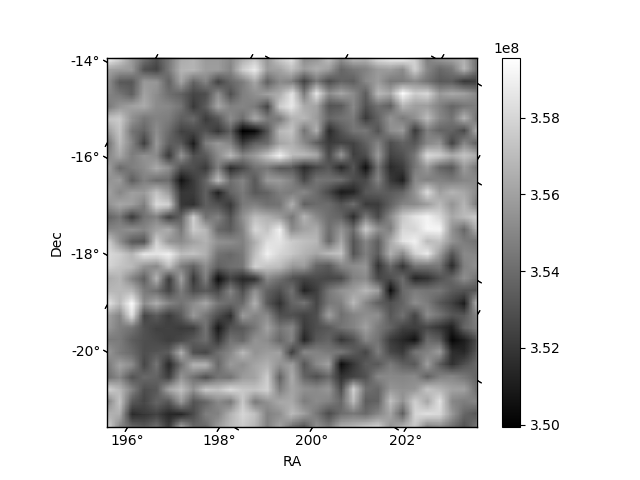
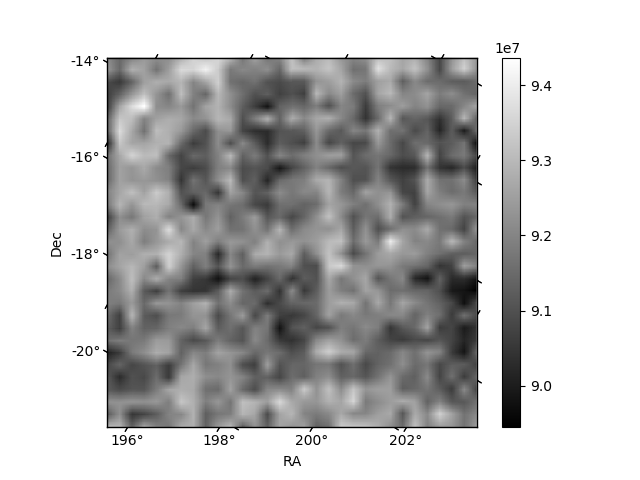
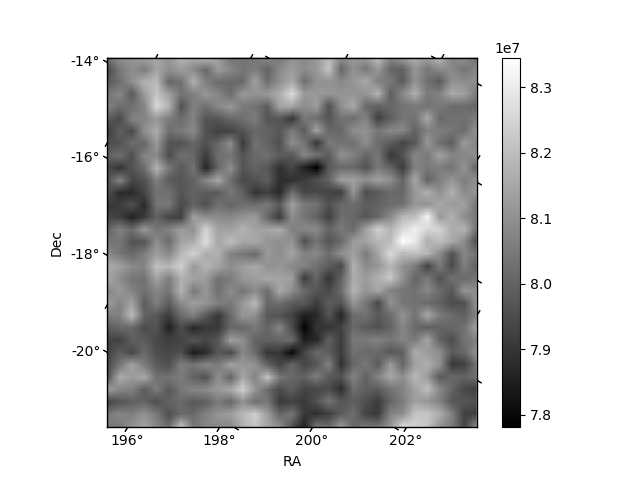
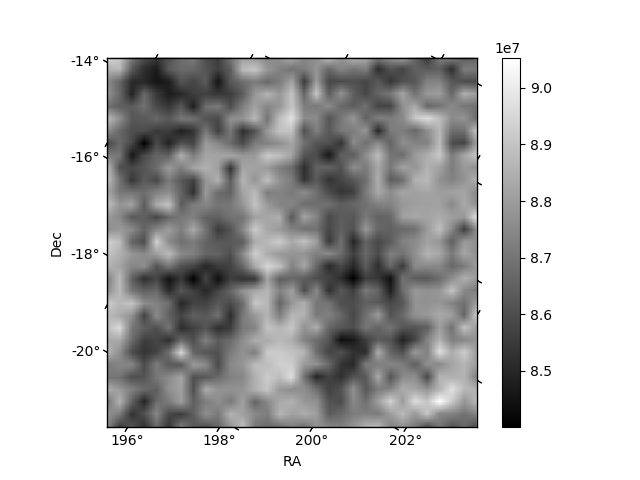
Histogram calculated using DETX and DETY for each event in the final _common_clean file
| Quadrant A | 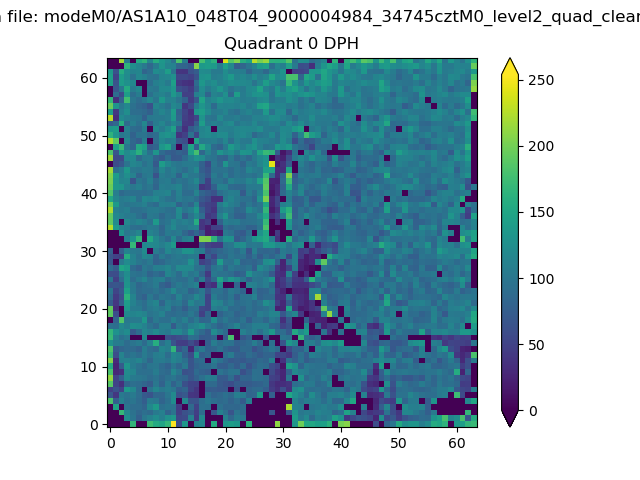 |
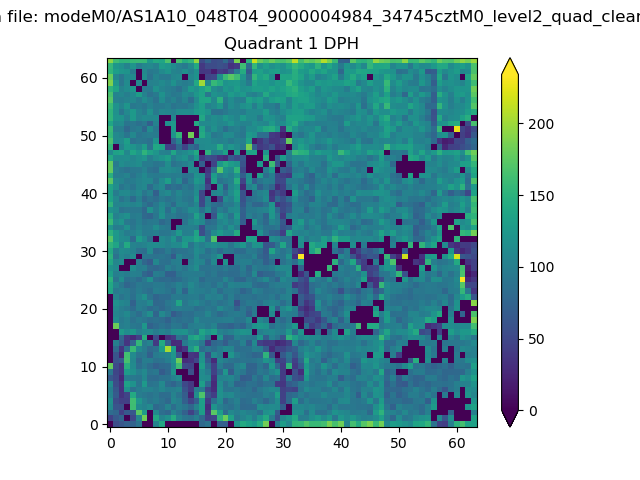 |
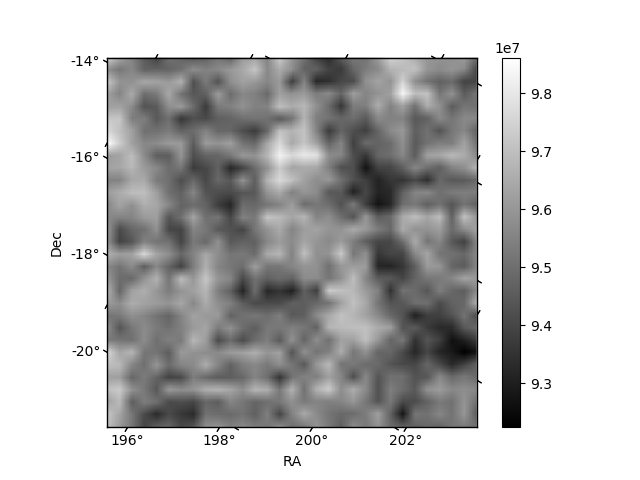
Quadrant B |
|---|---|---|---|
| Quadrant D | 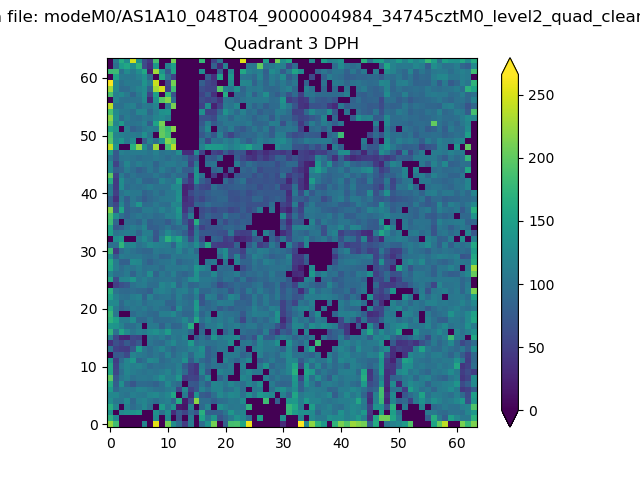 |
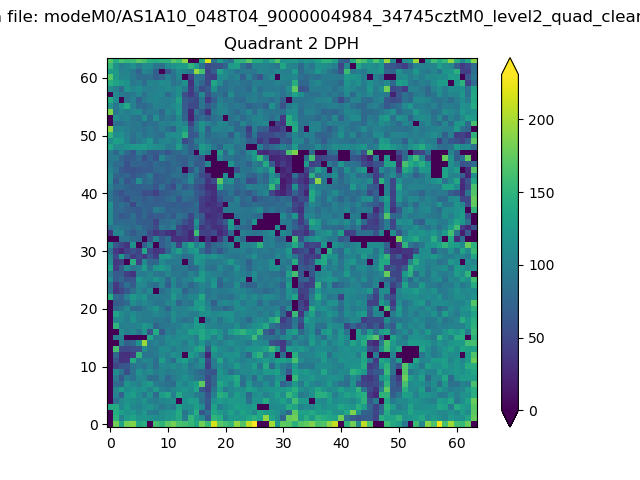 |
Quadrant C |
| Plot type | Count rate plots | Images |
|---|---|---|
| Comparison with Poisson distribution Blue bars denote a histogram of data divided into 1 sec bins. Red curve is a Poisson curve with rate = median count rate of data. |
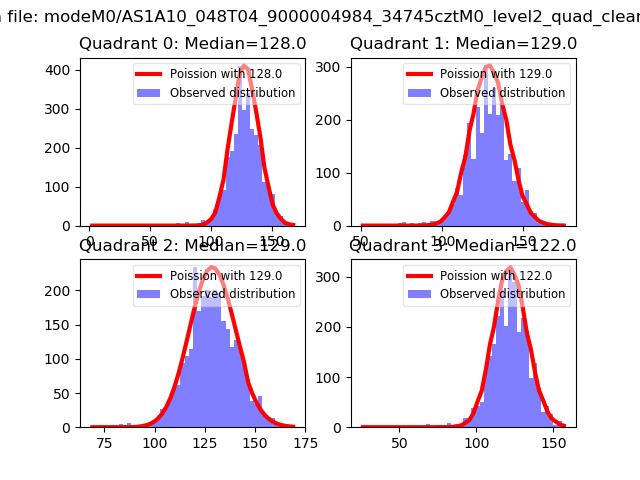 |
 |
| Quadrant-wise count rates Data is divided into 100 sec bins |
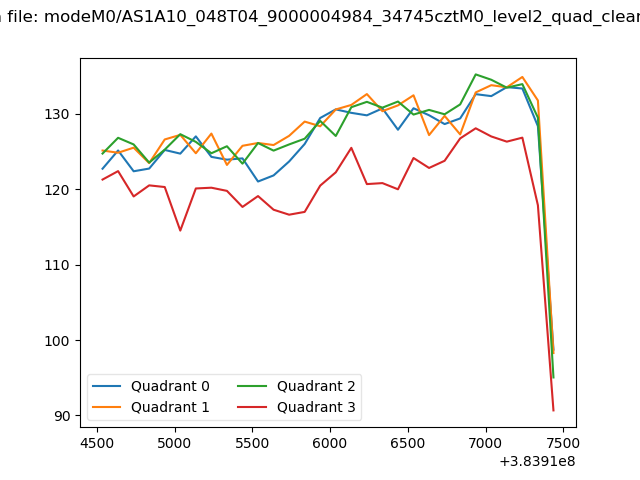 |
|
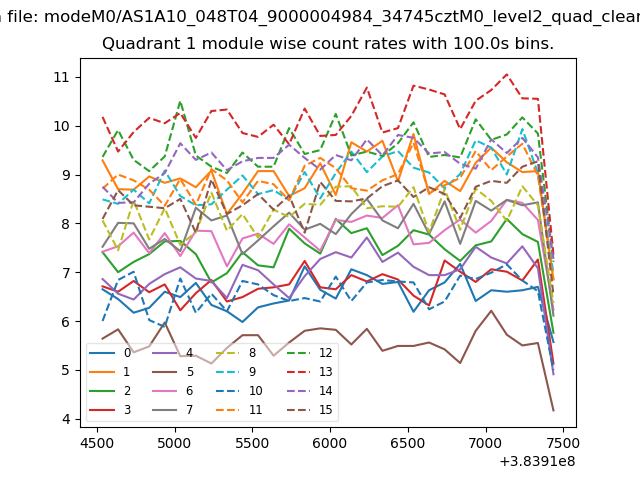
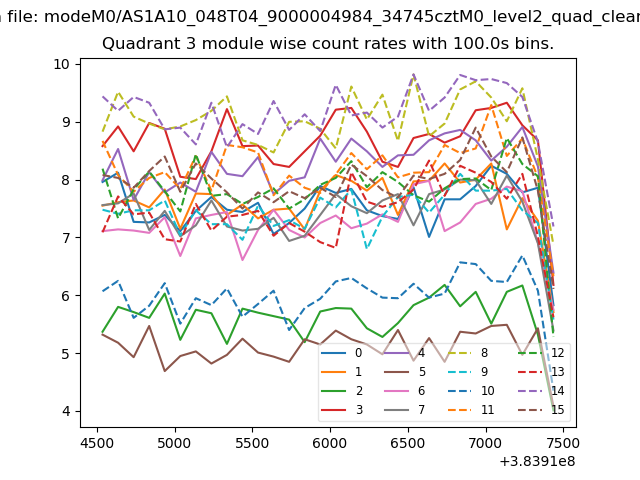
| Module-wise count rates for Quadrant A Data is divided into 100 sec bins |
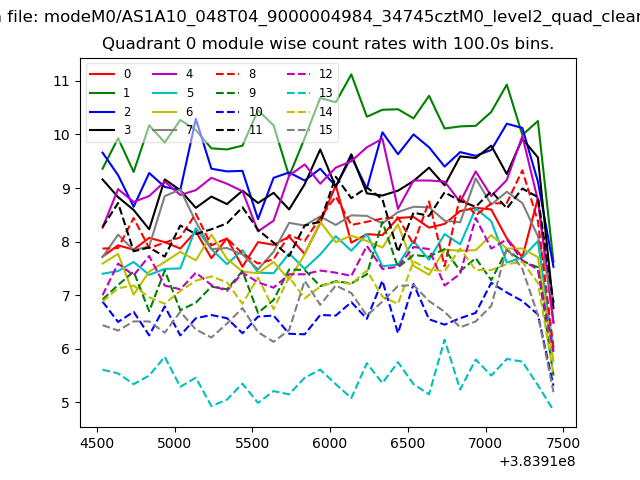 |
 |
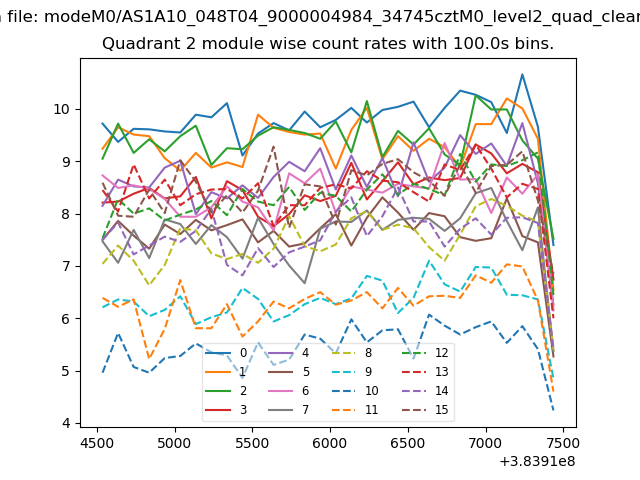
| Module-wise count rates for Quadrant B Data is divided into 100 sec bins |
 |
 |
| Module-wise count rates for Quadrant C Data is divided into 100 sec bins |
 |
 |
| Module-wise count rates for Quadrant D Data is divided into 100 sec bins |
 |
 |
| Parameter | Plot |
|---|---|
| CZT HV Monitor | 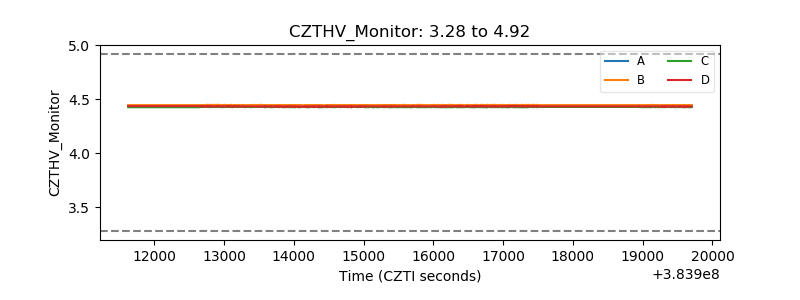 |
| D_VDD | 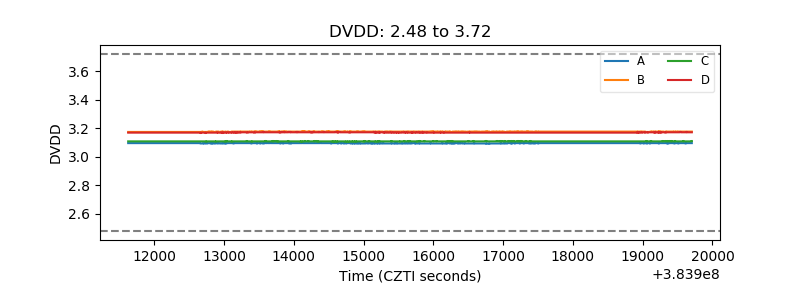 |
| Temperature 1 | 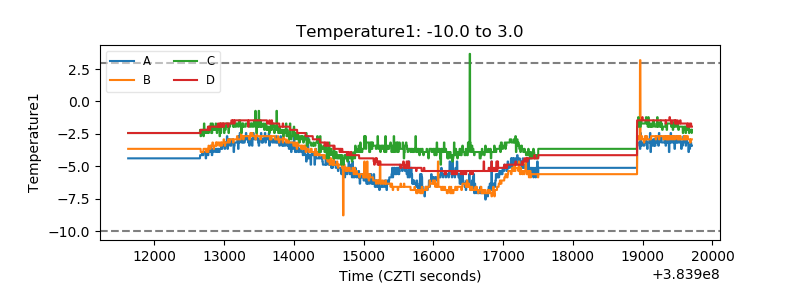 |
| Veto HV Monitor | 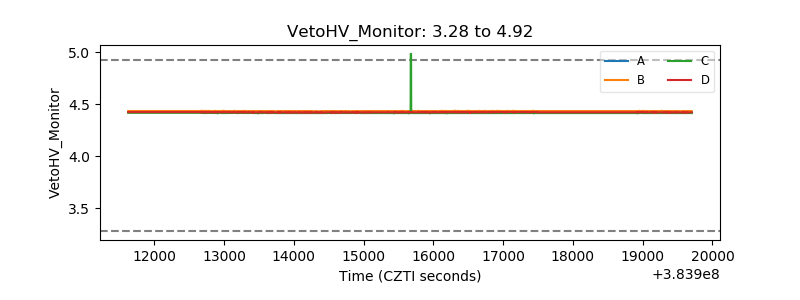 |
| Veto LLD | 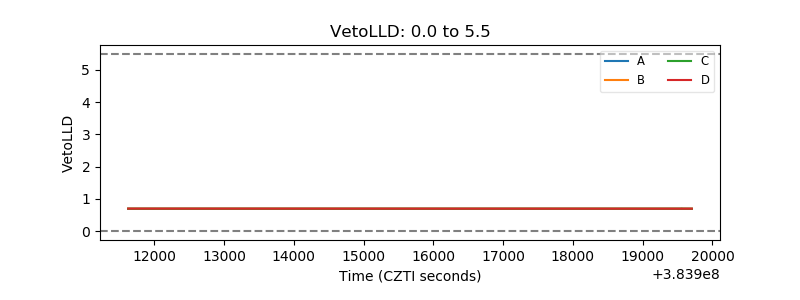 |
| Alpha Counter | 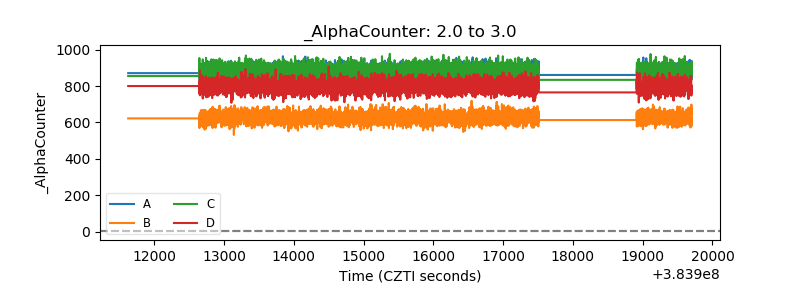 |
| _CPM_Rate | 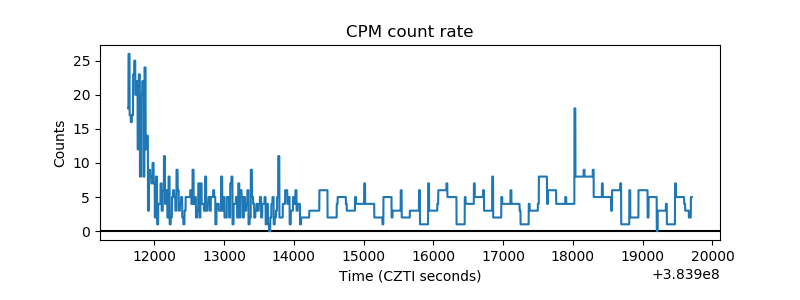 |
| CZT Counter | 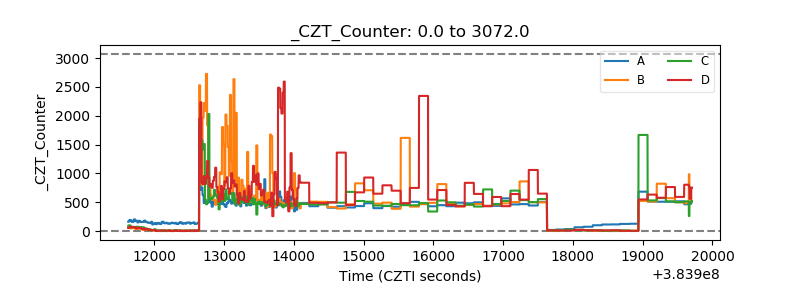 |
| +2.5 Volts monitor | 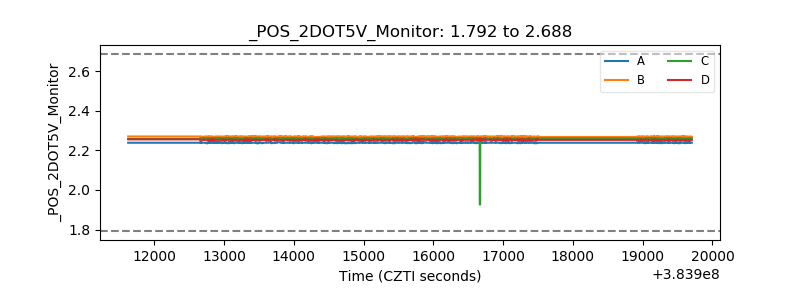 |
| +5 Volts monitor | 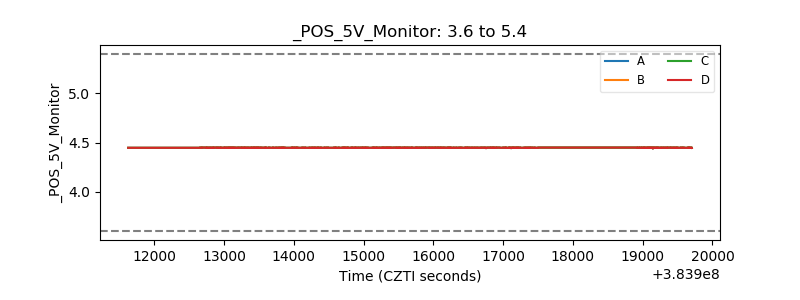 |
| _ROLL_ROT | 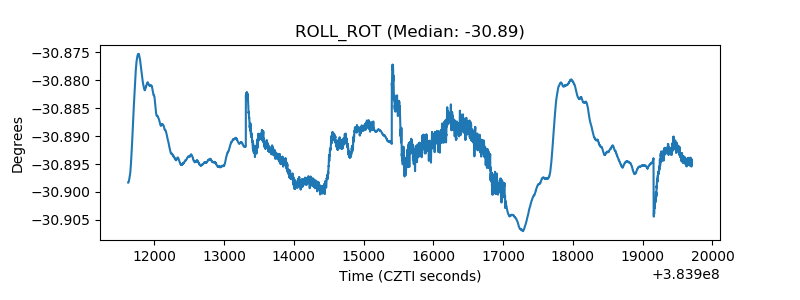 |
| _Roll_DEC | 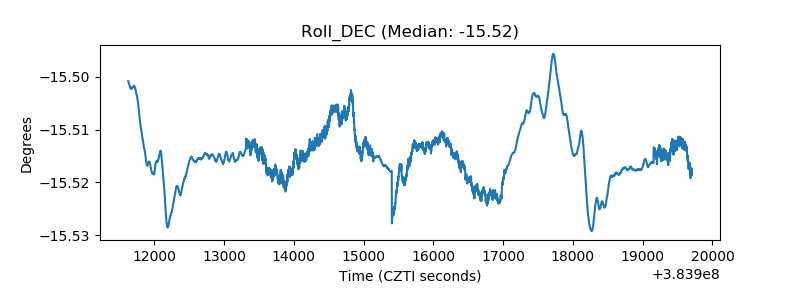 |
| _Roll_RA | 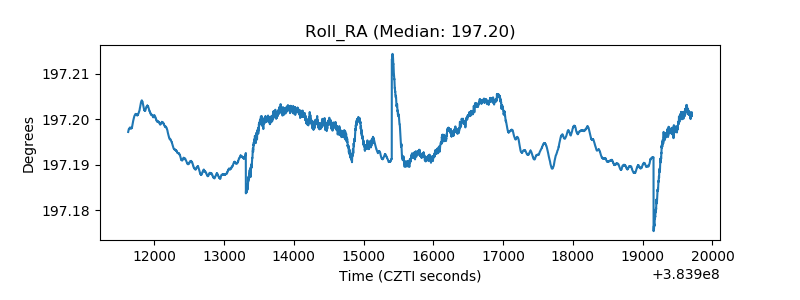 |
| Veto Counter | 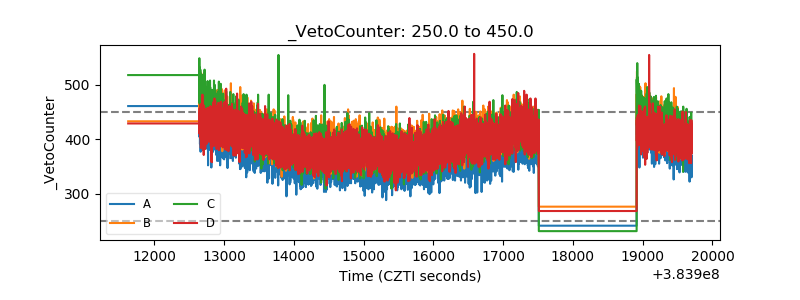 |