| Param | Original file | Final file |
|---|---|---|
| Filename | modeM0/AS1A10_048T04_9000004984_34741cztM0_level2.evt | modeM0/AS1A10_048T04_9000004984_34741cztM0_level2_quad_clean.evt |
| Size (bytes) | 490,443,840 | 66,142,080 |
| Size | 467.7 MB | 63.1 MB |
| Events in quadrant A | 3,164,585 | 416,602 |
| Events in quadrant B | 4,570,843 | 424,268 |
| Events in quadrant C | 2,887,046 | 421,346 |
| Events in quadrant D | 3,896,064 | 394,095 |
| Mode SS | |||
|---|---|---|---|
| Quadrant | BADHDUFLAG | Total packets | Discarded packets |
| A | 0 | 100 | 0 |
| B | 0 | 100 | 0 |
| C | 0 | 100 | 0 |
| D | 0 | 100 | 0 |
| Mode M0 | |||
|---|---|---|---|
| Quadrant | BADHDUFLAG | Total packets | Discarded packets |
| A | 0 | 12614 | 3 |
| B | 0 | 16748 | 2 |
| C | 0 | 11309 | 2 |
| D | 0 | 15060 | 2 |
| Mode M9 | |||
|---|---|---|---|
| Quadrant | BADHDUFLAG | Total packets | Discarded packets |
| A | 0 | 31 | 0 |
| B | 0 | 31 | 0 |
| C | 0 | 31 | 0 |
| D | 0 | 32 | 0 |
| Quadrant | Total seconds | Saturated seconds | Saturation percentage |
|---|---|---|---|
| A | 4942 | 33 | 0.667746% |
| B | 4942 | 766 | 15.499798% |
| C | 4942 | 47 | 0.951032% |
| D | 4942 | 92 | 1.861594% |
Noise dominated data is calculated using 1-second bins in cleaned event files. If a bin has >2000 counts, and if more than 50% of those come from <1% of pixels, then it is considered to be noise-dominated and hence unusable.
| Quadrant | # 1 sec bins | Bins with >0 counts | Bins with >2000 counts | High rate bins dominated by noise | Noise dominated (total time) | Noise dominated (detector-on time) | Marked lightcurve |
|---|---|---|---|---|---|---|---|
| A | 7064 | 4943 | 33 | 33 | 0.47% | 0.67% | 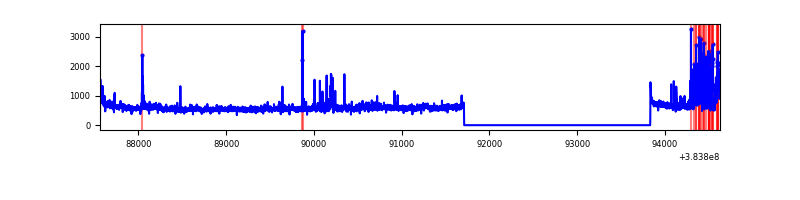 |
| B | 7064 | 4943 | 552 | 552 | 7.81% | 11.17% |  |
| C | 7064 | 4943 | 32 | 32 | 0.45% | 0.65% | 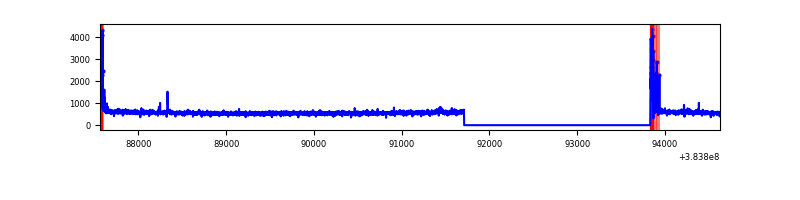 |
| D | 7064 | 4943 | 69 | 69 | 0.98% | 1.40% | 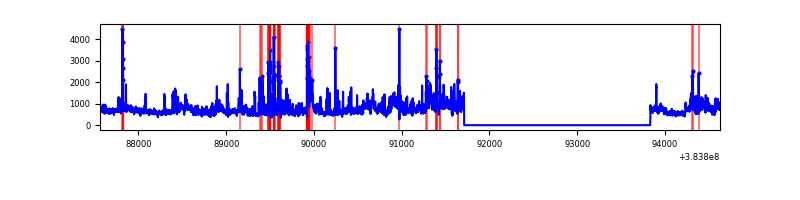 |
Top three noisy pixels from each quadrant. If the there are fewer than three noisy pixels in the level2.evt file, extra rows are filled as -1
| Pixel properties | Quadrant properties | ||||||
|---|---|---|---|---|---|---|---|
| Quadrant | DetID | PixID | Counts | Sigma | Mean | Median | Sigma |
| A | 15 | 169 | 391729 | 3037.13 | 649 | 639 | 128.8 |
| A | 15 | 223 | 158117 | 1222.94 | 649 | 639 | 128.8 |
| A | 10 | 83 | 47407 | 363.19 | 649 | 639 | 128.8 |
| B | 4 | 171 | 1659623 | 14429.29 | 611 | 597 | 115.0 |
| B | 5 | 172 | 171097 | 1482.91 | 611 | 597 | 115.0 |
| B | 0 | 190 | 165645 | 1435.5 | 611 | 597 | 115.0 |
| C | 15 | 214 | 210201 | 1415.72 | 639 | 646 | 148.0 |
| C | 0 | 10 | 139484 | 937.97 | 639 | 646 | 148.0 |
| C | 14 | 67 | 21529 | 141.08 | 639 | 646 | 148.0 |
| D | 8 | 195 | 766906 | 4954.45 | 636 | 620 | 154.7 |
| D | 1 | 52 | 222014 | 1431.43 | 636 | 620 | 154.7 |
| D | 2 | 249 | 143509 | 923.85 | 636 | 620 | 154.7 |
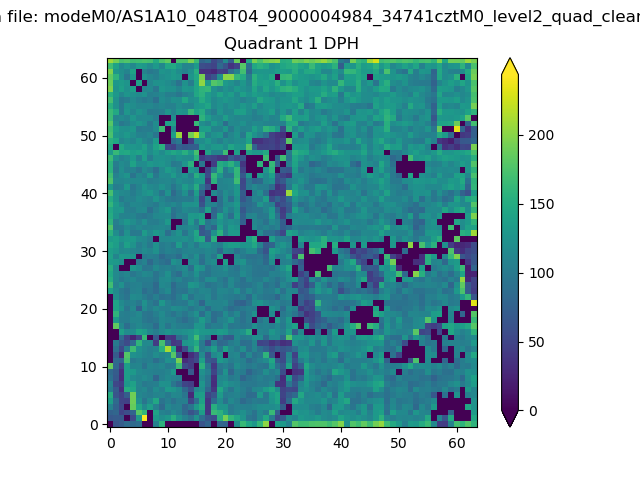
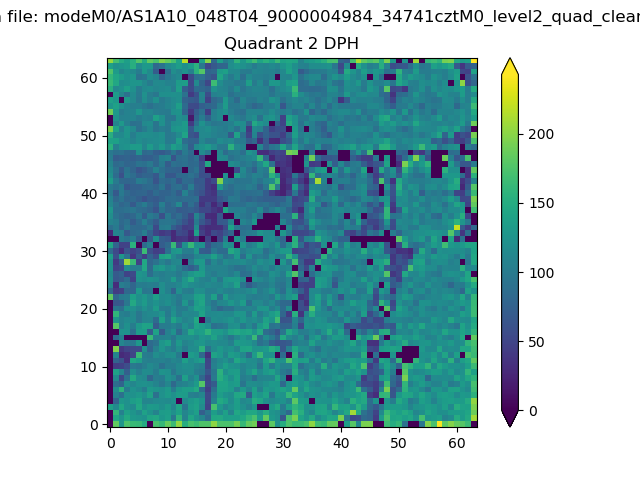
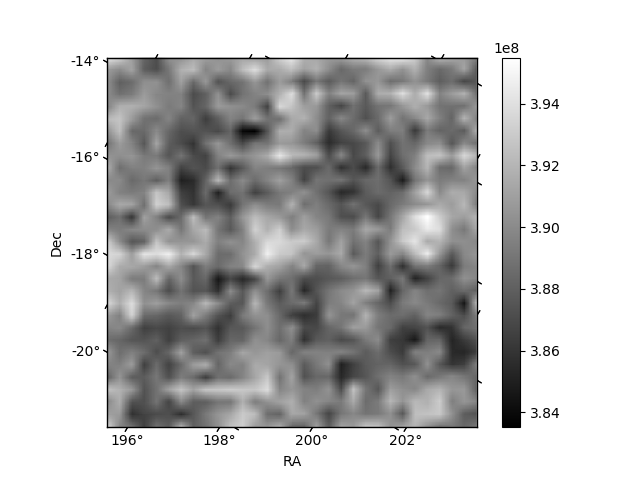
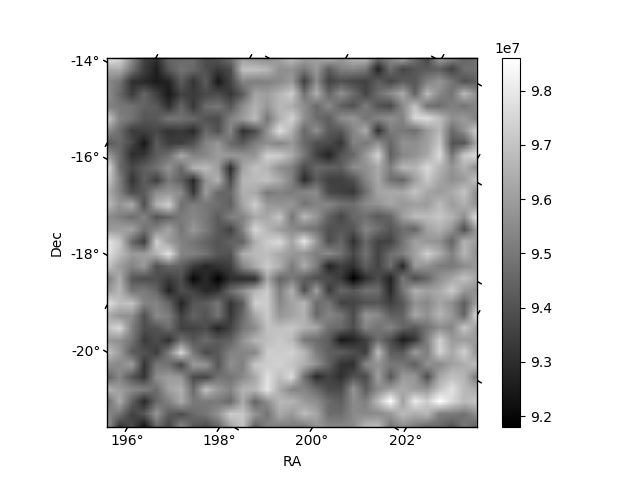
Histogram calculated using DETX and DETY for each event in the final _common_clean file
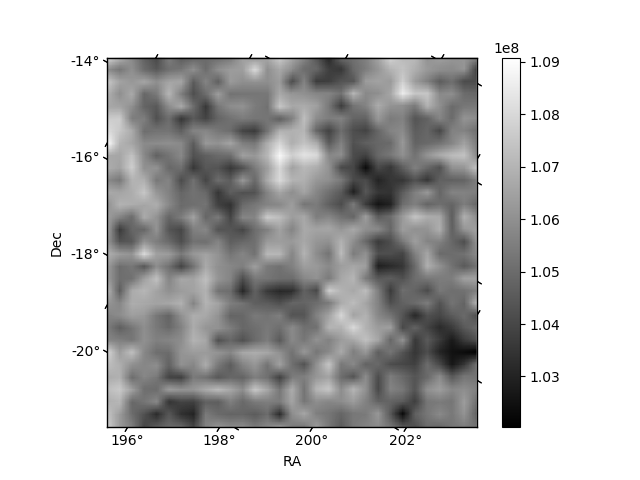
| Quadrant A | 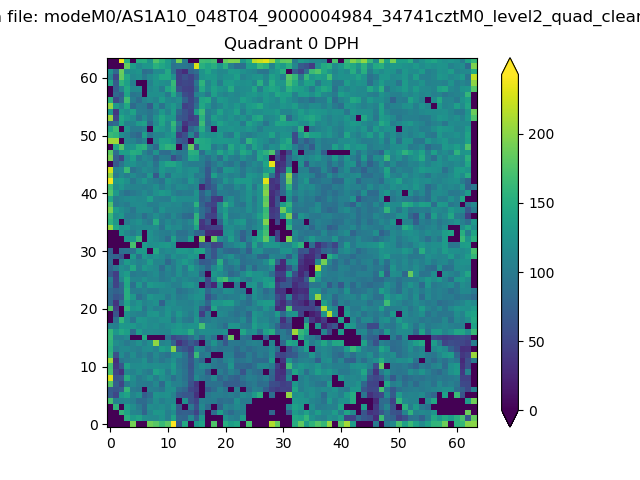 |
 |
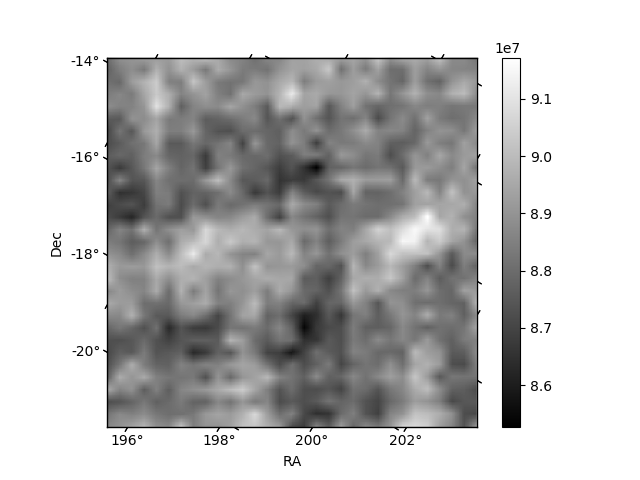
Quadrant B |
|---|---|---|---|
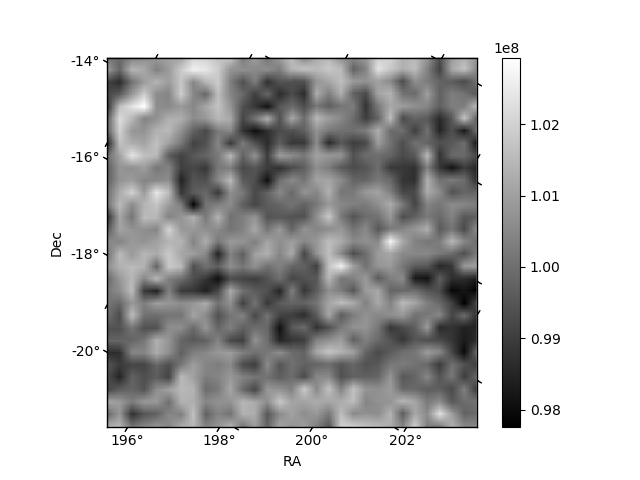
| Quadrant D | 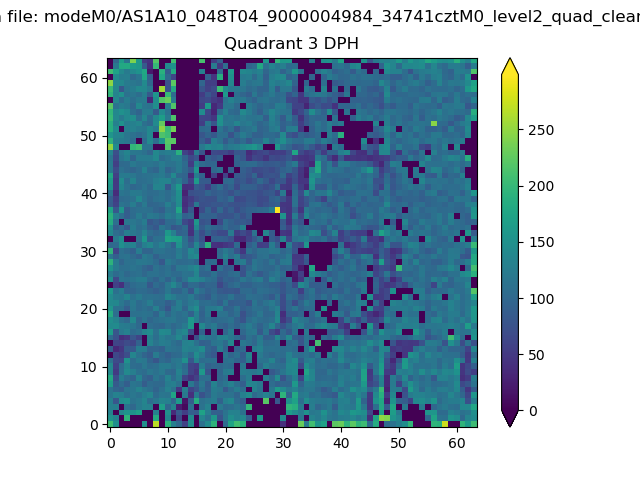 |
 |
Quadrant C |
| Plot type | Count rate plots | Images |
|---|---|---|
| Comparison with Poisson distribution Blue bars denote a histogram of data divided into 1 sec bins. Red curve is a Poisson curve with rate = median count rate of data. |
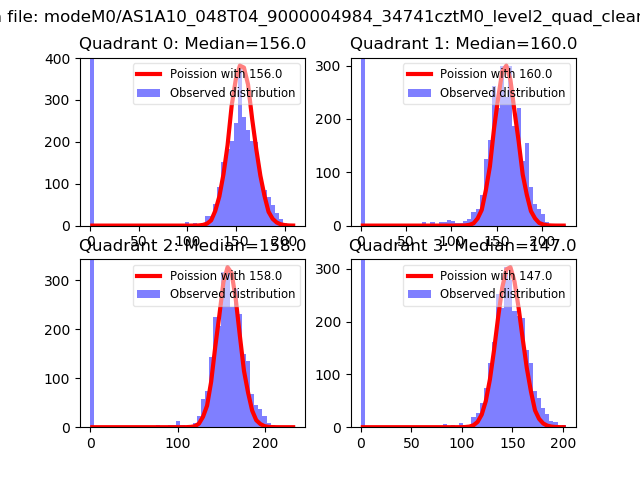 |
 |
| Quadrant-wise count rates Data is divided into 100 sec bins |
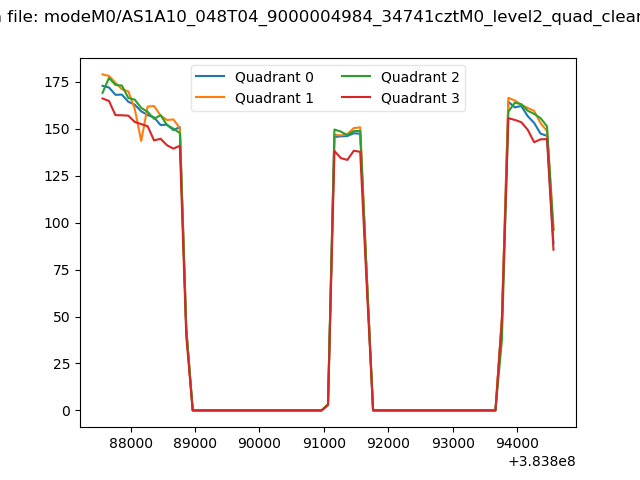 |
|
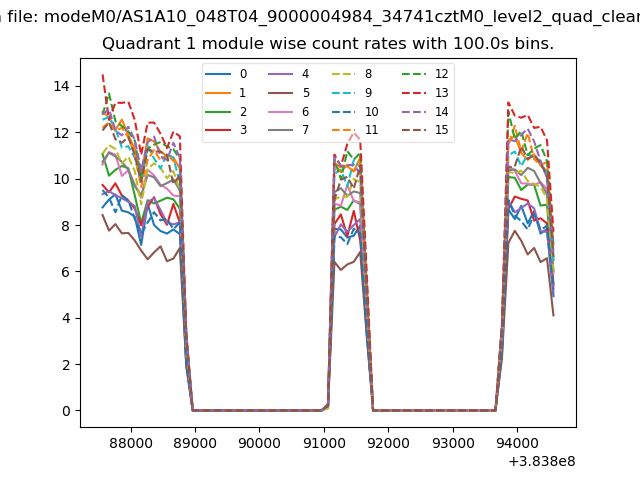
| Module-wise count rates for Quadrant A Data is divided into 100 sec bins |
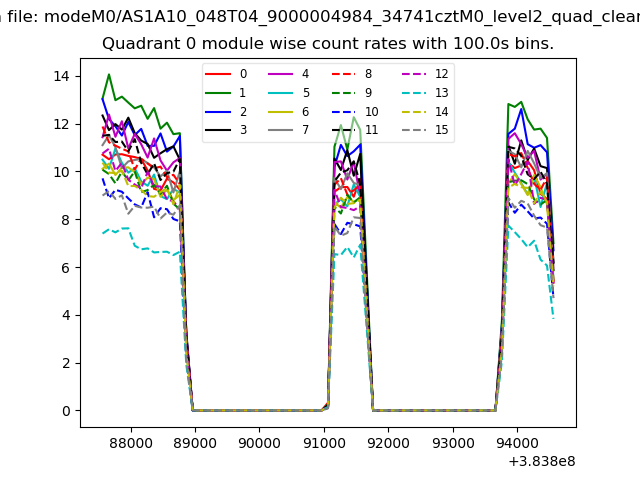 |
 |
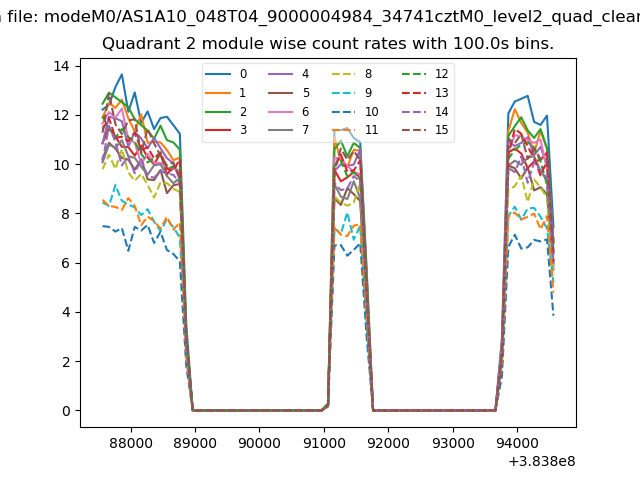
| Module-wise count rates for Quadrant B Data is divided into 100 sec bins |
 |
 |
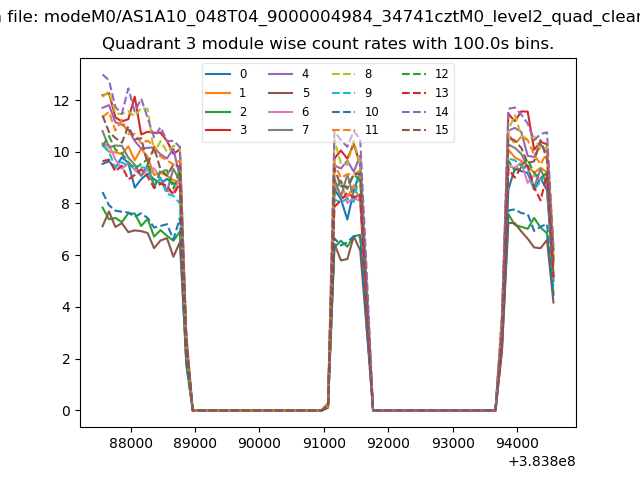
| Module-wise count rates for Quadrant C Data is divided into 100 sec bins |
 |
 |
| Module-wise count rates for Quadrant D Data is divided into 100 sec bins |
 |
 |
| Parameter | Plot |
|---|---|
| CZT HV Monitor | 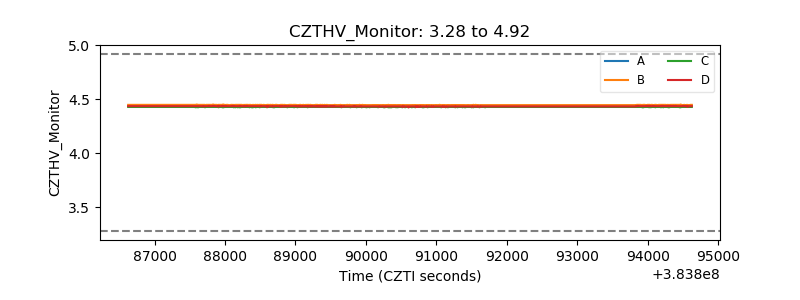 |
| D_VDD | 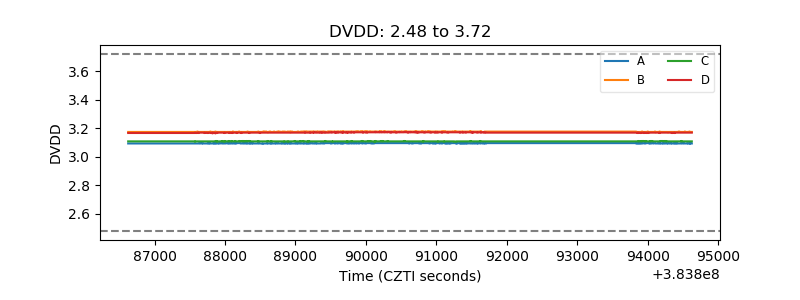 |
| Temperature 1 | 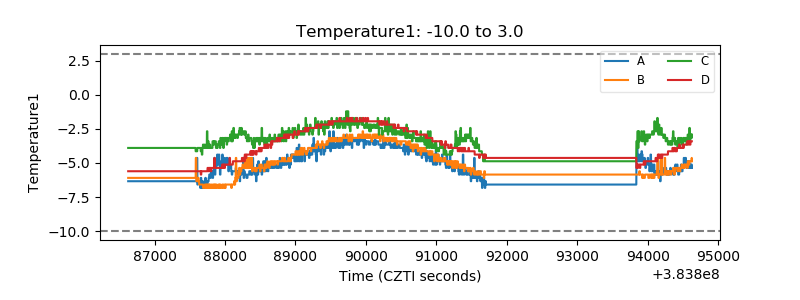 |
| Veto HV Monitor | 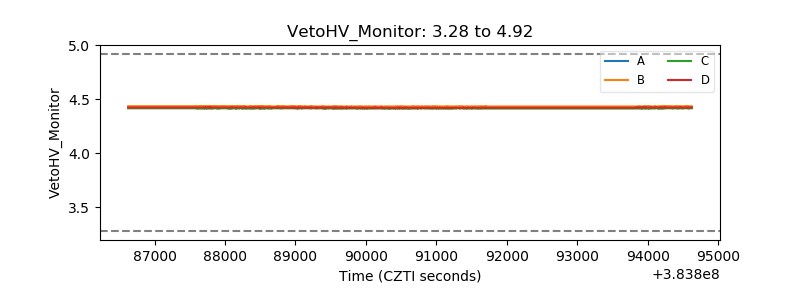 |
| Veto LLD | 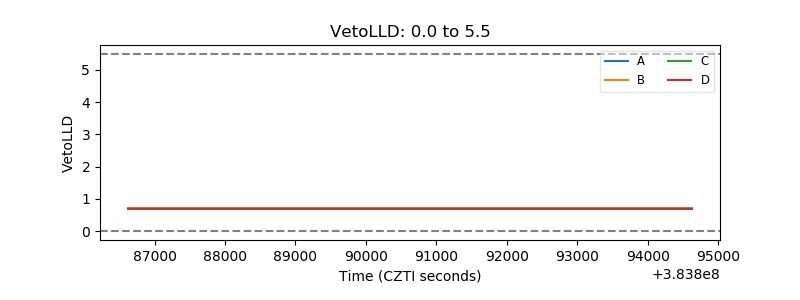 |
| Alpha Counter | 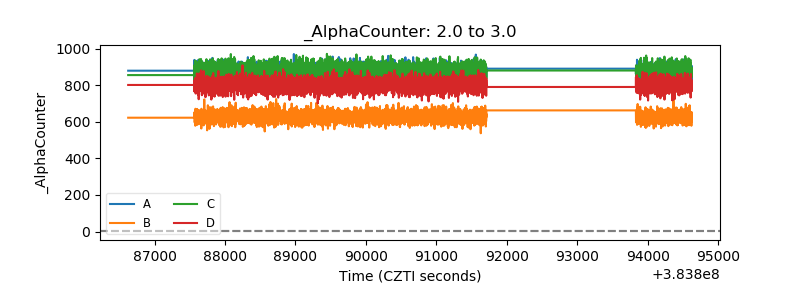 |
| _CPM_Rate | 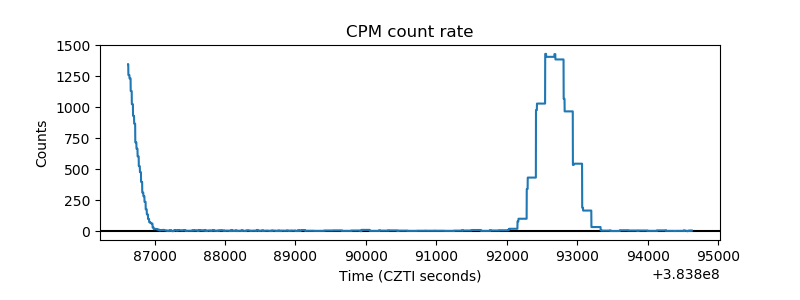 |
| CZT Counter | 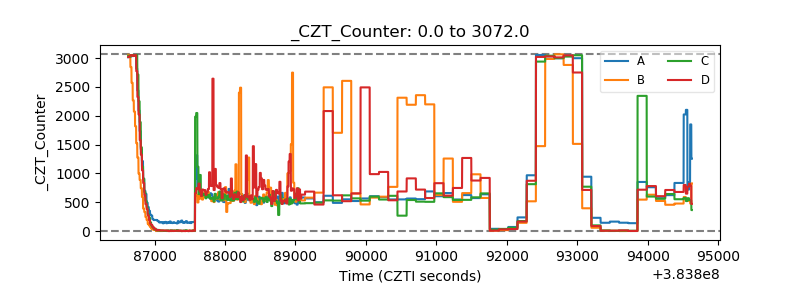 |
| +2.5 Volts monitor | 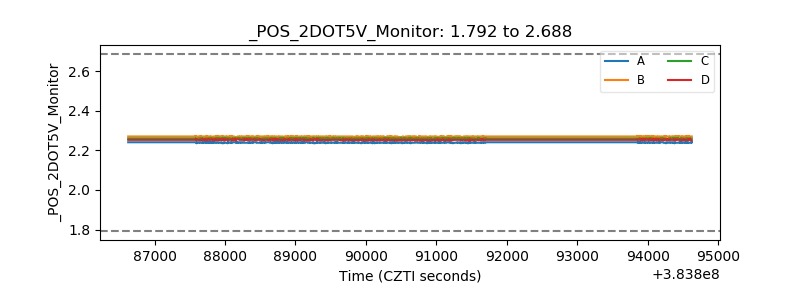 |
| +5 Volts monitor | 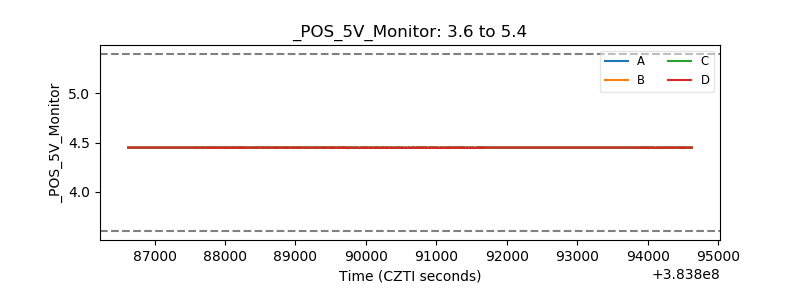 |
| _ROLL_ROT | 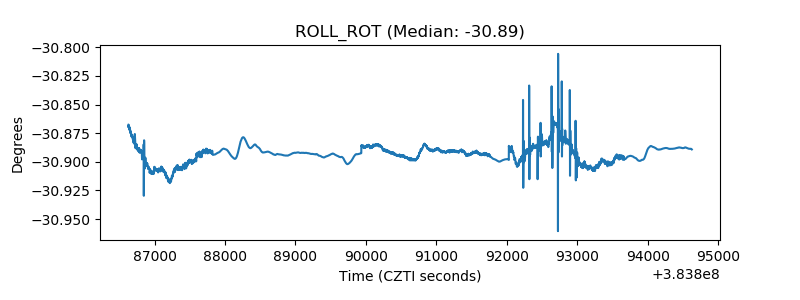 |
| _Roll_DEC | 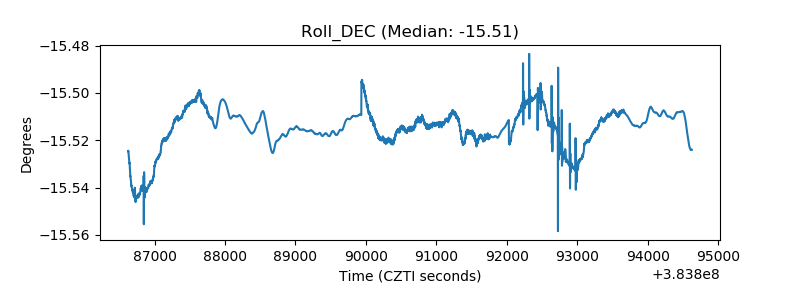 |
| _Roll_RA | 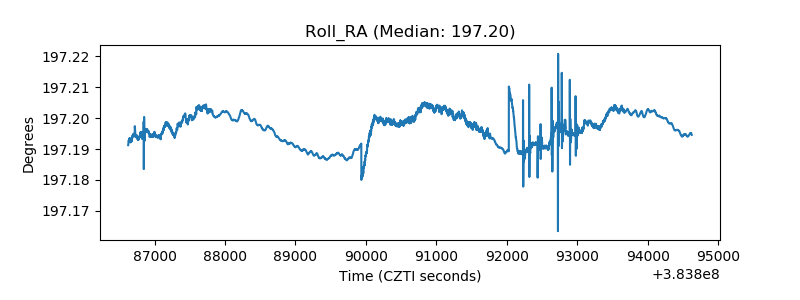 |
| Veto Counter | 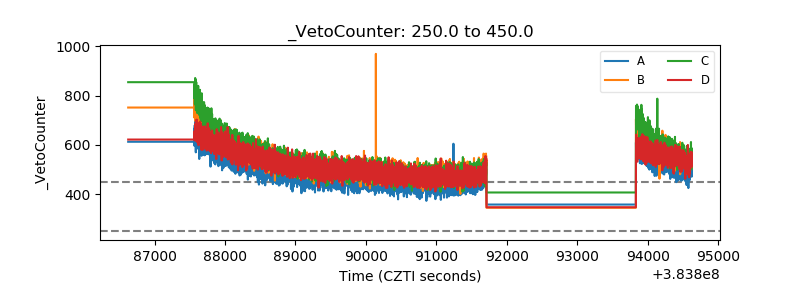 |