| Param | Original file | Final file |
|---|---|---|
| Filename | modeM0/AS1A10_048T04_9000004984_34738cztM0_level2.evt | modeM0/AS1A10_048T04_9000004984_34738cztM0_level2_quad_clean.evt |
| Size (bytes) | 533,410,560 | 76,452,480 |
| Size | 508.7 MB | 72.9 MB |
| Events in quadrant A | 2,810,256 | 490,365 |
| Events in quadrant B | 2,925,339 | 504,269 |
| Events in quadrant C | 3,212,081 | 486,160 |
| Events in quadrant D | 6,836,429 | 451,751 |
| Mode SS | |||
|---|---|---|---|
| Quadrant | BADHDUFLAG | Total packets | Discarded packets |
| A | 0 | 110 | 0 |
| B | 0 | 110 | 0 |
| C | 0 | 110 | 0 |
| D | 0 | 110 | 0 |
| Mode M0 | |||
|---|---|---|---|
| Quadrant | BADHDUFLAG | Total packets | Discarded packets |
| A | 0 | 11912 | 2 |
| B | 0 | 12023 | 1 |
| C | 0 | 12686 | 1 |
| D | 0 | 24079 | 1 |
| Mode M9 | |||
|---|---|---|---|
| Quadrant | BADHDUFLAG | Total packets | Discarded packets |
| A | 0 | 29 | 0 |
| B | 0 | 29 | 0 |
| C | 0 | 29 | 0 |
| D | 0 | 30 | 0 |
| Quadrant | Total seconds | Saturated seconds | Saturation percentage |
|---|---|---|---|
| A | 5468 | 16 | 0.292612% |
| B | 5468 | 45 | 0.822970% |
| C | 5468 | 89 | 1.627652% |
| D | 5468 | 1192 | 21.799561% |
Noise dominated data is calculated using 1-second bins in cleaned event files. If a bin has >2000 counts, and if more than 50% of those come from <1% of pixels, then it is considered to be noise-dominated and hence unusable.
| Quadrant | # 1 sec bins | Bins with >0 counts | Bins with >2000 counts | High rate bins dominated by noise | Noise dominated (total time) | Noise dominated (detector-on time) | Marked lightcurve |
|---|---|---|---|---|---|---|---|
| A | 7291 | 5469 | 6 | 6 | 0.08% | 0.11% | 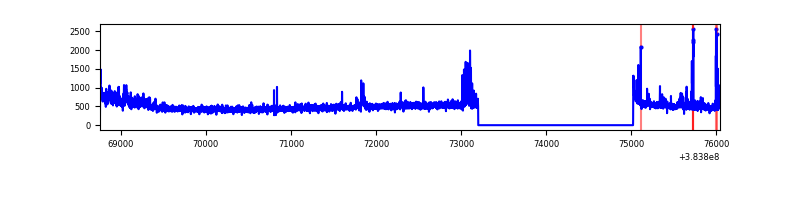 |
| B | 7291 | 5469 | 27 | 27 | 0.37% | 0.49% | 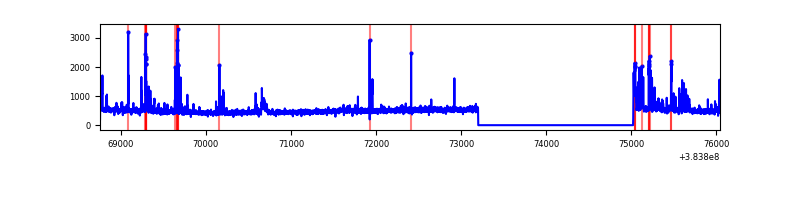 |
| C | 7291 | 5469 | 81 | 81 | 1.11% | 1.48% | 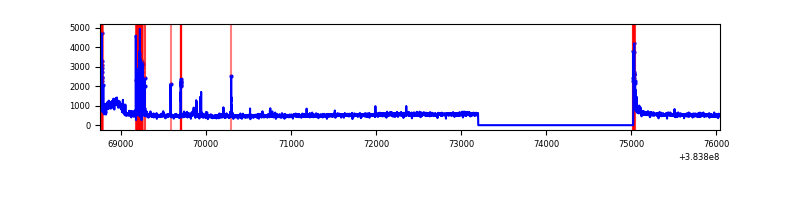 |
| D | 7291 | 5469 | 1129 | 1129 | 15.48% | 20.64% | 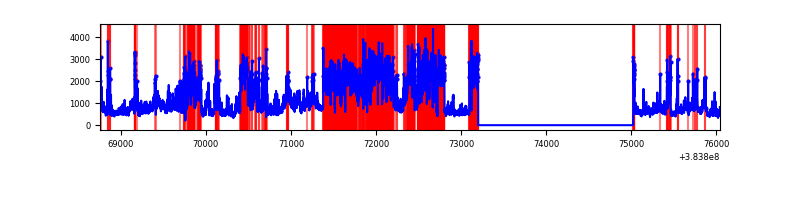 |
Top three noisy pixels from each quadrant. If the there are fewer than three noisy pixels in the level2.evt file, extra rows are filled as -1
| Pixel properties | Quadrant properties | ||||||
|---|---|---|---|---|---|---|---|
| Quadrant | DetID | PixID | Counts | Sigma | Mean | Median | Sigma |
| A | 15 | 169 | 93208 | 706.73 | 657 | 647 | 131.0 |
| A | 15 | 223 | 79210 | 599.85 | 657 | 647 | 131.0 |
| A | 10 | 83 | 48374 | 364.41 | 657 | 647 | 131.0 |
| B | 4 | 171 | 109426 | 858.58 | 657 | 639 | 126.7 |
| B | 5 | 172 | 83043 | 650.36 | 657 | 639 | 126.7 |
| B | 0 | 190 | 54284 | 423.38 | 657 | 639 | 126.7 |
| C | 0 | 207 | 341847 | 2273.53 | 642 | 647 | 150.1 |
| C | 15 | 214 | 231454 | 1537.95 | 642 | 647 | 150.1 |
| C | 0 | 10 | 87559 | 579.13 | 642 | 647 | 150.1 |
| D | 1 | 52 | 3229532 | 22817.97 | 587 | 574 | 141.5 |
| D | 8 | 195 | 627082 | 4427.32 | 587 | 574 | 141.5 |
| D | 10 | 118 | 230493 | 1624.76 | 587 | 574 | 141.5 |
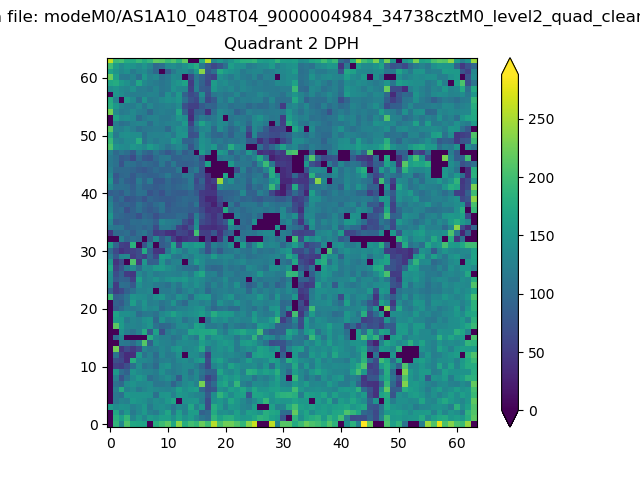
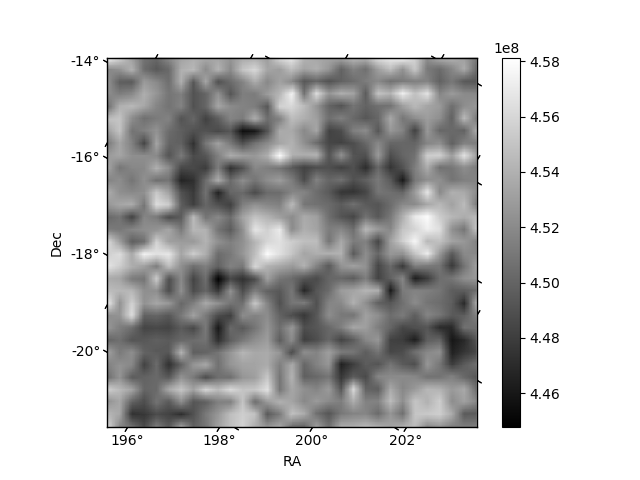
Histogram calculated using DETX and DETY for each event in the final _common_clean file
| Quadrant A | 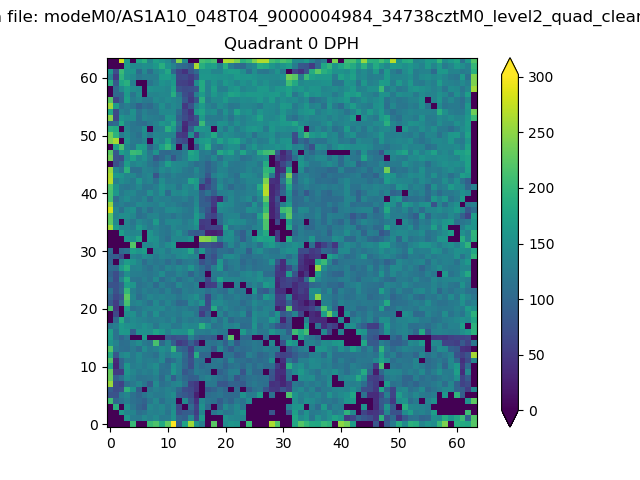 |
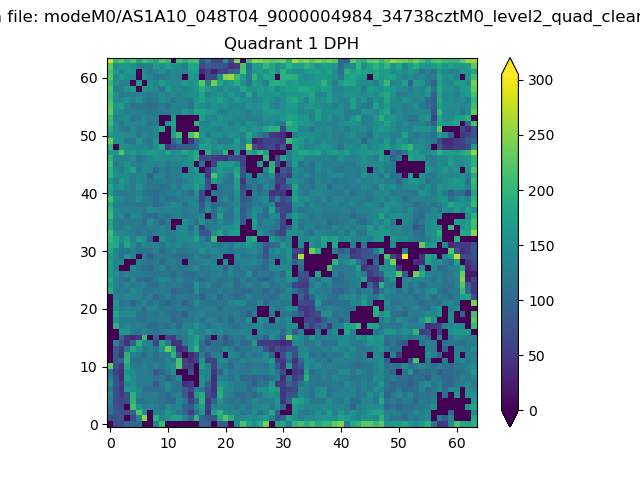 |
Quadrant B |
|---|---|---|---|
| Quadrant D | 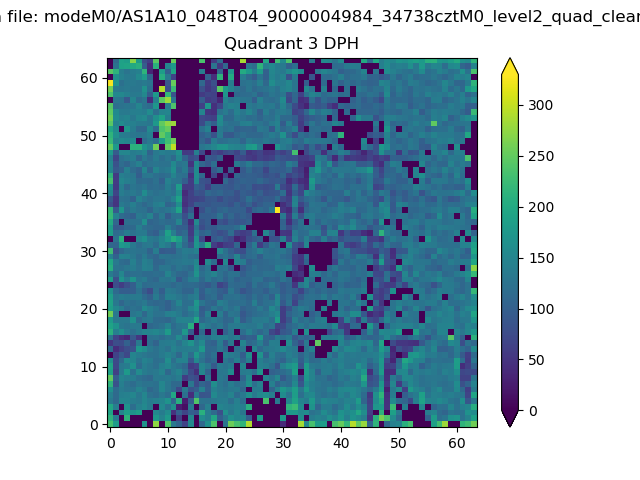 |
 |
Quadrant C |
| Plot type | Count rate plots | Images |
|---|---|---|
| Comparison with Poisson distribution Blue bars denote a histogram of data divided into 1 sec bins. Red curve is a Poisson curve with rate = median count rate of data. |
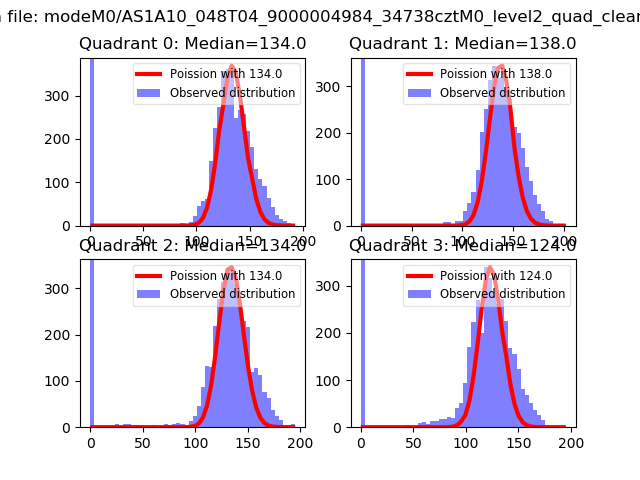 |
 |
| Quadrant-wise count rates Data is divided into 100 sec bins |
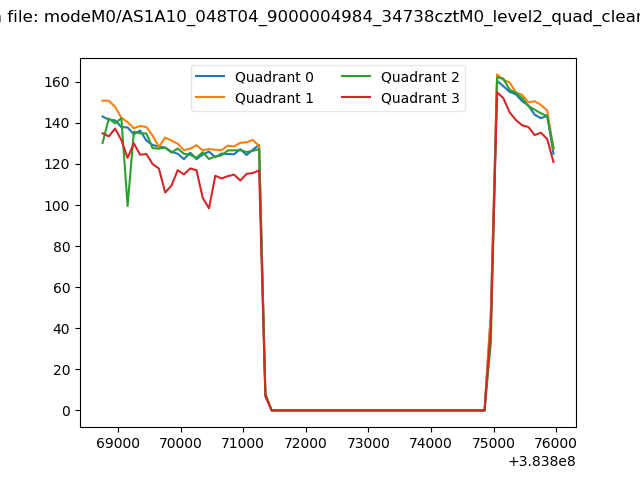 |
|
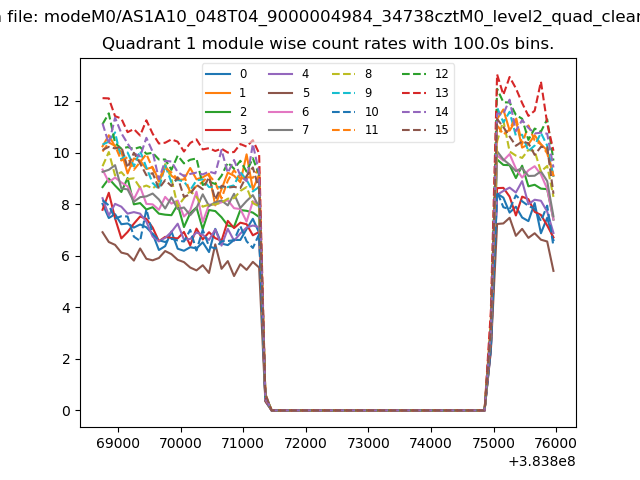
| Module-wise count rates for Quadrant A Data is divided into 100 sec bins |
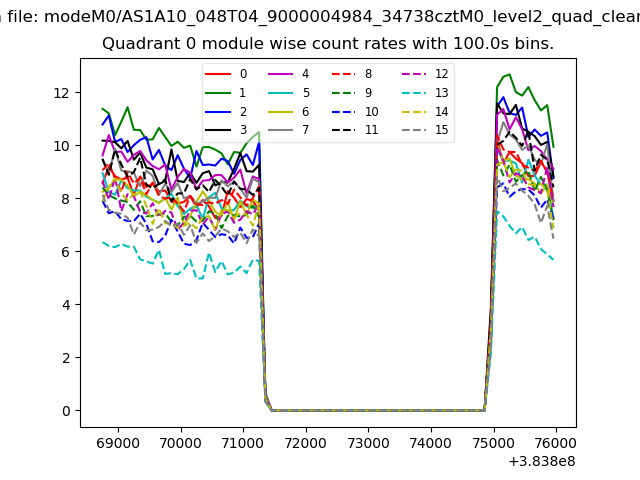 |
 |
| Module-wise count rates for Quadrant B Data is divided into 100 sec bins |
 |
 |
| Module-wise count rates for Quadrant C Data is divided into 100 sec bins |
 |
 |
| Module-wise count rates for Quadrant D Data is divided into 100 sec bins |
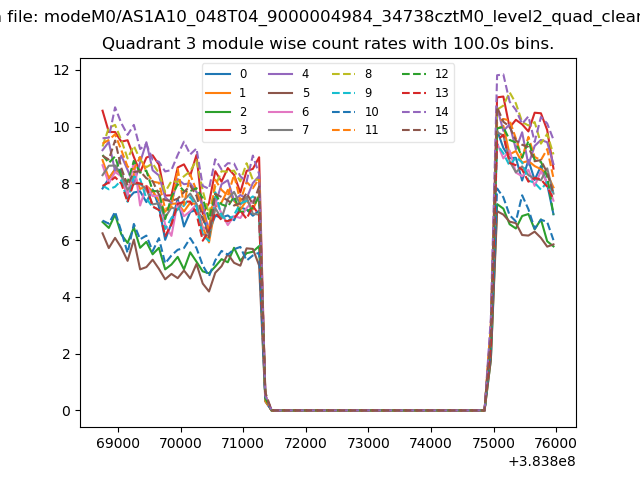 |
 |
| Parameter | Plot |
|---|---|
| CZT HV Monitor | 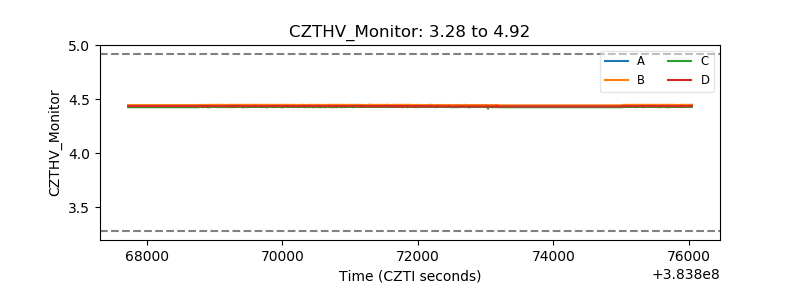 |
| D_VDD | 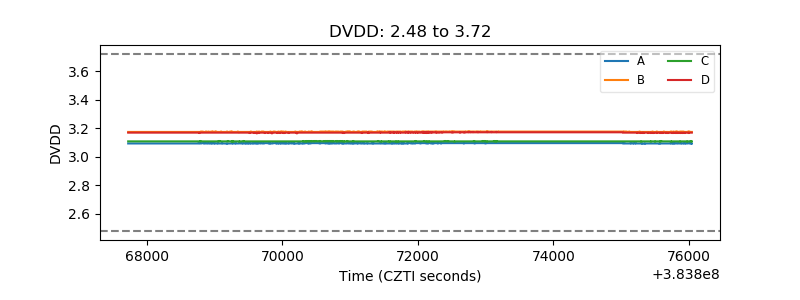 |
| Temperature 1 | 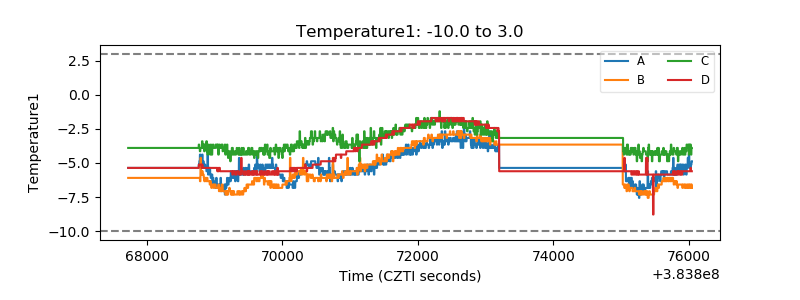 |
| Veto HV Monitor | 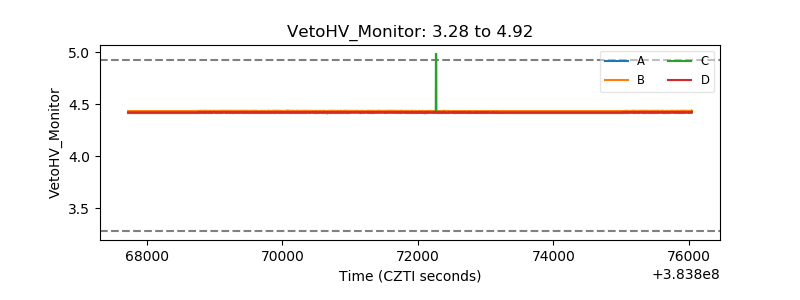 |
| Veto LLD | 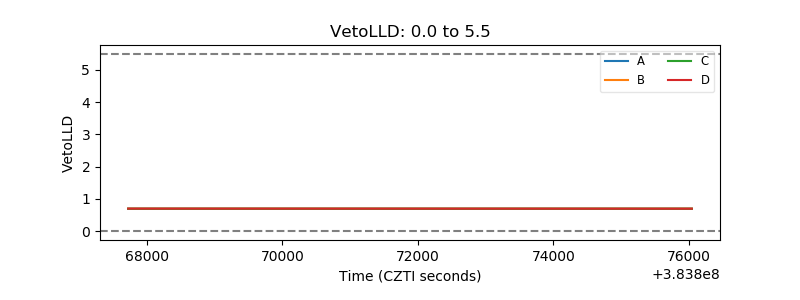 |
| Alpha Counter | 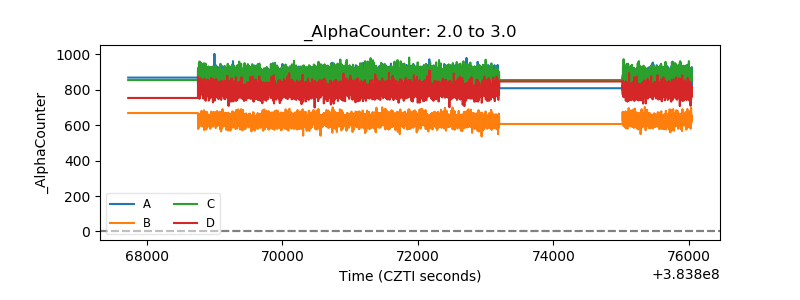 |
| _CPM_Rate | 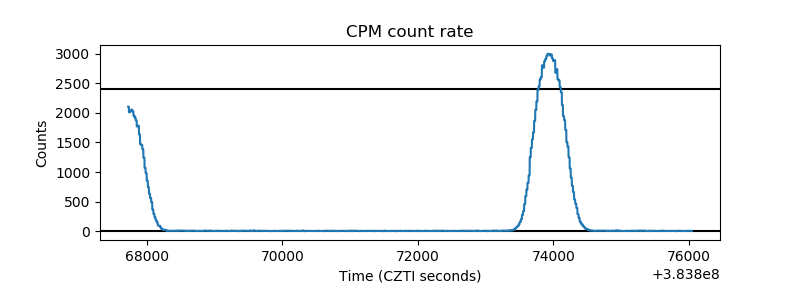 |
| CZT Counter | 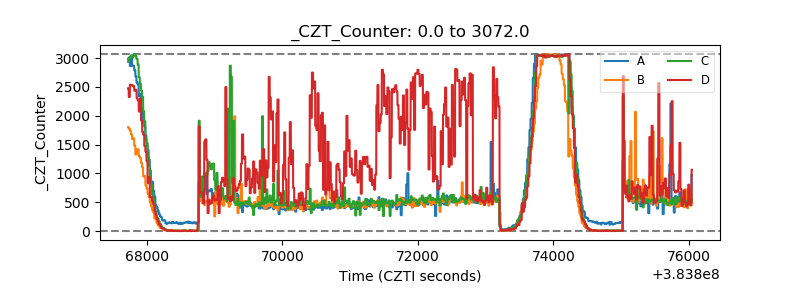 |
| +2.5 Volts monitor | 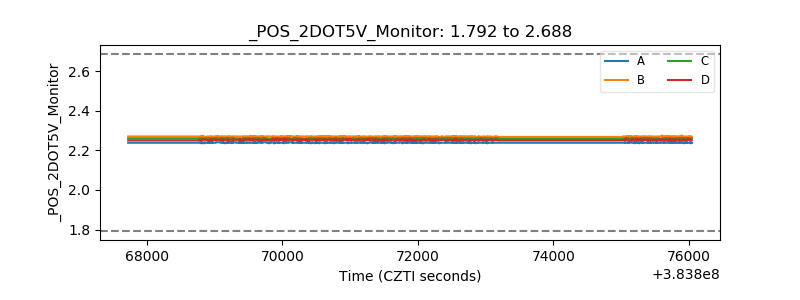 |
| +5 Volts monitor | 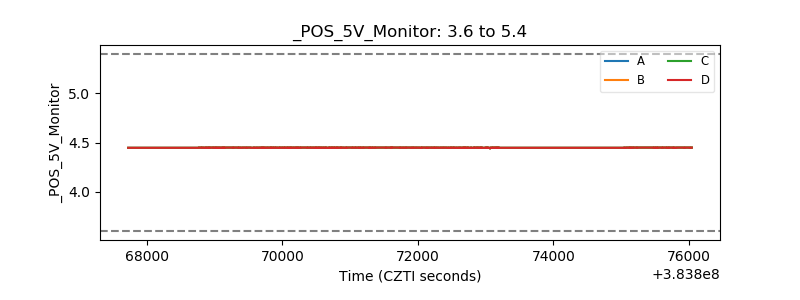 |
| _ROLL_ROT | 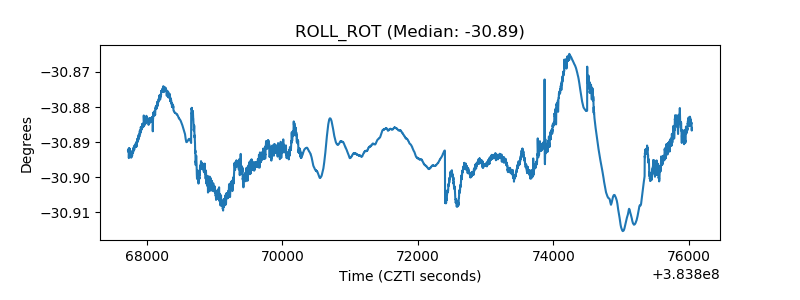 |
| _Roll_DEC | 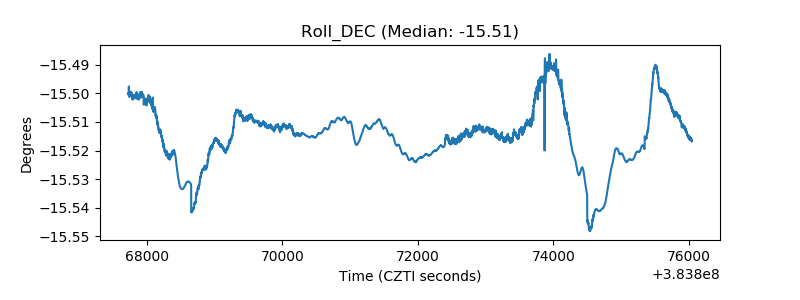 |
| _Roll_RA | 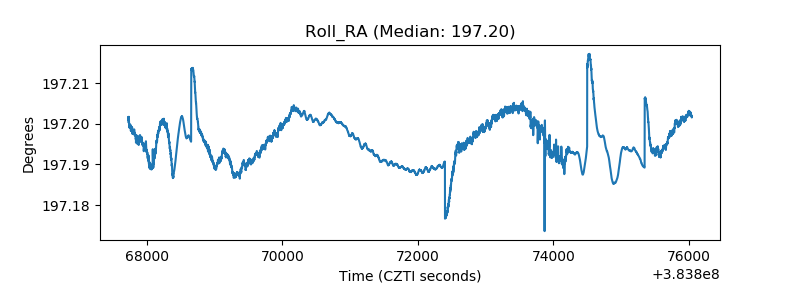 |
| Veto Counter |  |