| Param | Original file | Final file |
|---|---|---|
| Filename | modeM0/AS1C07_001T01_9000004982_34732cztM0_level2.evt | modeM0/AS1C07_001T01_9000004982_34732cztM0_level2_quad_clean.evt |
| Size (bytes) | 518,624,640 | 83,969,280 |
| Size | 494.6 MB | 80.1 MB |
| Events in quadrant A | 2,913,654 | 544,544 |
| Events in quadrant B | 2,948,154 | 546,109 |
| Events in quadrant C | 2,998,824 | 541,043 |
| Events in quadrant D | 6,444,260 | 496,912 |
| Mode M0 | |||
|---|---|---|---|
| Quadrant | BADHDUFLAG | Total packets | Discarded packets |
| A | 0 | 12631 | 3 |
| B | 0 | 12565 | 2 |
| C | 0 | 12413 | 2 |
| D | 0 | 23377 | 2 |
| Mode SS | |||
|---|---|---|---|
| Quadrant | BADHDUFLAG | Total packets | Discarded packets |
| A | 0 | 120 | 0 |
| B | 0 | 120 | 0 |
| C | 0 | 120 | 0 |
| D | 0 | 120 | 0 |
| Mode M9 | |||
|---|---|---|---|
| Quadrant | BADHDUFLAG | Total packets | Discarded packets |
| A | 0 | 20 | 0 |
| B | 0 | 20 | 0 |
| C | 0 | 20 | 0 |
| D | 0 | 21 | 0 |
| Quadrant | Total seconds | Saturated seconds | Saturation percentage |
|---|---|---|---|
| A | 5928 | 15 | 0.253036% |
| B | 5928 | 49 | 0.826586% |
| C | 5928 | 35 | 0.590418% |
| D | 5928 | 689 | 11.622807% |
Noise dominated data is calculated using 1-second bins in cleaned event files. If a bin has >2000 counts, and if more than 50% of those come from <1% of pixels, then it is considered to be noise-dominated and hence unusable.
| Quadrant | # 1 sec bins | Bins with >0 counts | Bins with >2000 counts | High rate bins dominated by noise | Noise dominated (total time) | Noise dominated (detector-on time) | Marked lightcurve |
|---|---|---|---|---|---|---|---|
| A | 7211 | 5929 | 3 | 3 | 0.04% | 0.05% | 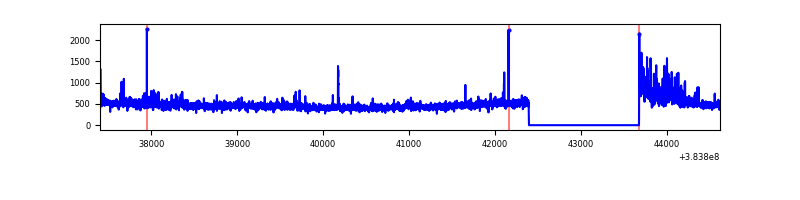 |
| B | 7211 | 5929 | 27 | 27 | 0.37% | 0.46% | 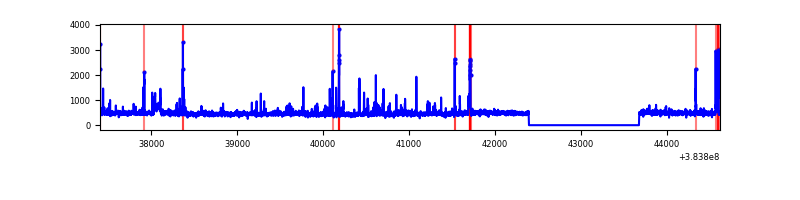 |
| C | 7211 | 5929 | 23 | 23 | 0.32% | 0.39% | 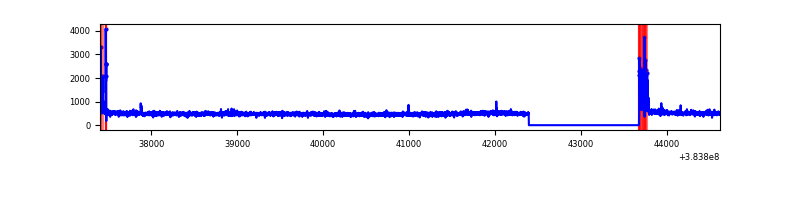 |
| D | 7211 | 5929 | 572 | 572 | 7.93% | 9.65% | 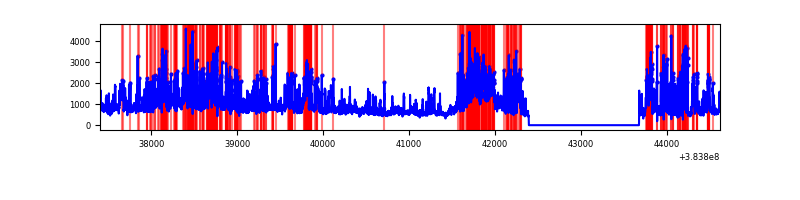 |
Top three noisy pixels from each quadrant. If the there are fewer than three noisy pixels in the level2.evt file, extra rows are filled as -1
| Pixel properties | Quadrant properties | ||||||
|---|---|---|---|---|---|---|---|
| Quadrant | DetID | PixID | Counts | Sigma | Mean | Median | Sigma |
| A | 15 | 169 | 138075 | 1009.43 | 679 | 665 | 136.1 |
| A | 10 | 83 | 51536 | 373.7 | 679 | 665 | 136.1 |
| A | 7 | 48 | 32976 | 237.36 | 679 | 665 | 136.1 |
| B | 5 | 172 | 139697 | 1075.67 | 674 | 655 | 129.3 |
| B | 15 | 85 | 40477 | 308.07 | 674 | 655 | 129.3 |
| B | 10 | 245 | 27627 | 208.66 | 674 | 655 | 129.3 |
| C | 15 | 214 | 253745 | 1641.9 | 658 | 662 | 154.1 |
| C | 0 | 10 | 142081 | 917.47 | 658 | 662 | 154.1 |
| C | 14 | 67 | 23467 | 147.95 | 658 | 662 | 154.1 |
| D | 8 | 195 | 1189227 | 7001.78 | 634 | 620 | 169.8 |
| D | 1 | 20 | 705111 | 4149.98 | 634 | 620 | 169.8 |
| D | 2 | 250 | 676835 | 3983.41 | 634 | 620 | 169.8 |
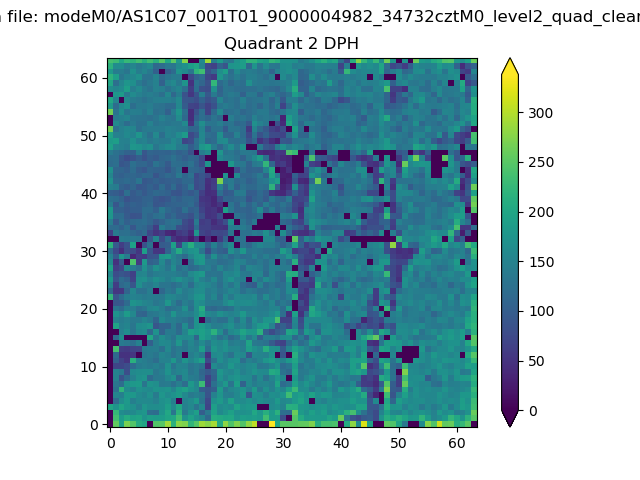
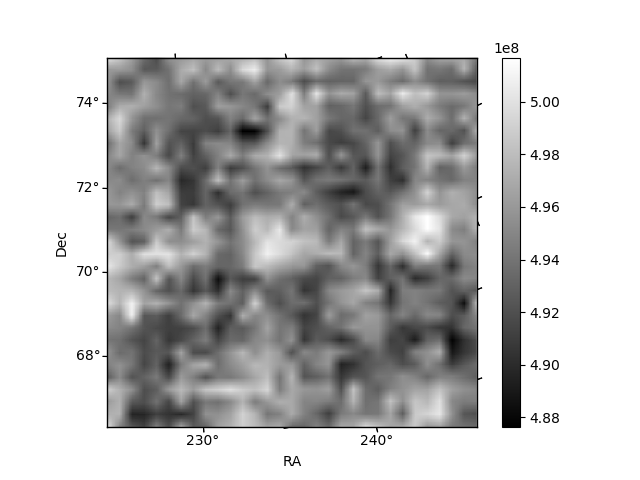
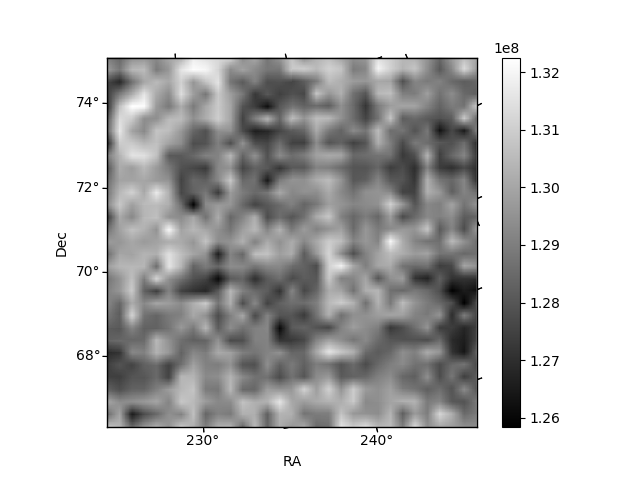
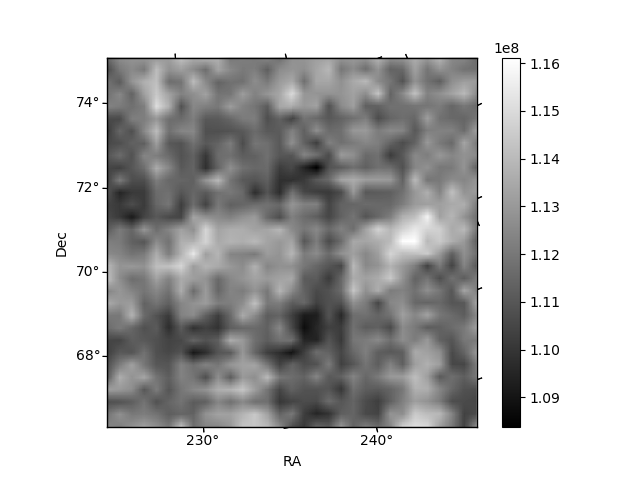
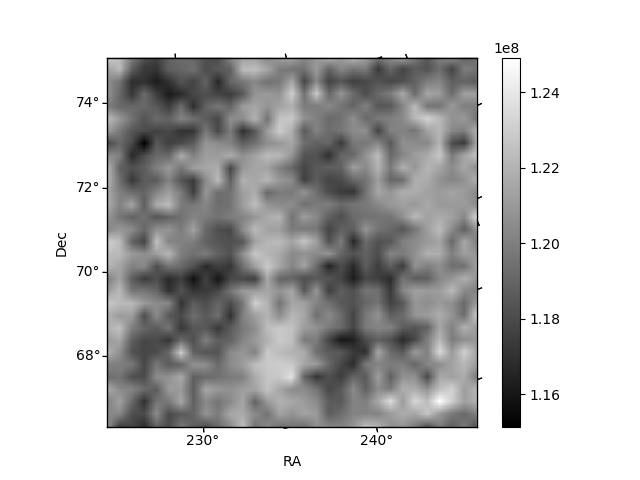
Histogram calculated using DETX and DETY for each event in the final _common_clean file
| Quadrant A | 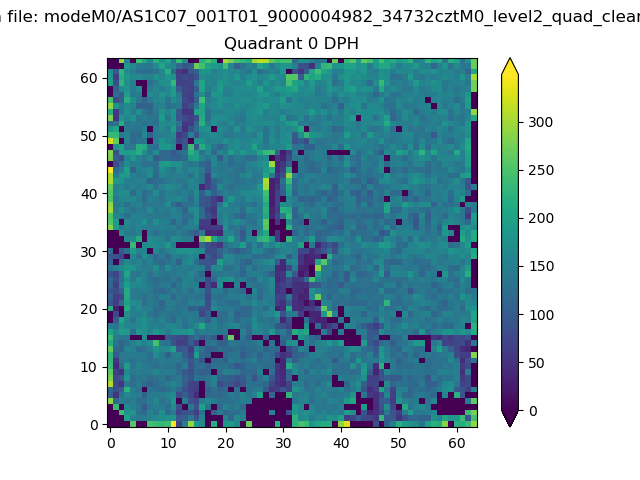 |
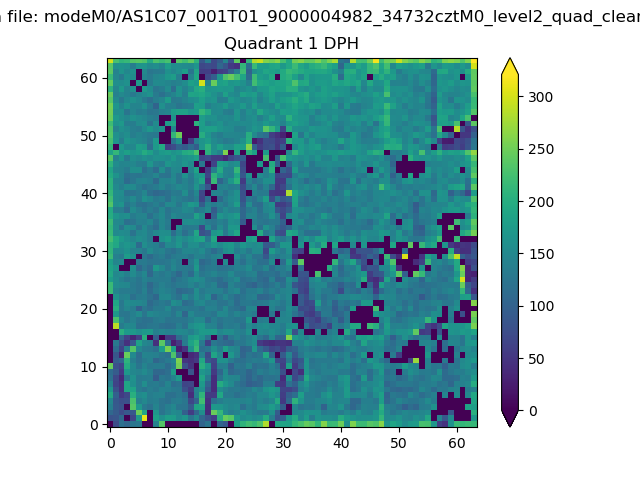 |
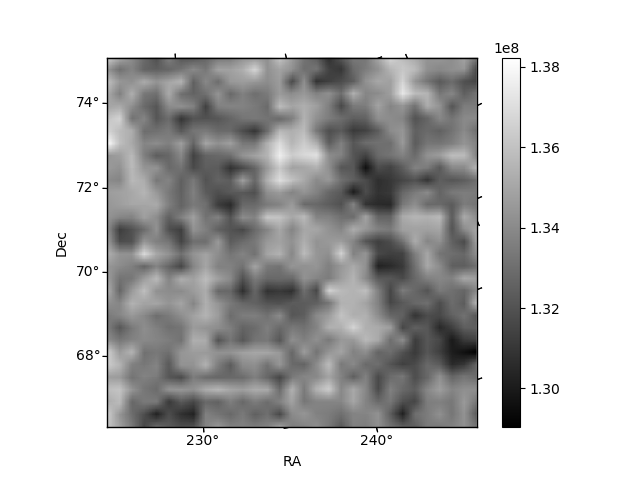
Quadrant B |
|---|---|---|---|
| Quadrant D | 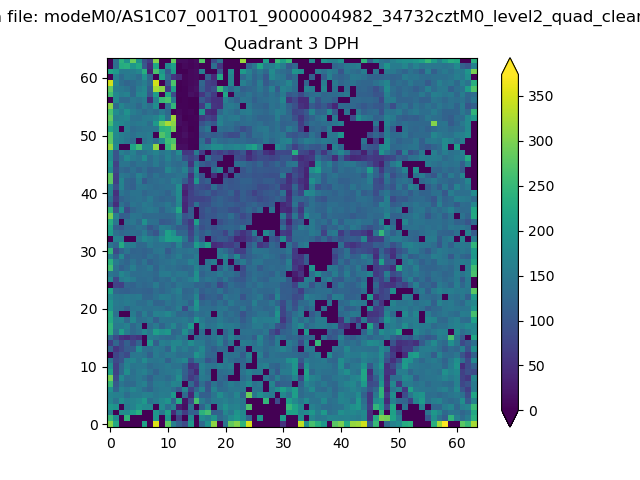 |
 |
Quadrant C |
| Plot type | Count rate plots | Images |
|---|---|---|
| Comparison with Poisson distribution Blue bars denote a histogram of data divided into 1 sec bins. Red curve is a Poisson curve with rate = median count rate of data. |
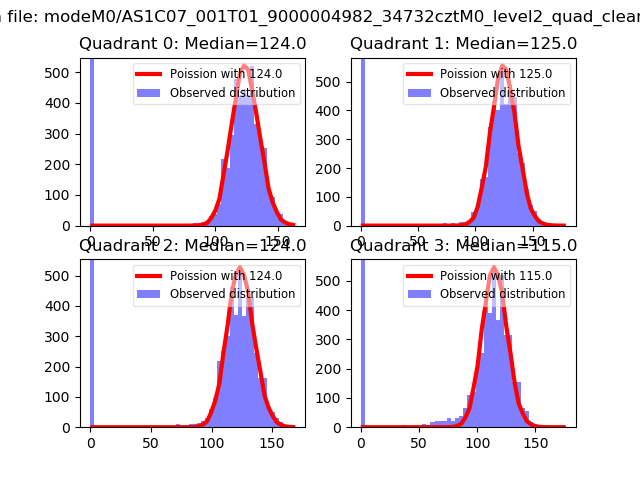 |
 |
| Quadrant-wise count rates Data is divided into 100 sec bins |
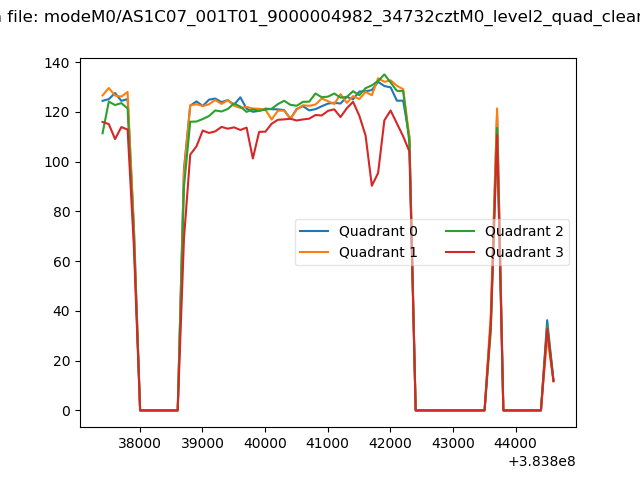 |
|
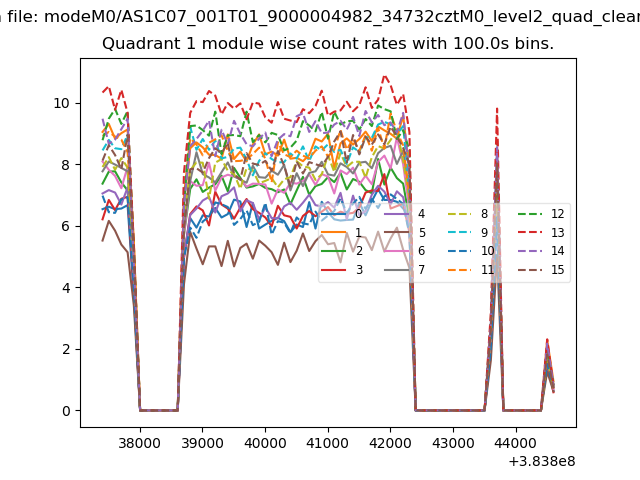
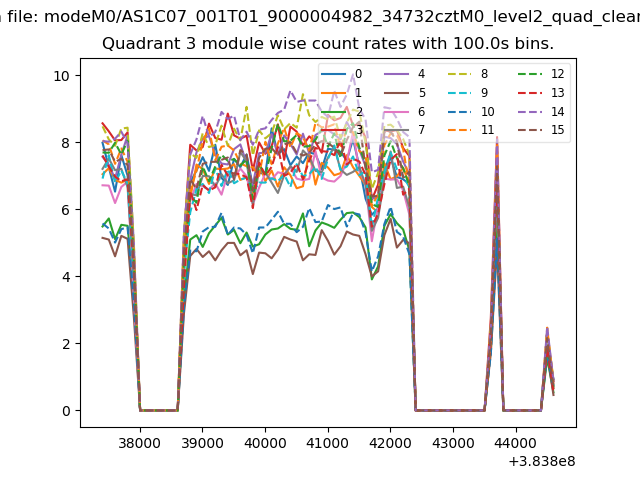
| Module-wise count rates for Quadrant A Data is divided into 100 sec bins |
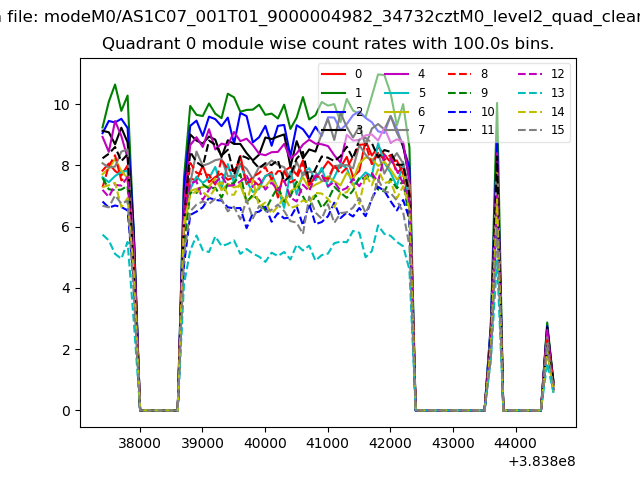 |
 |
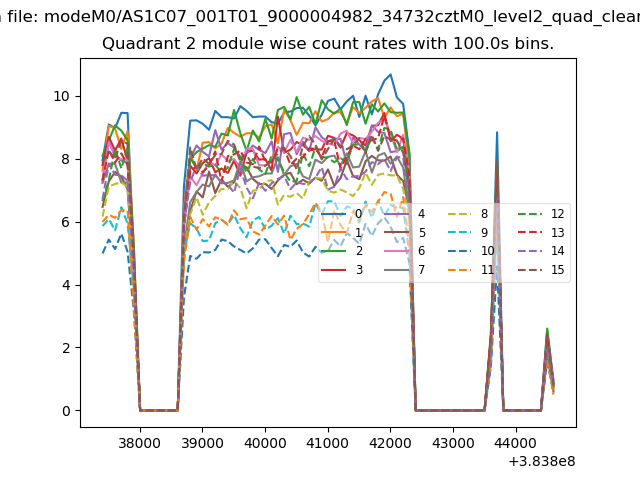
| Module-wise count rates for Quadrant B Data is divided into 100 sec bins |
 |
 |
| Module-wise count rates for Quadrant C Data is divided into 100 sec bins |
 |
 |
| Module-wise count rates for Quadrant D Data is divided into 100 sec bins |
 |
 |
| Parameter | Plot |
|---|---|
| CZT HV Monitor | 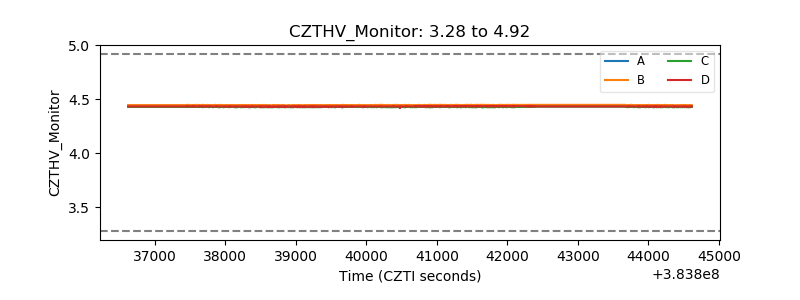 |
| D_VDD | 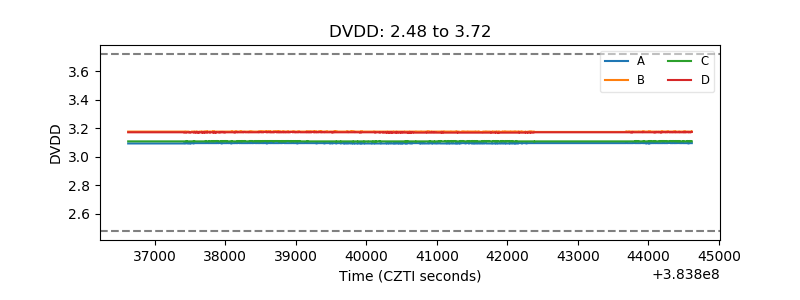 |
| Temperature 1 | 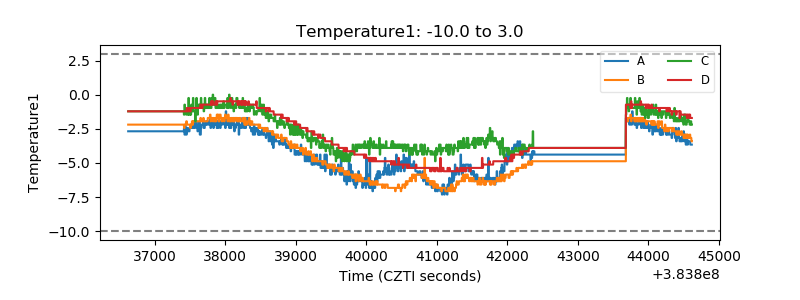 |
| Veto HV Monitor | 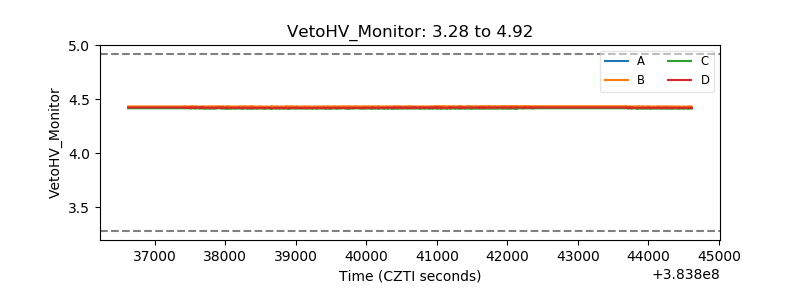 |
| Veto LLD | 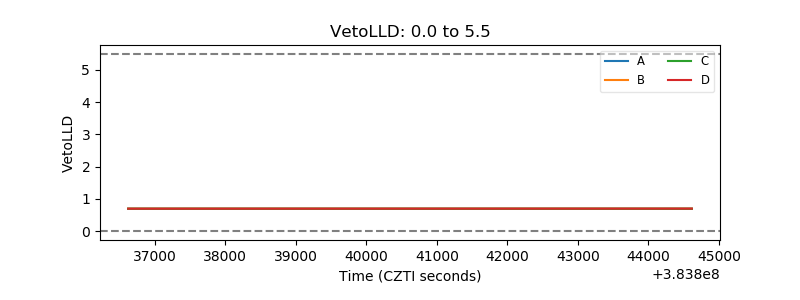 |
| Alpha Counter | 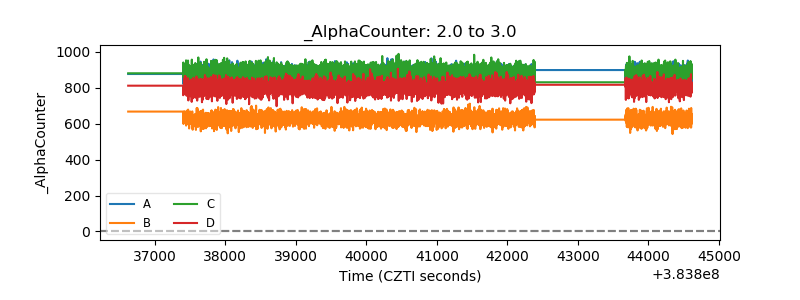 |
| _CPM_Rate | 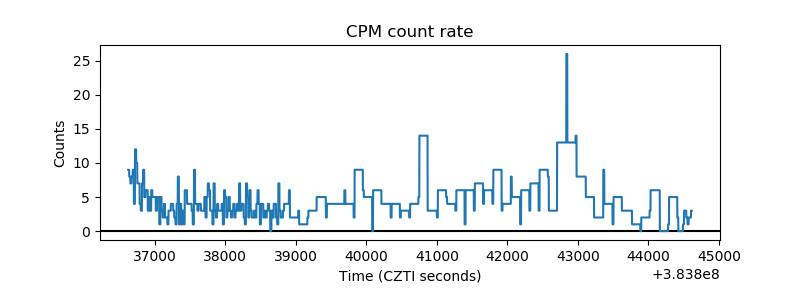 |
| CZT Counter | 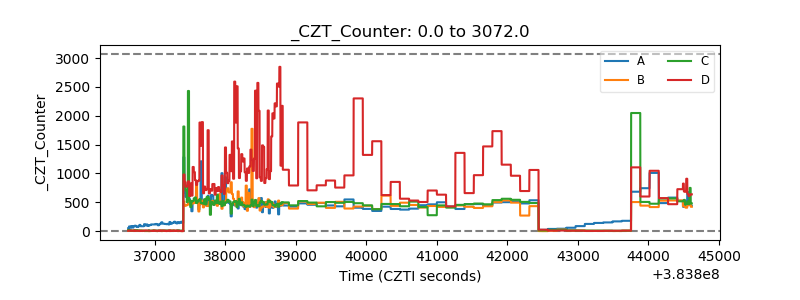 |
| +2.5 Volts monitor | 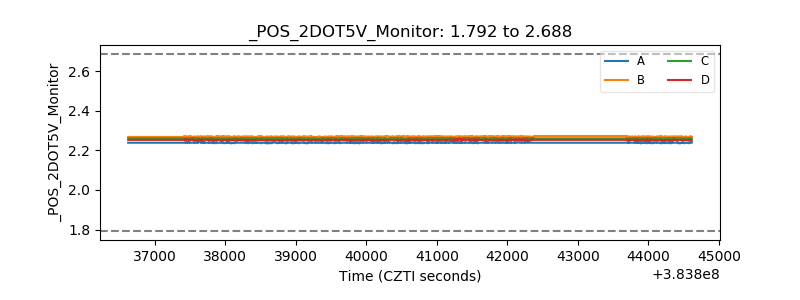 |
| +5 Volts monitor | 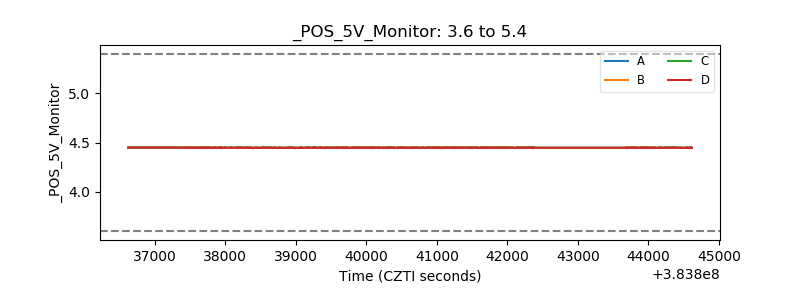 |
| _ROLL_ROT | 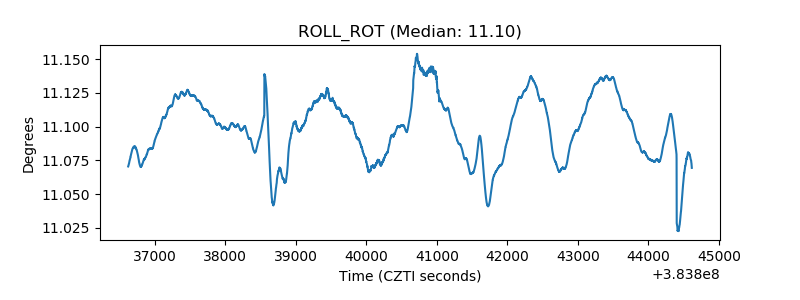 |
| _Roll_DEC | 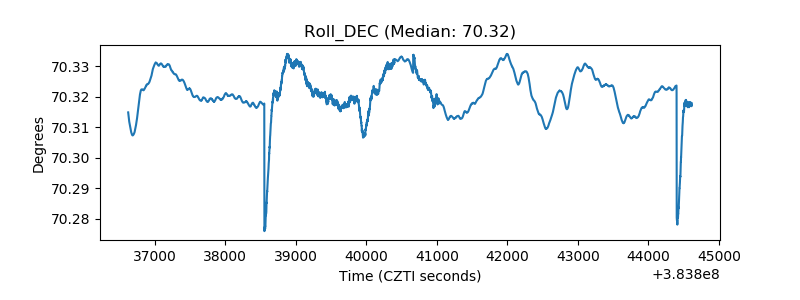 |
| _Roll_RA | 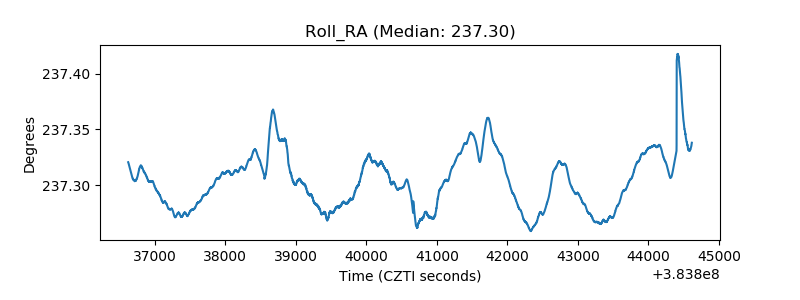 |
| Veto Counter | 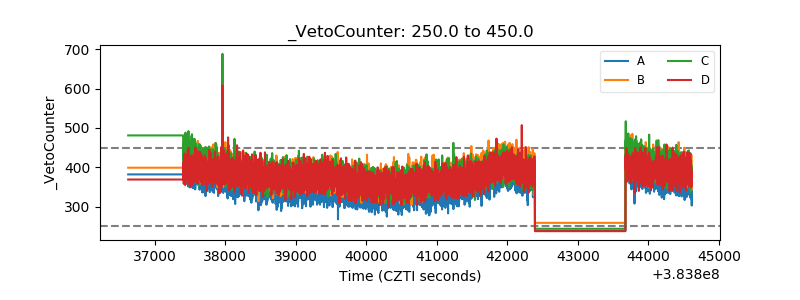 |