| Param | Original file | Final file |
|---|---|---|
| Filename | modeM0/AS1C07_001T01_9000004982_34723cztM0_level2.evt | modeM0/AS1C07_001T01_9000004982_34723cztM0_level2_quad_clean.evt |
| Size (bytes) | 391,193,280 | 100,454,400 |
| Size | 373.1 MB | 95.8 MB |
| Events in quadrant A | 2,489,213 | 668,153 |
| Events in quadrant B | 2,749,184 | 681,577 |
| Events in quadrant C | 2,762,287 | 680,571 |
| Events in quadrant D | 3,486,869 | 641,765 |
| Mode M0 | |||
|---|---|---|---|
| Quadrant | BADHDUFLAG | Total packets | Discarded packets |
| A | 0 | 10994 | 3 |
| B | 0 | 11631 | 2 |
| C | 0 | 11492 | 2 |
| D | 0 | 14100 | 2 |
| Mode SS | |||
|---|---|---|---|
| Quadrant | BADHDUFLAG | Total packets | Discarded packets |
| A | 0 | 108 | 0 |
| B | 0 | 108 | 0 |
| C | 0 | 108 | 0 |
| D | 0 | 108 | 0 |
| Mode M9 | |||
|---|---|---|---|
| Quadrant | BADHDUFLAG | Total packets | Discarded packets |
| A | 0 | 18 | 0 |
| B | 0 | 18 | 0 |
| C | 0 | 18 | 0 |
| D | 0 | 19 | 0 |
| Quadrant | Total seconds | Saturated seconds | Saturation percentage |
|---|---|---|---|
| A | 5289 | 8 | 0.151257% |
| B | 5289 | 51 | 0.964265% |
| C | 5289 | 74 | 1.399130% |
| D | 5289 | 80 | 1.512573% |
Noise dominated data is calculated using 1-second bins in cleaned event files. If a bin has >2000 counts, and if more than 50% of those come from <1% of pixels, then it is considered to be noise-dominated and hence unusable.
| Quadrant | # 1 sec bins | Bins with >0 counts | Bins with >2000 counts | High rate bins dominated by noise | Noise dominated (total time) | Noise dominated (detector-on time) | Marked lightcurve |
|---|---|---|---|---|---|---|---|
| A | 7052 | 5290 | 1 | 1 | 0.01% | 0.02% | 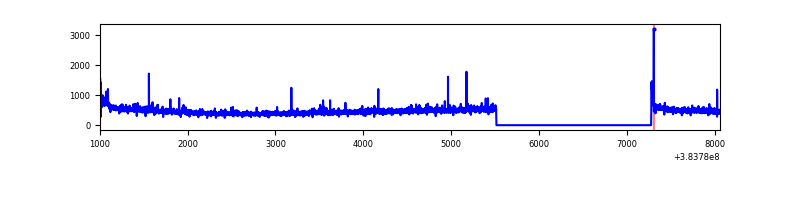 |
| B | 7052 | 5290 | 25 | 25 | 0.35% | 0.47% | 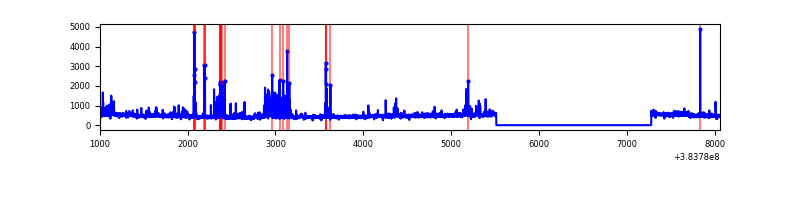 |
| C | 7052 | 5290 | 42 | 42 | 0.60% | 0.79% | 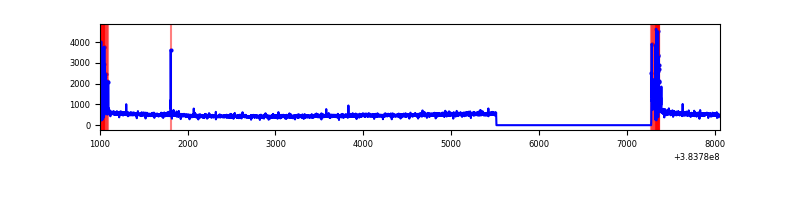 |
| D | 7052 | 5290 | 61 | 61 | 0.87% | 1.15% | 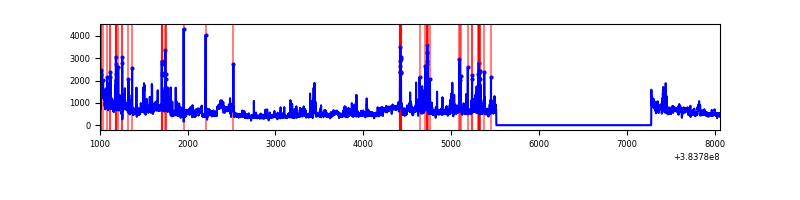 |
Top three noisy pixels from each quadrant. If the there are fewer than three noisy pixels in the level2.evt file, extra rows are filled as -1
| Pixel properties | Quadrant properties | ||||||
|---|---|---|---|---|---|---|---|
| Quadrant | DetID | PixID | Counts | Sigma | Mean | Median | Sigma |
| A | 15 | 169 | 49460 | 402.87 | 603 | 591 | 121.3 |
| A | 10 | 83 | 47057 | 383.06 | 603 | 591 | 121.3 |
| A | 7 | 48 | 31155 | 251.97 | 603 | 591 | 121.3 |
| B | 0 | 182 | 98084 | 852.25 | 603 | 589 | 114.4 |
| B | 5 | 172 | 76383 | 662.55 | 603 | 589 | 114.4 |
| B | 4 | 171 | 63618 | 550.97 | 603 | 589 | 114.4 |
| C | 15 | 214 | 225658 | 1643.16 | 592 | 596 | 137.0 |
| C | 0 | 10 | 191780 | 1395.82 | 592 | 596 | 137.0 |
| C | 14 | 67 | 13982 | 97.73 | 592 | 596 | 137.0 |
| D | 8 | 195 | 614577 | 3938.77 | 580 | 568 | 155.9 |
| D | 1 | 20 | 171897 | 1099.05 | 580 | 568 | 155.9 |
| D | 2 | 250 | 126782 | 809.64 | 580 | 568 | 155.9 |
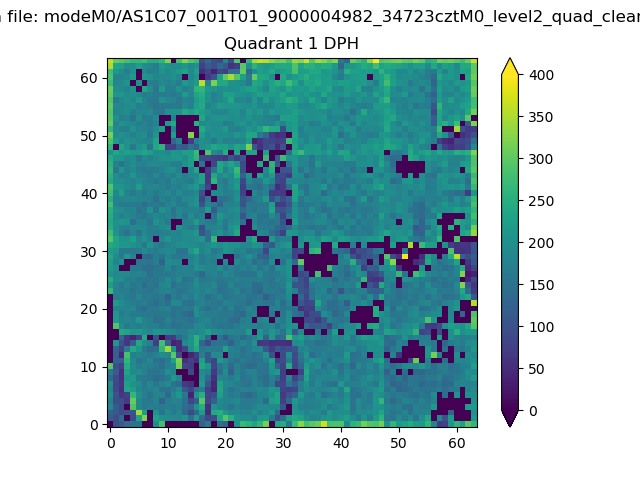
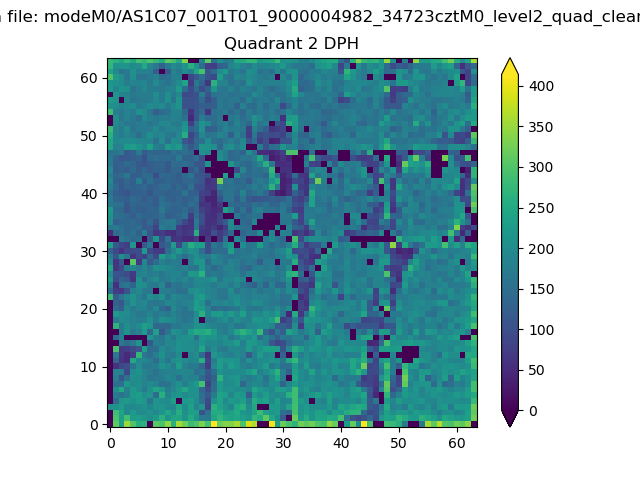
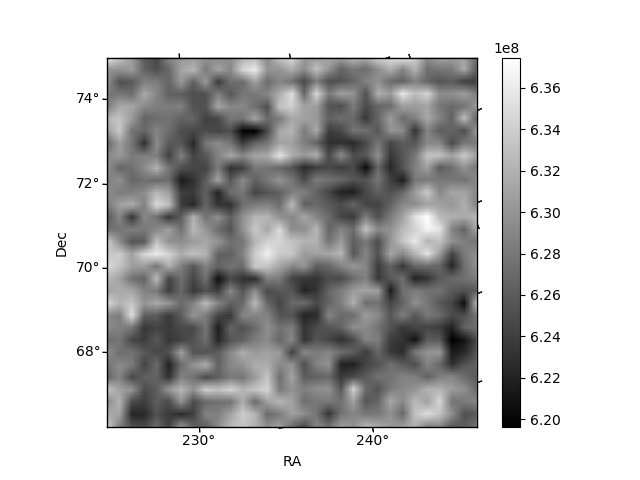
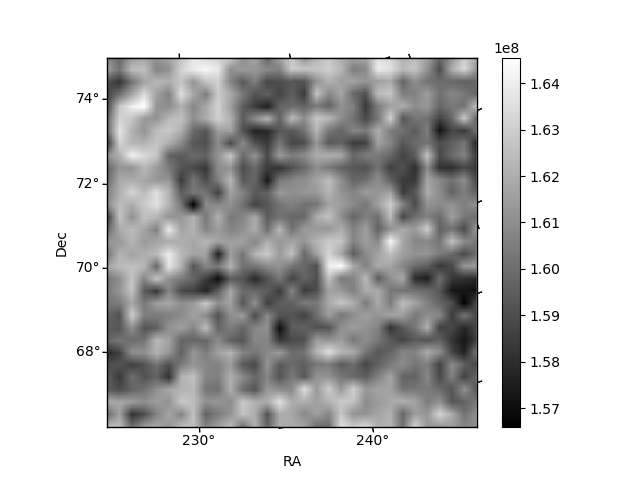
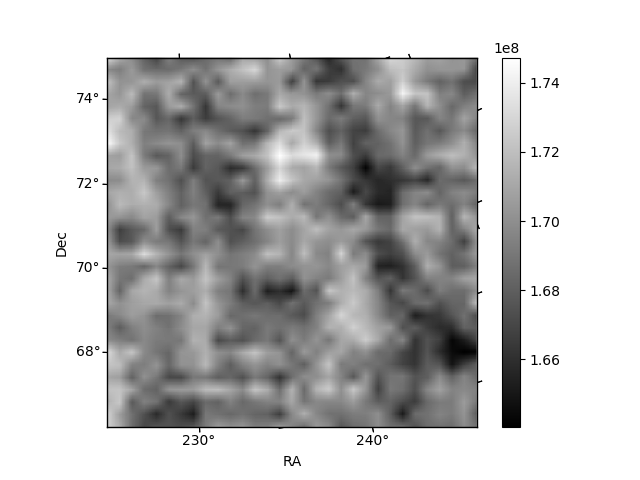
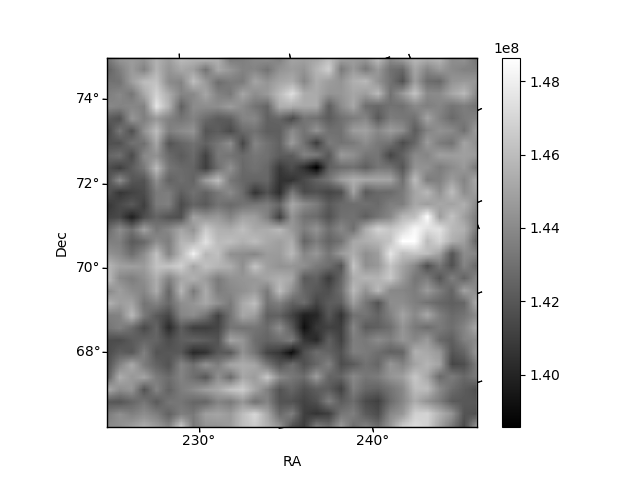
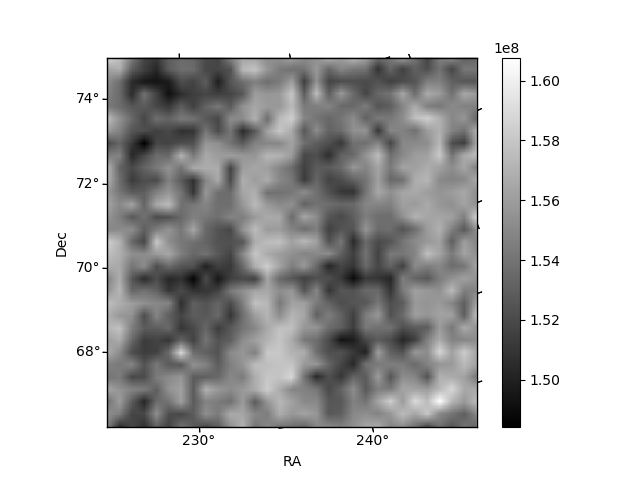
Histogram calculated using DETX and DETY for each event in the final _common_clean file
| Quadrant A |  |
 |
Quadrant B |
|---|---|---|---|
| Quadrant D | 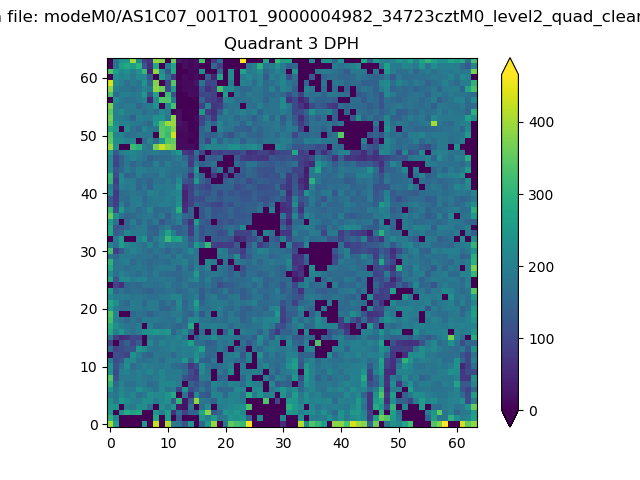 |
 |
Quadrant C |
| Plot type | Count rate plots | Images |
|---|---|---|
| Comparison with Poisson distribution Blue bars denote a histogram of data divided into 1 sec bins. Red curve is a Poisson curve with rate = median count rate of data. |
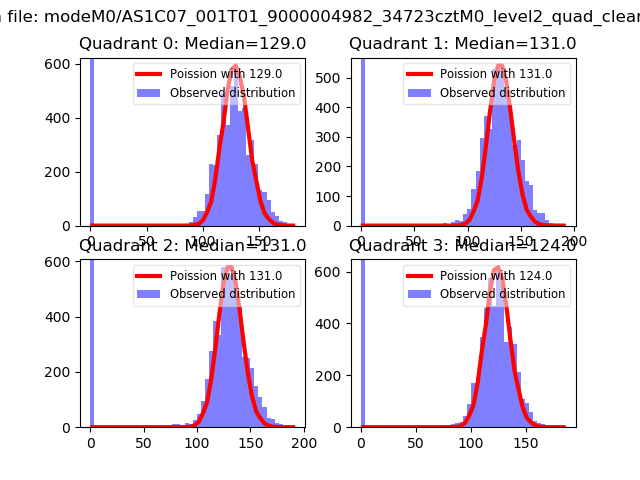 |
 |
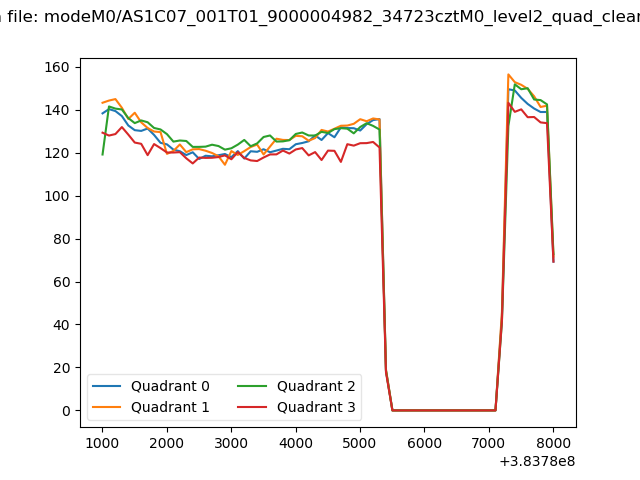
| Quadrant-wise count rates Data is divided into 100 sec bins |
 |
|
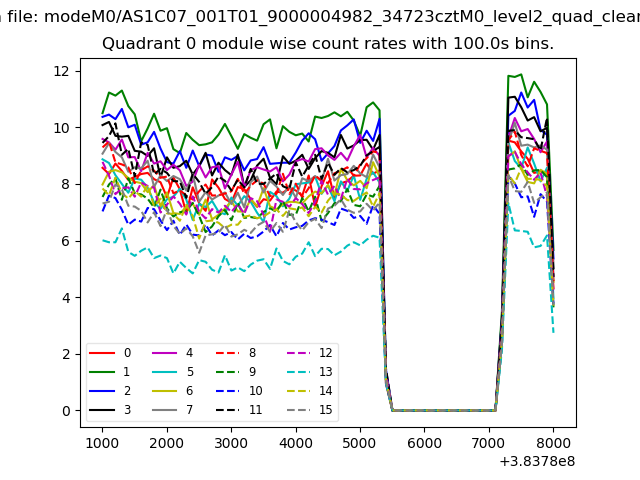
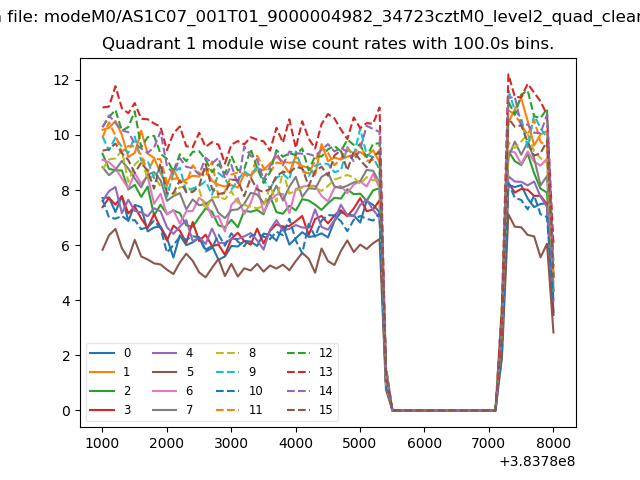
| Module-wise count rates for Quadrant A Data is divided into 100 sec bins |
 |
 |
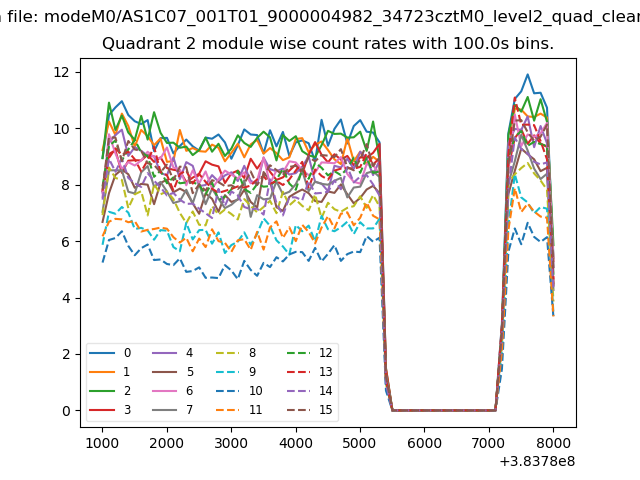
| Module-wise count rates for Quadrant B Data is divided into 100 sec bins |
 |
 |
| Module-wise count rates for Quadrant C Data is divided into 100 sec bins |
 |
 |
| Module-wise count rates for Quadrant D Data is divided into 100 sec bins |
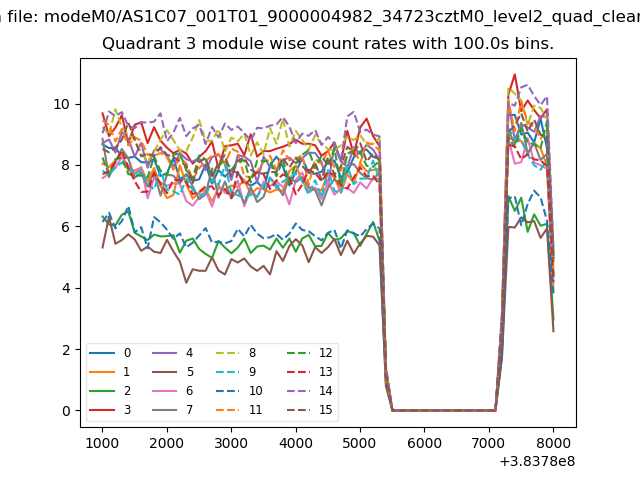 |
 |
| Parameter | Plot |
|---|---|
| CZT HV Monitor | 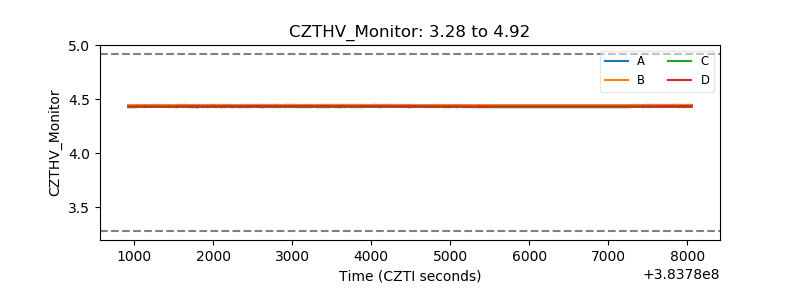 |
| D_VDD | 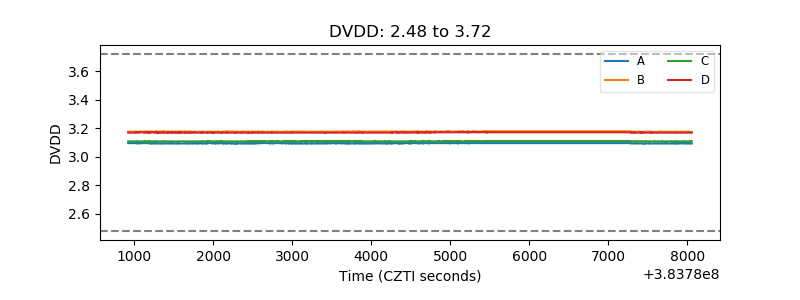 |
| Temperature 1 | 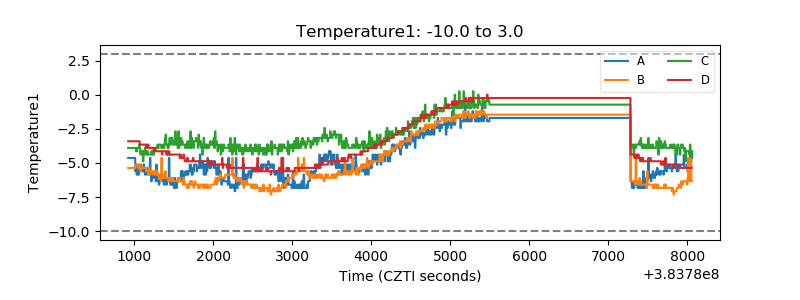 |
| Veto HV Monitor | 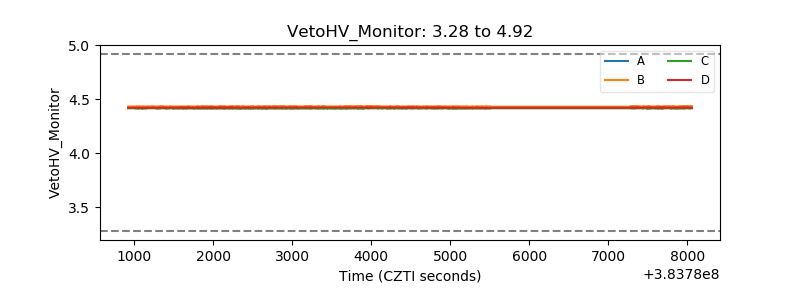 |
| Veto LLD | 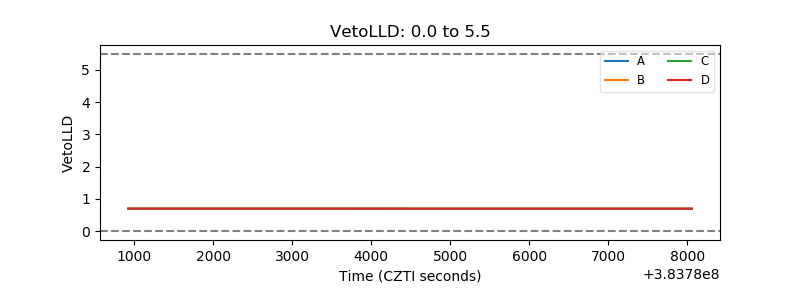 |
| Alpha Counter | 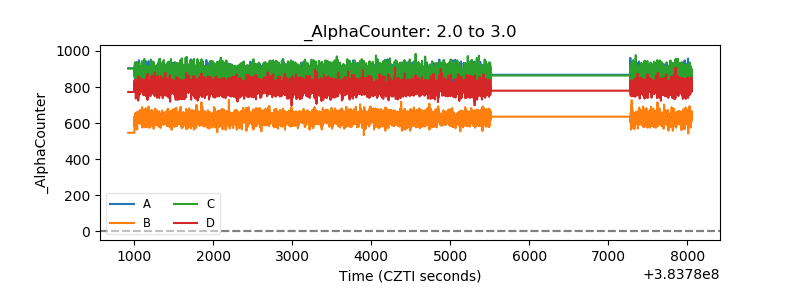 |
| _CPM_Rate | 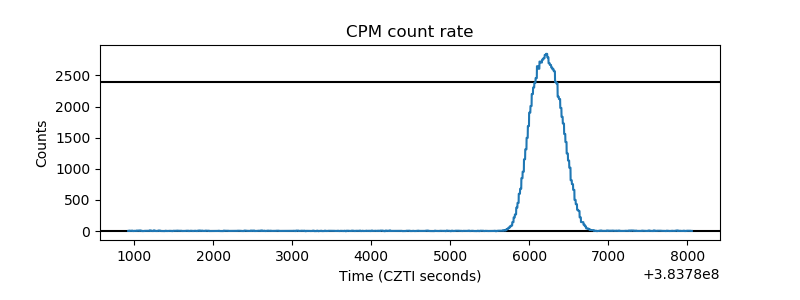 |
| CZT Counter | 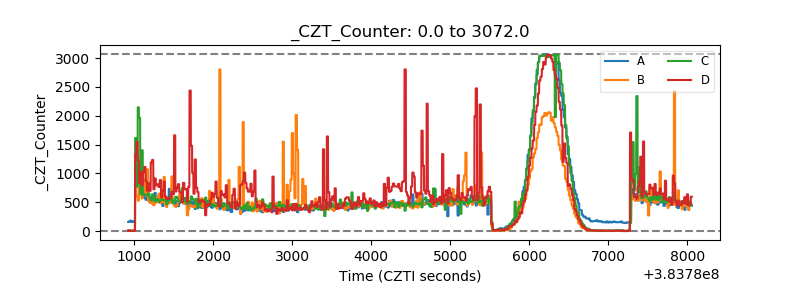 |
| +2.5 Volts monitor | 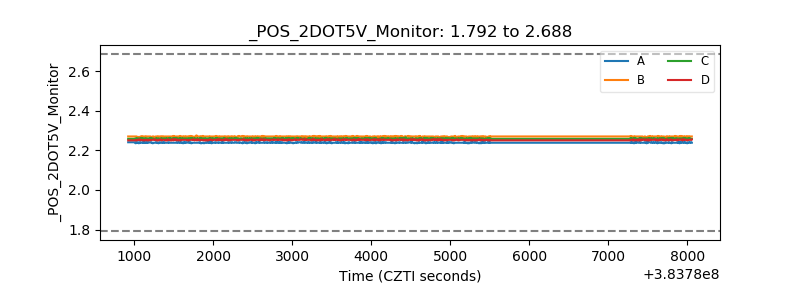 |
| +5 Volts monitor | 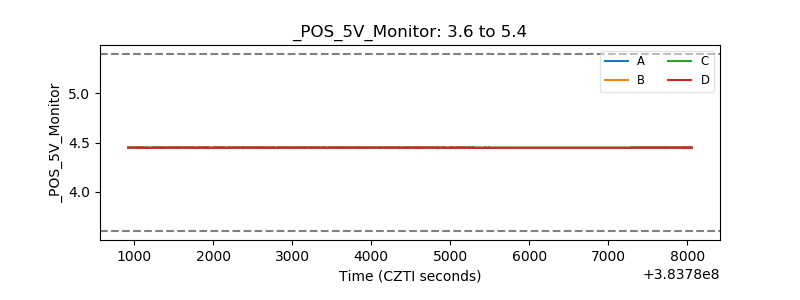 |
| _ROLL_ROT | 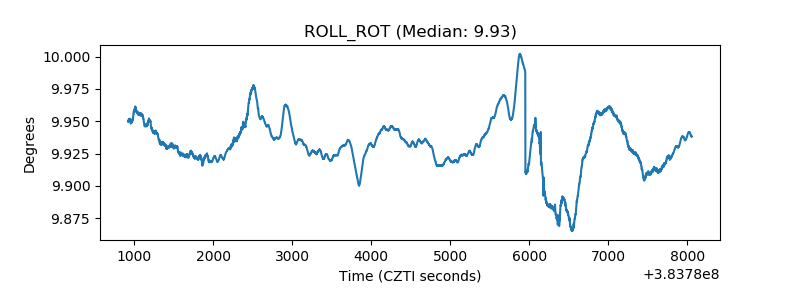 |
| _Roll_DEC | 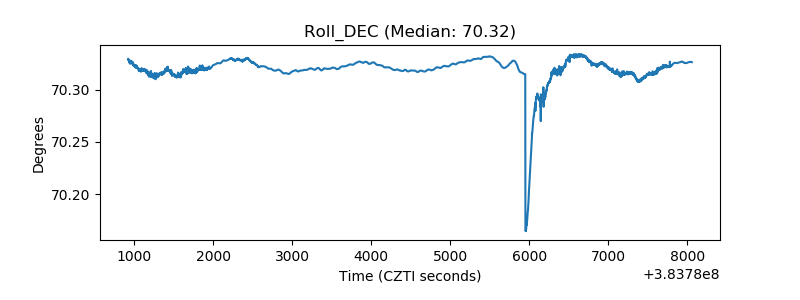 |
| _Roll_RA | 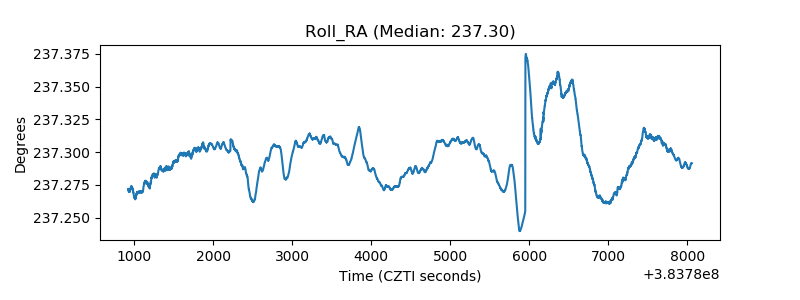 |
| Veto Counter | 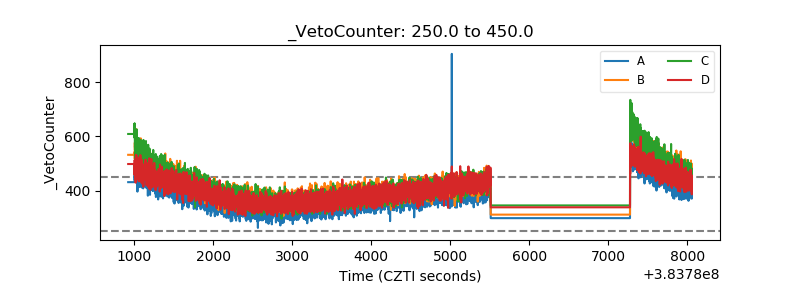 |