| Param | Original file | Final file |
|---|---|---|
| Filename | modeM0/AS1C07_001T01_9000004982_34716cztM0_level2.evt | modeM0/AS1C07_001T01_9000004982_34716cztM0_level2_quad_clean.evt |
| Size (bytes) | 518,976,000 | 95,613,120 |
| Size | 494.9 MB | 91.2 MB |
| Events in quadrant A | 3,537,467 | 626,276 |
| Events in quadrant B | 2,948,048 | 641,025 |
| Events in quadrant C | 3,148,309 | 630,031 |
| Events in quadrant D | 5,686,217 | 588,428 |
| Mode M0 | |||
|---|---|---|---|
| Quadrant | BADHDUFLAG | Total packets | Discarded packets |
| A | 0 | 14081 | 3 |
| B | 0 | 12509 | 2 |
| C | 0 | 12738 | 2 |
| D | 0 | 20969 | 2 |
| Mode SS | |||
|---|---|---|---|
| Quadrant | BADHDUFLAG | Total packets | Discarded packets |
| A | 0 | 118 | 0 |
| B | 0 | 118 | 0 |
| C | 0 | 118 | 0 |
| D | 0 | 118 | 0 |
| Mode M9 | |||
|---|---|---|---|
| Quadrant | BADHDUFLAG | Total packets | Discarded packets |
| A | 0 | 26 | 0 |
| B | 0 | 26 | 0 |
| C | 0 | 26 | 0 |
| D | 0 | 27 | 0 |
| Quadrant | Total seconds | Saturated seconds | Saturation percentage |
|---|---|---|---|
| A | 5867 | 166 | 2.829385% |
| B | 5867 | 39 | 0.664735% |
| C | 5867 | 85 | 1.448781% |
| D | 5867 | 334 | 5.692858% |
Noise dominated data is calculated using 1-second bins in cleaned event files. If a bin has >2000 counts, and if more than 50% of those come from <1% of pixels, then it is considered to be noise-dominated and hence unusable.
| Quadrant | # 1 sec bins | Bins with >0 counts | Bins with >2000 counts | High rate bins dominated by noise | Noise dominated (total time) | Noise dominated (detector-on time) | Marked lightcurve |
|---|---|---|---|---|---|---|---|
| A | 7300 | 5868 | 138 | 138 | 1.89% | 2.35% | 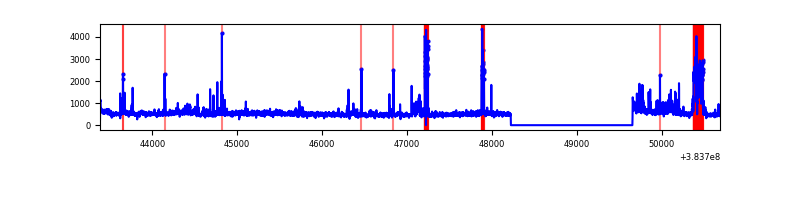 |
| B | 7300 | 5868 | 20 | 20 | 0.27% | 0.34% | 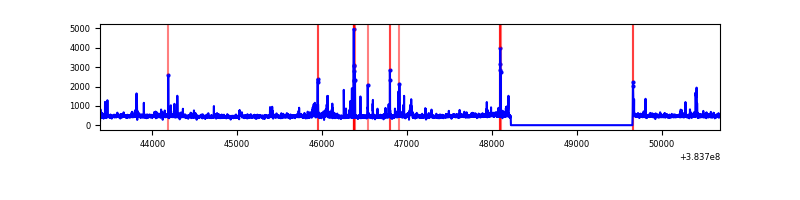 |
| C | 7300 | 5868 | 68 | 68 | 0.93% | 1.16% |  |
| D | 7300 | 5868 | 272 | 272 | 3.73% | 4.64% | 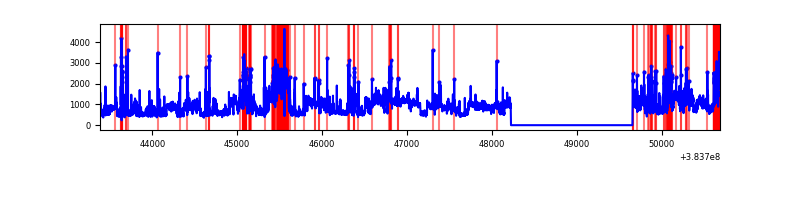 |
Top three noisy pixels from each quadrant. If the there are fewer than three noisy pixels in the level2.evt file, extra rows are filled as -1
| Pixel properties | Quadrant properties | ||||||
|---|---|---|---|---|---|---|---|
| Quadrant | DetID | PixID | Counts | Sigma | Mean | Median | Sigma |
| A | 15 | 169 | 605863 | 4495.67 | 666 | 654 | 134.6 |
| A | 15 | 174 | 179640 | 1329.56 | 666 | 654 | 134.6 |
| A | 9 | 143 | 82892 | 610.89 | 666 | 654 | 134.6 |
| B | 5 | 172 | 122017 | 953.41 | 669 | 651 | 127.3 |
| B | 4 | 171 | 56467 | 438.47 | 669 | 651 | 127.3 |
| B | 4 | 81 | 40043 | 309.45 | 669 | 651 | 127.3 |
| C | 15 | 214 | 250802 | 1660.47 | 654 | 658 | 150.6 |
| C | 0 | 10 | 207551 | 1373.37 | 654 | 658 | 150.6 |
| C | 0 | 207 | 66711 | 438.46 | 654 | 658 | 150.6 |
| D | 8 | 195 | 1458046 | 8558.68 | 643 | 629 | 170.3 |
| D | 14 | 52 | 463207 | 2716.49 | 643 | 629 | 170.3 |
| D | 13 | 249 | 430590 | 2524.95 | 643 | 629 | 170.3 |
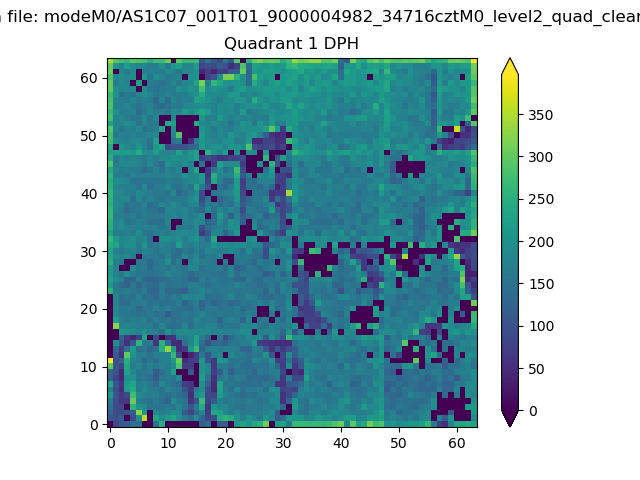
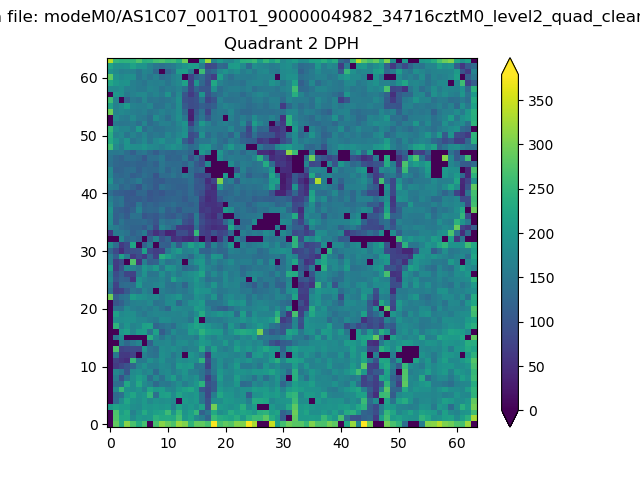
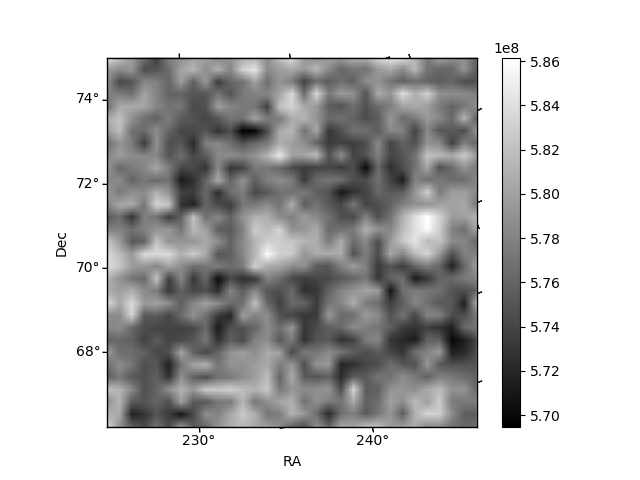
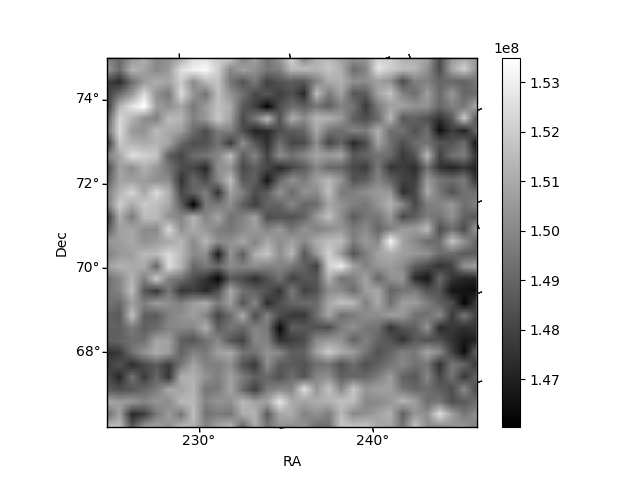
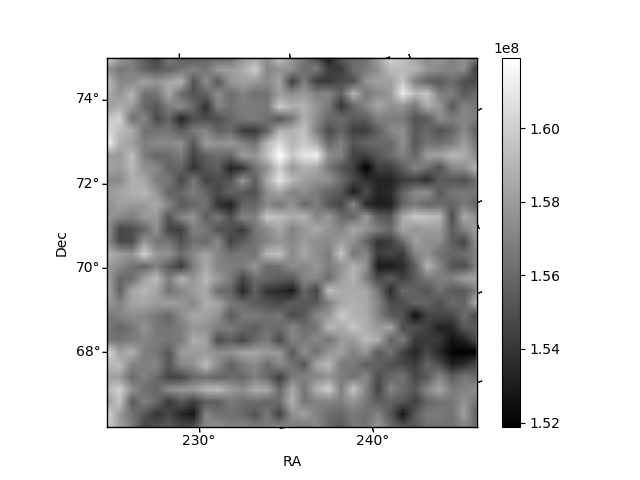
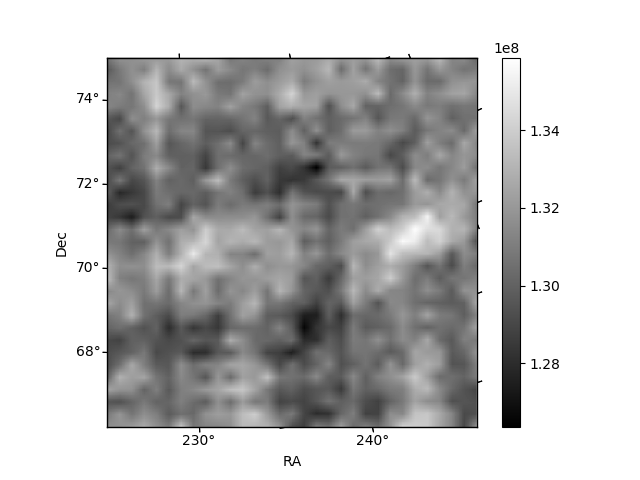
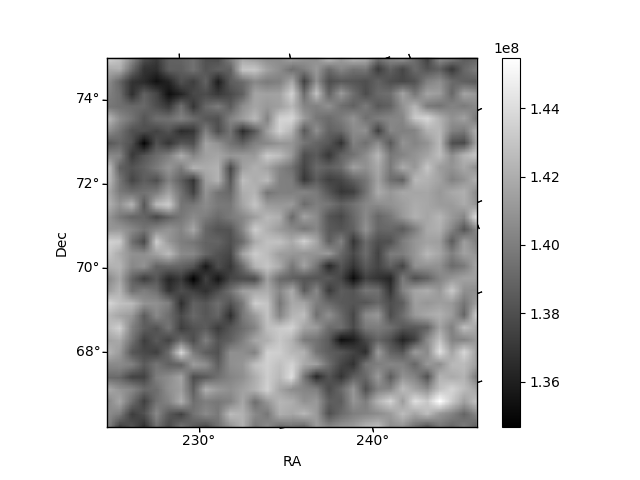
Histogram calculated using DETX and DETY for each event in the final _common_clean file
| Quadrant A | 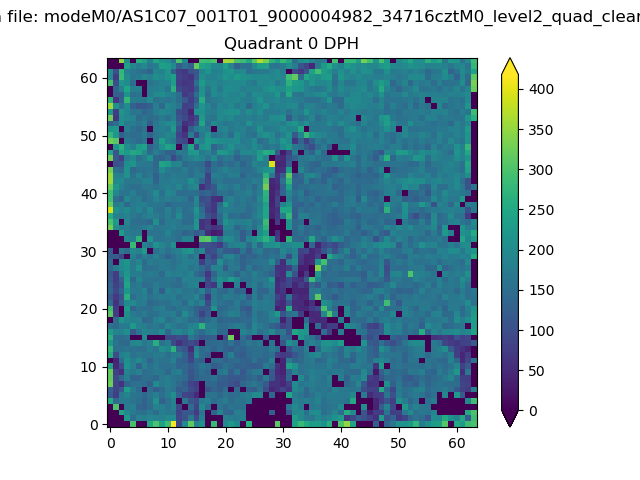 |
 |
Quadrant B |
|---|---|---|---|
| Quadrant D | 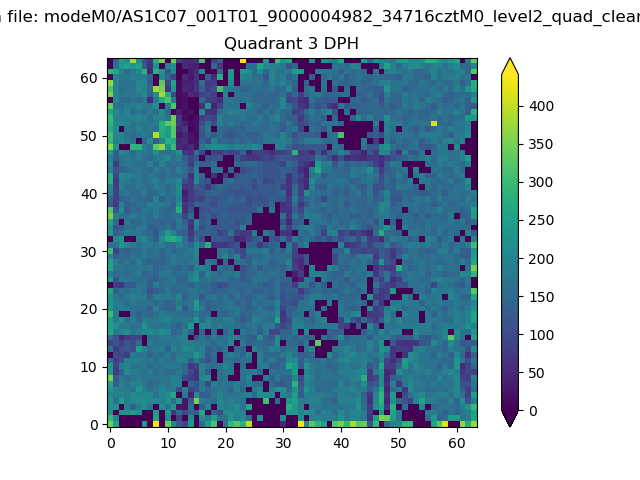 |
 |
Quadrant C |
| Plot type | Count rate plots | Images |
|---|---|---|
| Comparison with Poisson distribution Blue bars denote a histogram of data divided into 1 sec bins. Red curve is a Poisson curve with rate = median count rate of data. |
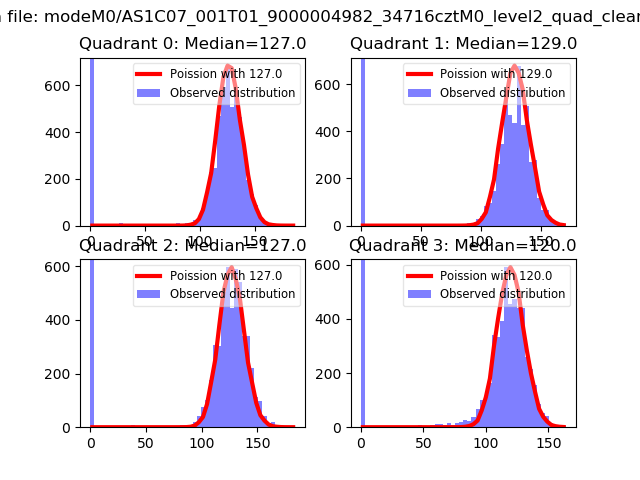 |
 |
| Quadrant-wise count rates Data is divided into 100 sec bins |
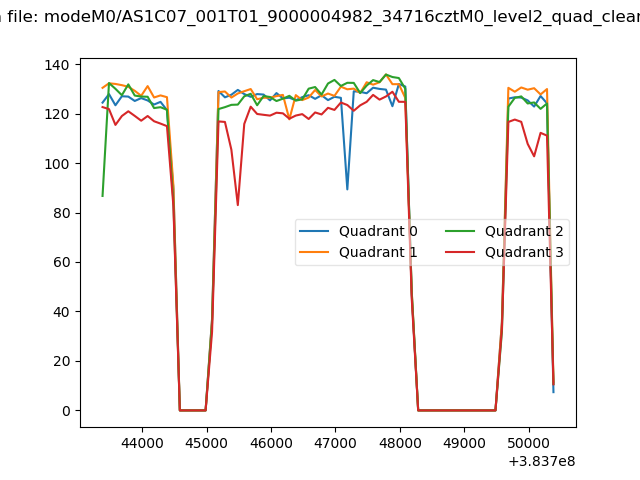 |
|
| Module-wise count rates for Quadrant A Data is divided into 100 sec bins |
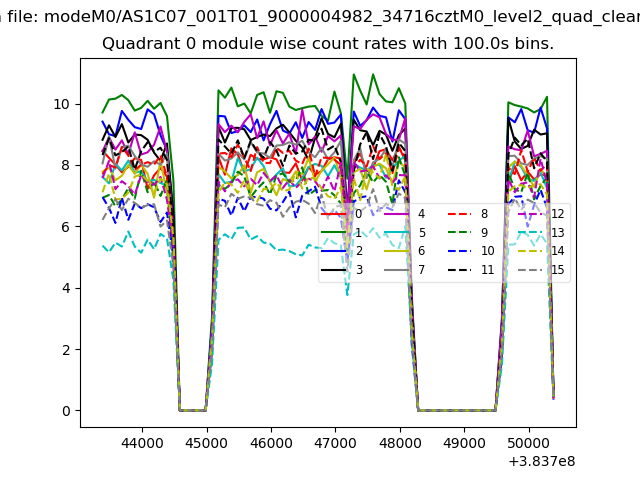 |
 |
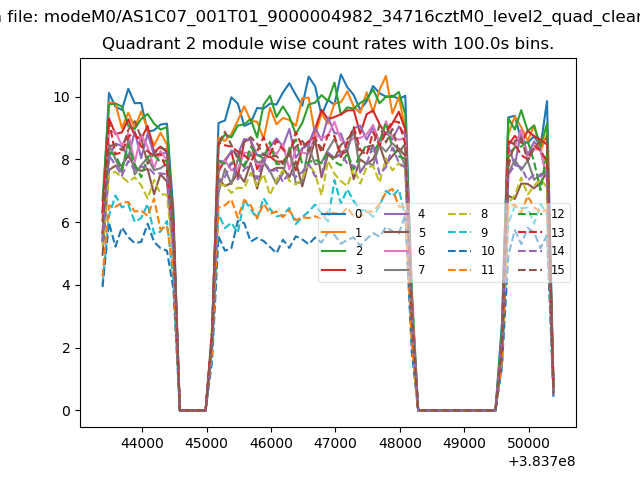
| Module-wise count rates for Quadrant B Data is divided into 100 sec bins |
 |
 |
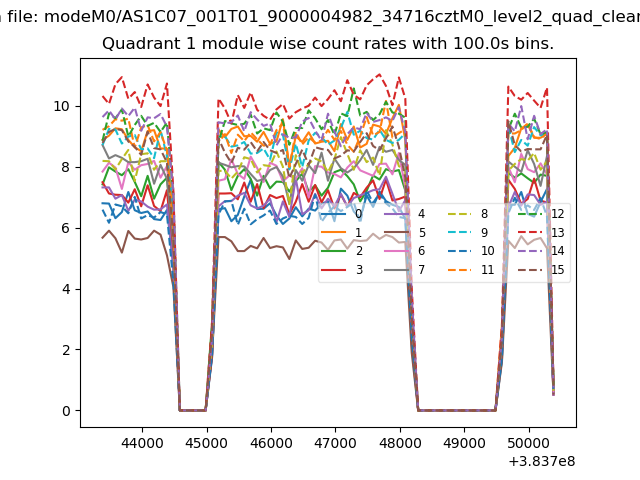
| Module-wise count rates for Quadrant C Data is divided into 100 sec bins |
 |
 |
| Module-wise count rates for Quadrant D Data is divided into 100 sec bins |
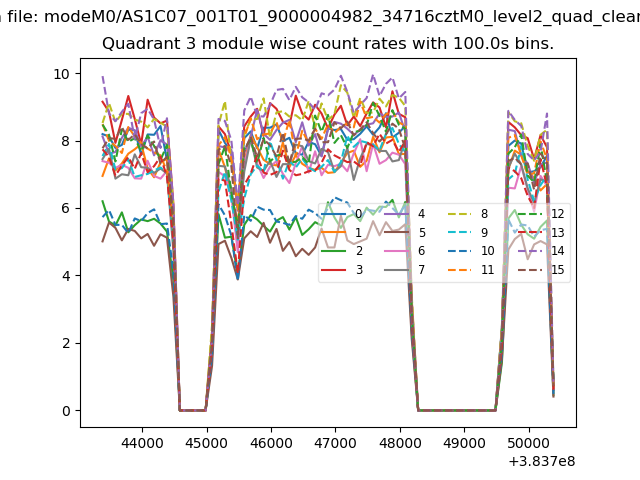 |
 |
| Parameter | Plot |
|---|---|
| CZT HV Monitor | 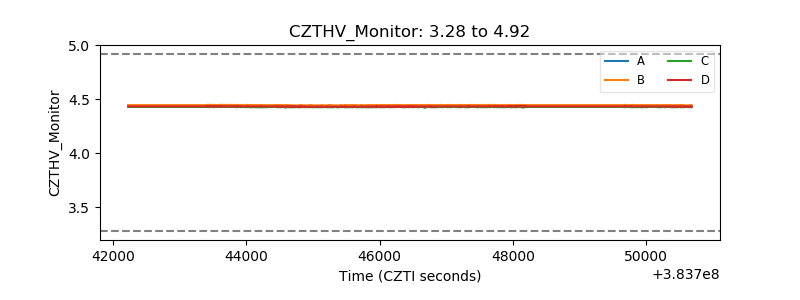 |
| D_VDD | 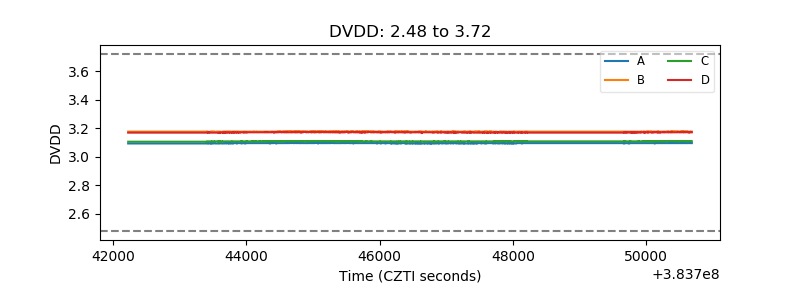 |
| Temperature 1 | 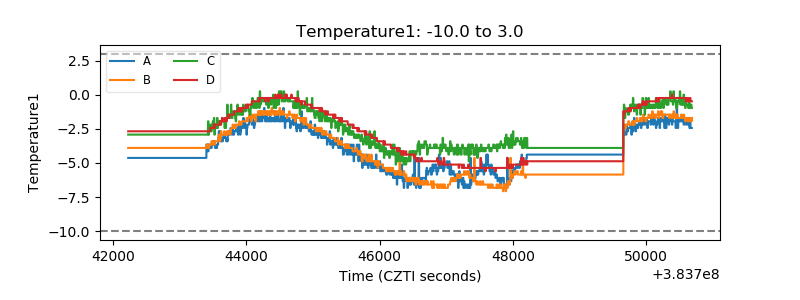 |
| Veto HV Monitor | 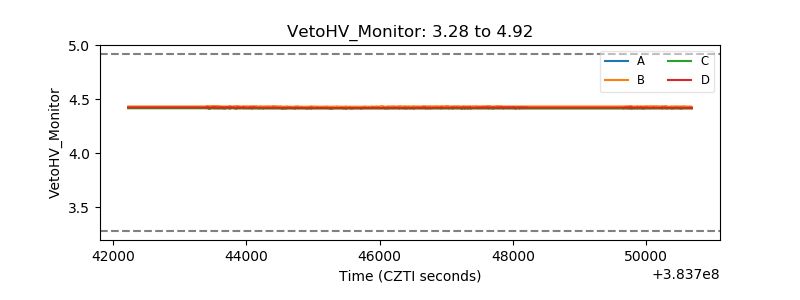 |
| Veto LLD | 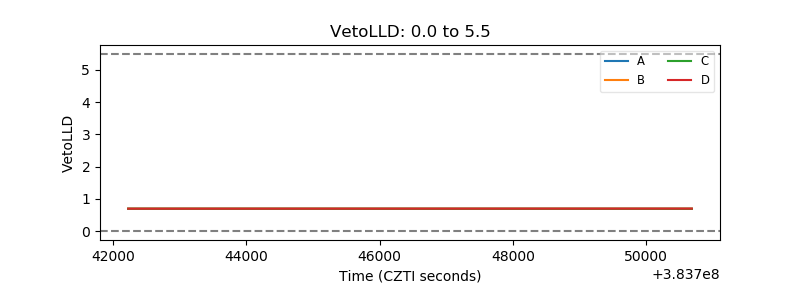 |
| Alpha Counter | 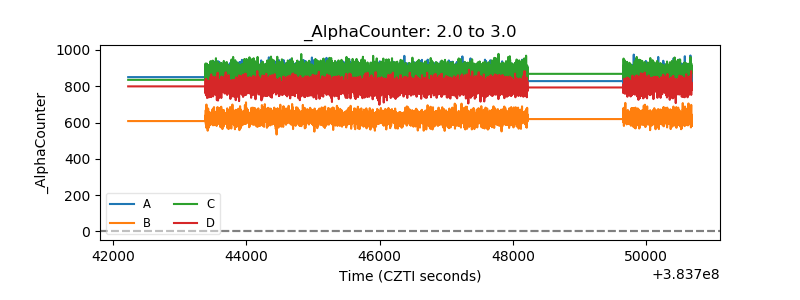 |
| _CPM_Rate | 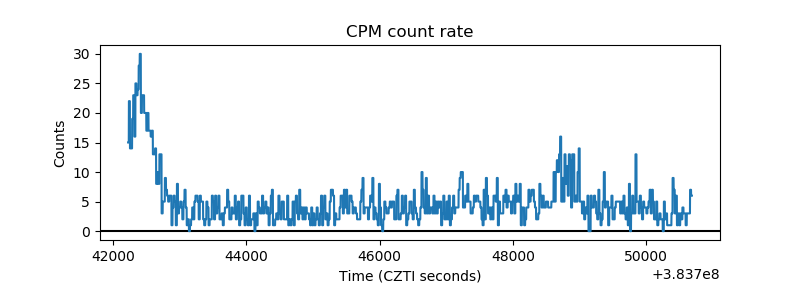 |
| CZT Counter | 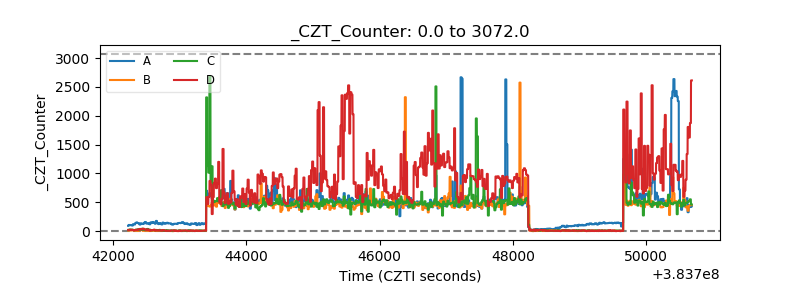 |
| +2.5 Volts monitor | 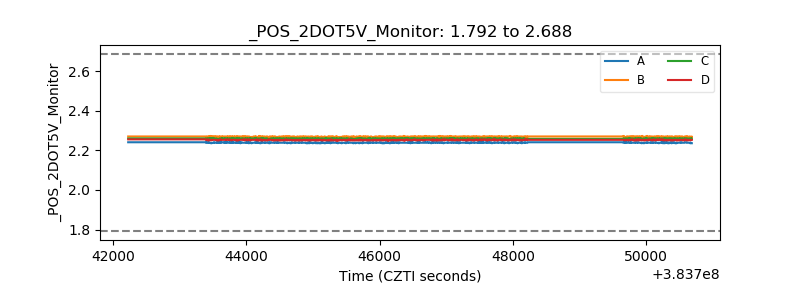 |
| +5 Volts monitor | 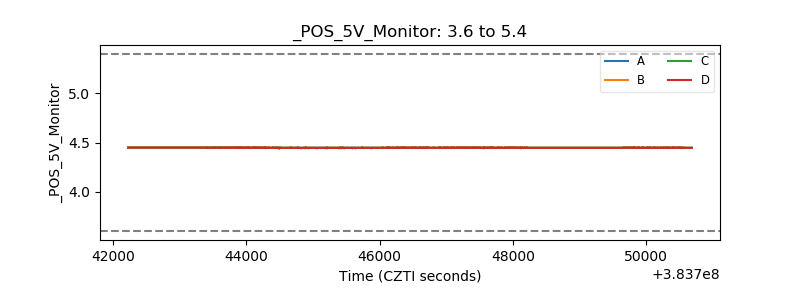 |
| _ROLL_ROT | 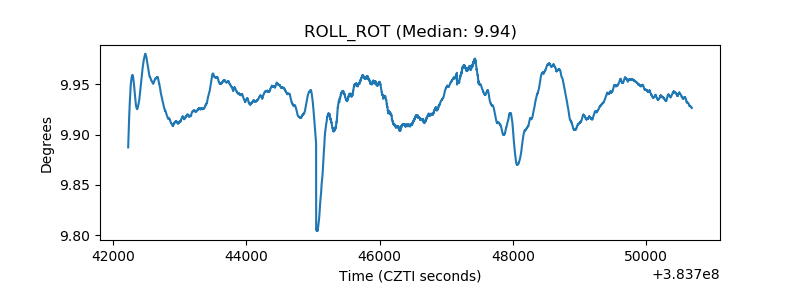 |
| _Roll_DEC | 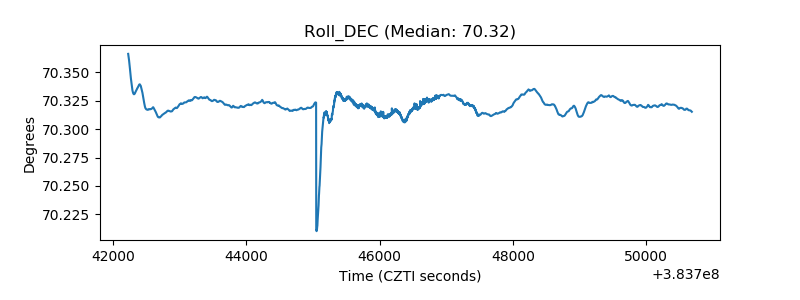 |
| _Roll_RA | 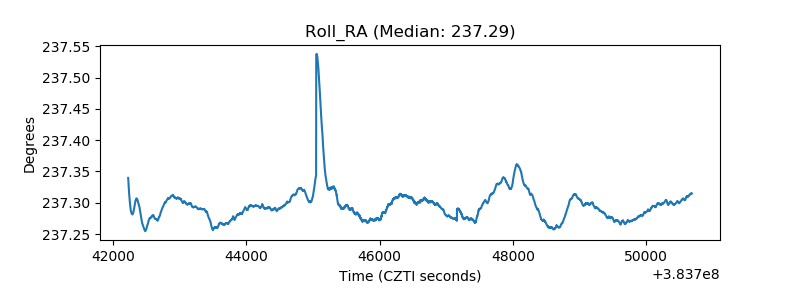 |
| Veto Counter | 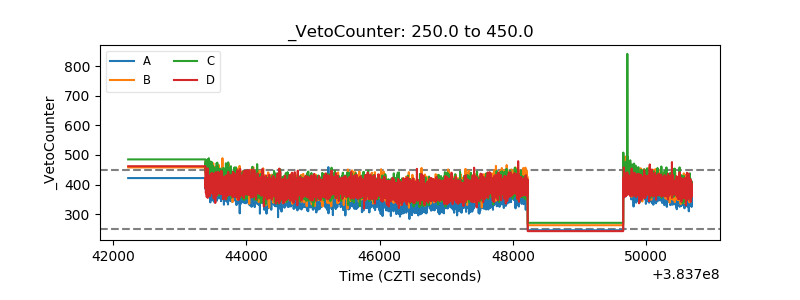 |