| Param | Original file | Final file |
|---|---|---|
| Filename | modeM0/AS1C07_001T01_9000004982_34715cztM0_level2.evt | modeM0/AS1C07_001T01_9000004982_34715cztM0_level2_quad_clean.evt |
| Size (bytes) | 75,078,720 | 17,688,960 |
| Size | 71.6 MB | 16.9 MB |
| Events in quadrant A | 513,997 | 116,724 |
| Events in quadrant B | 456,969 | 120,637 |
| Events in quadrant C | 590,225 | 115,440 |
| Events in quadrant D | 646,709 | 110,604 |
| Mode M0 | |||
|---|---|---|---|
| Quadrant | BADHDUFLAG | Total packets | Discarded packets |
| A | 0 | 2059 | 2 |
| B | 0 | 1934 | 1 |
| C | 0 | 2280 | 1 |
| D | 0 | 2529 | 1 |
| Mode SS | |||
|---|---|---|---|
| Quadrant | BADHDUFLAG | Total packets | Discarded packets |
| A | 0 | 20 | 0 |
| B | 0 | 20 | 0 |
| C | 0 | 20 | 0 |
| D | 0 | 20 | 0 |
| Mode M9 | |||
|---|---|---|---|
| Quadrant | BADHDUFLAG | Total packets | Discarded packets |
| A | 0 | 17 | 0 |
| B | 0 | 17 | 0 |
| C | 0 | 17 | 0 |
| D | 0 | 17 | 0 |
| Quadrant | Total seconds | Saturated seconds | Saturation percentage |
|---|---|---|---|
| A | 924 | 5 | 0.541126% |
| B | 924 | 4 | 0.432900% |
| C | 924 | 51 | 5.519481% |
| D | 924 | 23 | 2.489177% |
Noise dominated data is calculated using 1-second bins in cleaned event files. If a bin has >2000 counts, and if more than 50% of those come from <1% of pixels, then it is considered to be noise-dominated and hence unusable.
| Quadrant | # 1 sec bins | Bins with >0 counts | Bins with >2000 counts | High rate bins dominated by noise | Noise dominated (total time) | Noise dominated (detector-on time) | Marked lightcurve |
|---|---|---|---|---|---|---|---|
| A | 2658 | 925 | 3 | 3 | 0.11% | 0.32% | 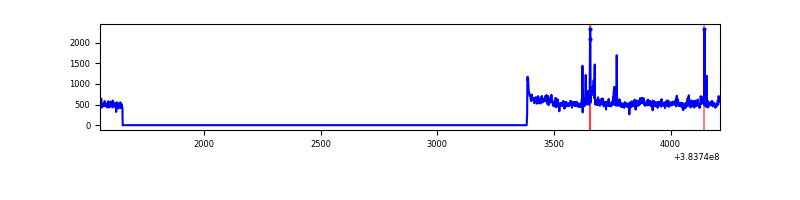 |
| B | 2658 | 925 | 1 | 1 | 0.04% | 0.11% | 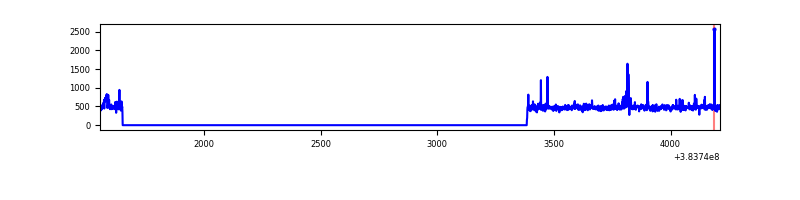 |
| C | 2658 | 925 | 40 | 40 | 1.50% | 4.32% | 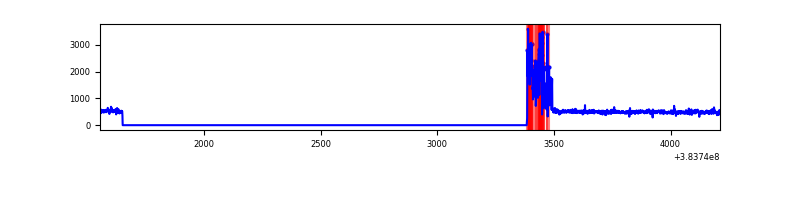 |
| D | 2658 | 925 | 13 | 13 | 0.49% | 1.41% | 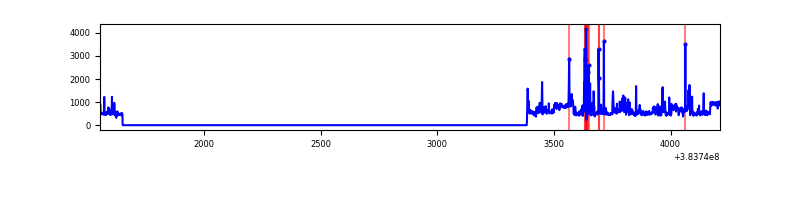 |
Top three noisy pixels from each quadrant. If the there are fewer than three noisy pixels in the level2.evt file, extra rows are filled as -1
| Pixel properties | Quadrant properties | ||||||
|---|---|---|---|---|---|---|---|
| Quadrant | DetID | PixID | Counts | Sigma | Mean | Median | Sigma |
| A | 15 | 169 | 43716 | 1859.19 | 108 | 106 | 23.5 |
| A | 9 | 143 | 21274 | 902.44 | 108 | 106 | 23.5 |
| A | 10 | 83 | 19447 | 824.55 | 108 | 106 | 23.5 |
| B | 4 | 81 | 9403 | 414.22 | 107 | 104 | 22.4 |
| B | 4 | 232 | 6679 | 292.88 | 107 | 104 | 22.4 |
| B | 0 | 189 | 5695 | 249.05 | 107 | 104 | 22.4 |
| C | 0 | 10 | 146350 | 5795.49 | 101 | 101 | 25.2 |
| C | 15 | 214 | 42071 | 1663.17 | 101 | 101 | 25.2 |
| C | 14 | 67 | 3595 | 138.46 | 101 | 101 | 25.2 |
| D | 8 | 195 | 95499 | 3497.18 | 104 | 100 | 27.3 |
| D | 12 | 6 | 38051 | 1391.22 | 104 | 100 | 27.3 |
| D | 13 | 249 | 20274 | 739.55 | 104 | 100 | 27.3 |
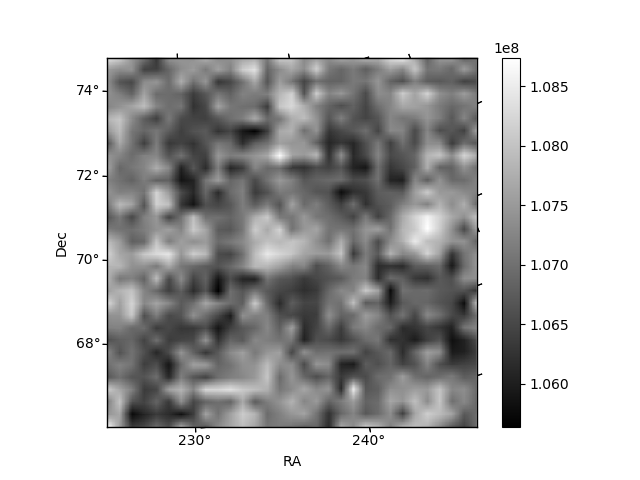
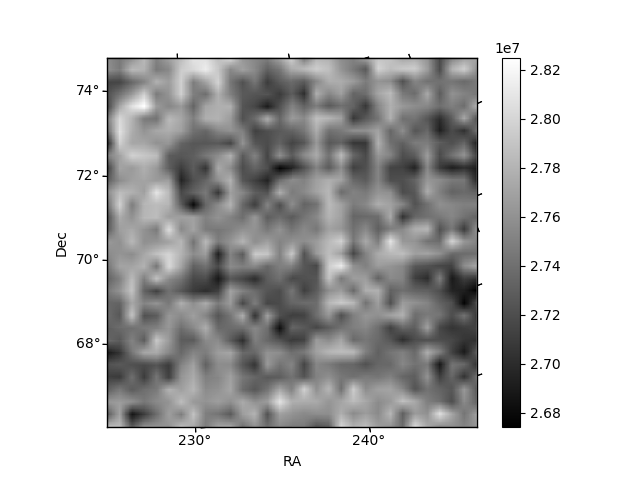
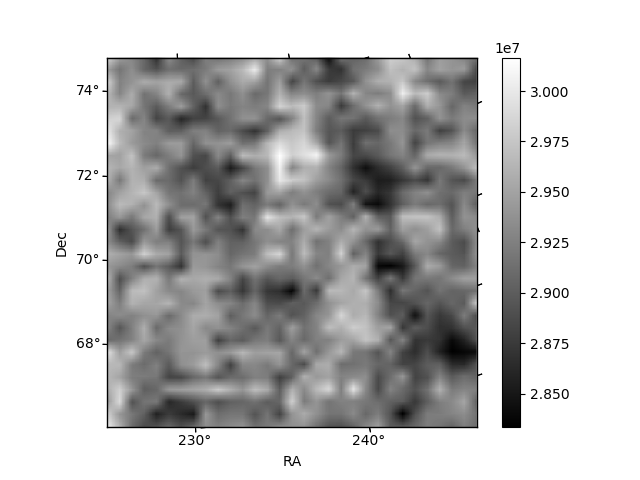
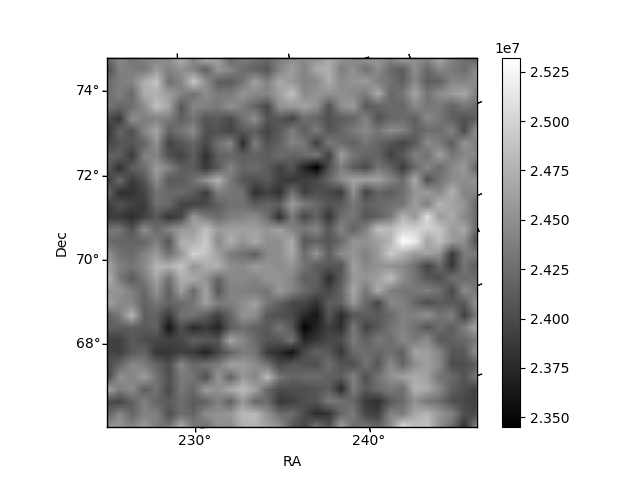
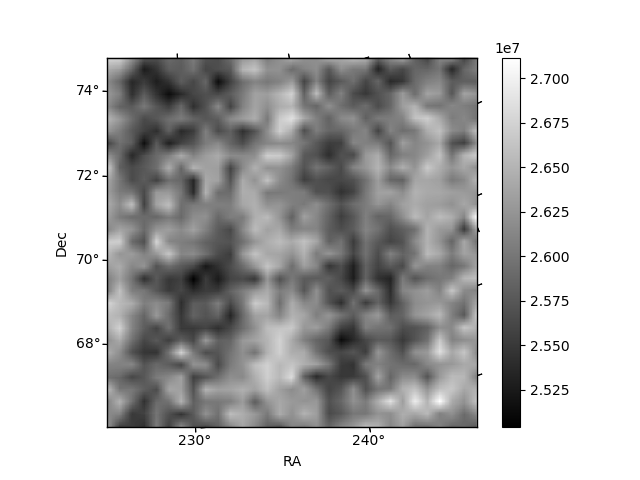
Histogram calculated using DETX and DETY for each event in the final _common_clean file
| Quadrant A | 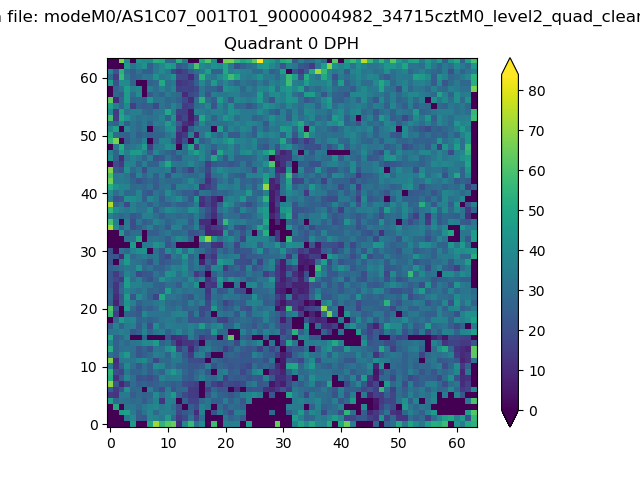 |
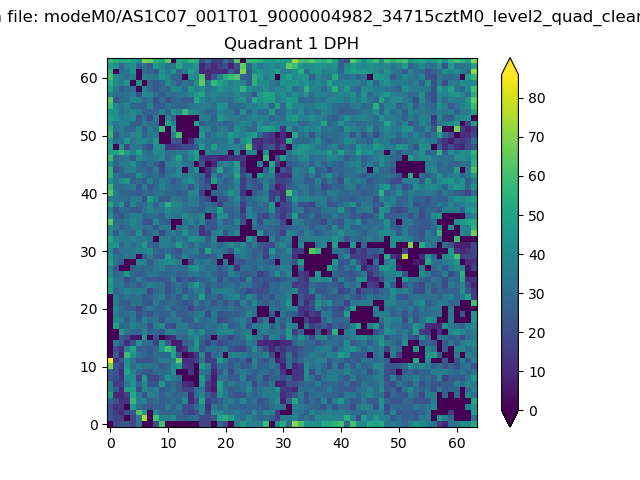 |
Quadrant B |
|---|---|---|---|
| Quadrant D | 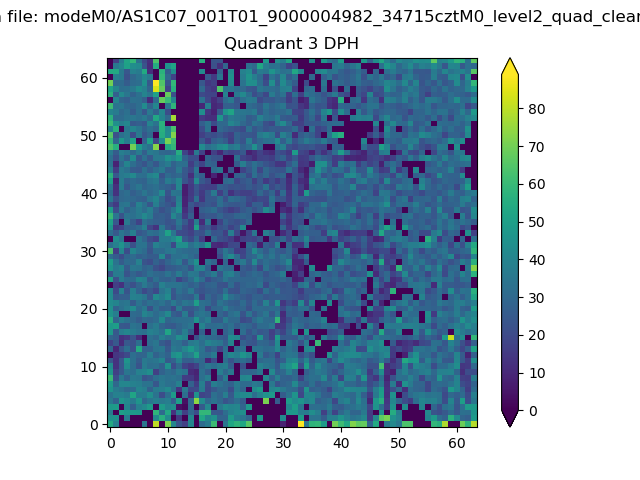 |
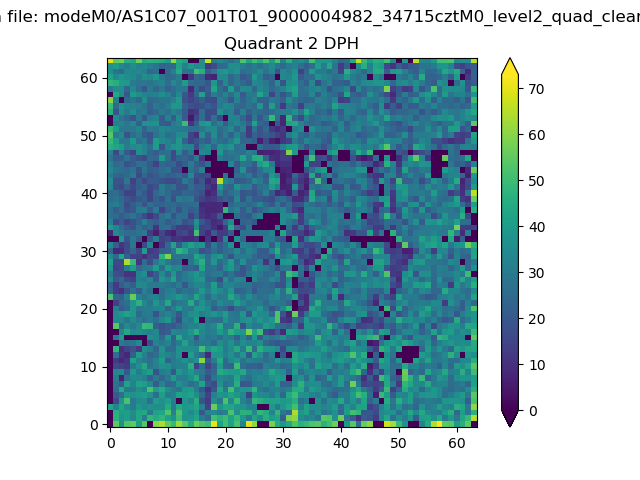 |
Quadrant C |
| Plot type | Count rate plots | Images |
|---|---|---|
| Comparison with Poisson distribution Blue bars denote a histogram of data divided into 1 sec bins. Red curve is a Poisson curve with rate = median count rate of data. |
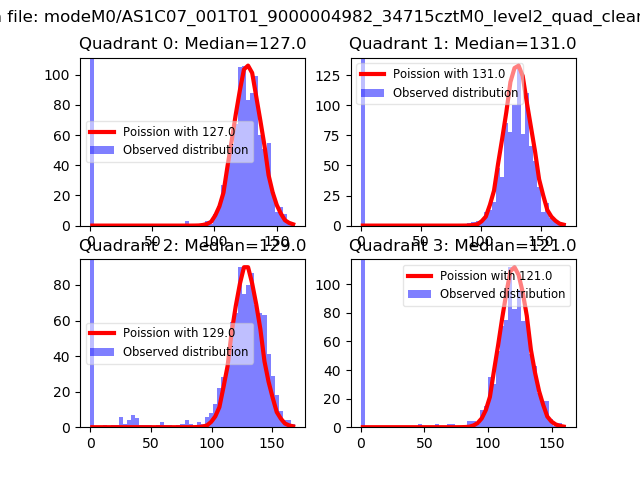 |
 |
| Quadrant-wise count rates Data is divided into 100 sec bins |
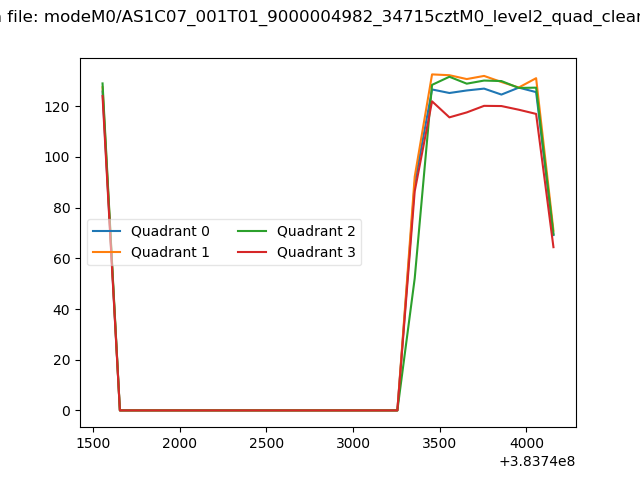 |
|
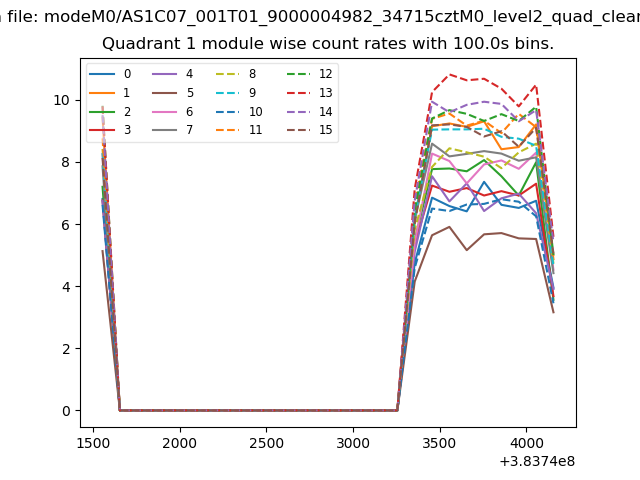
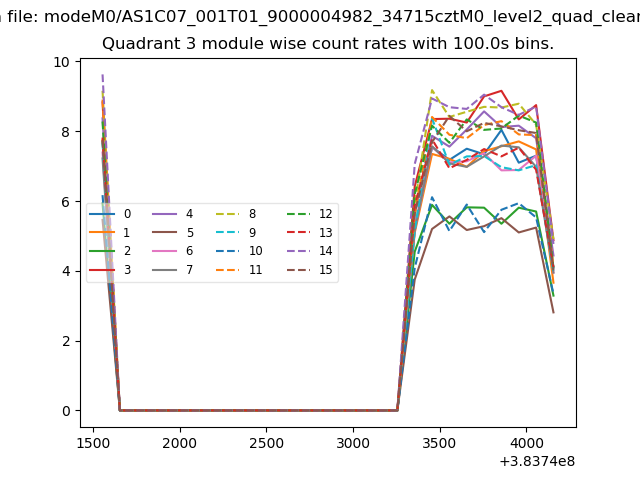
| Module-wise count rates for Quadrant A Data is divided into 100 sec bins |
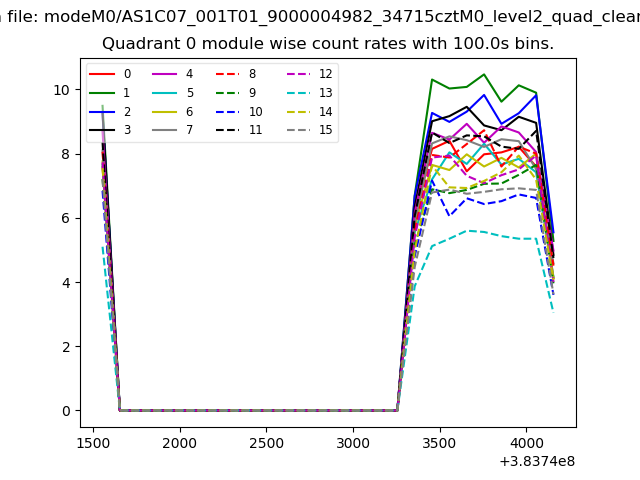 |
 |
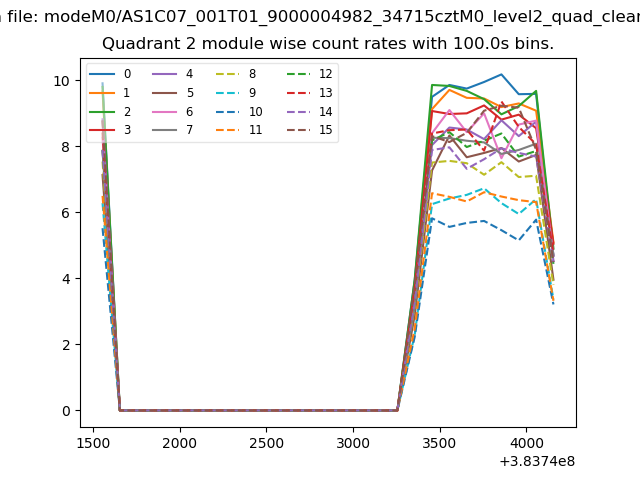
| Module-wise count rates for Quadrant B Data is divided into 100 sec bins |
 |
 |
| Module-wise count rates for Quadrant C Data is divided into 100 sec bins |
 |
 |
| Module-wise count rates for Quadrant D Data is divided into 100 sec bins |
 |
 |
| Parameter | Plot |
|---|---|
| CZT HV Monitor | 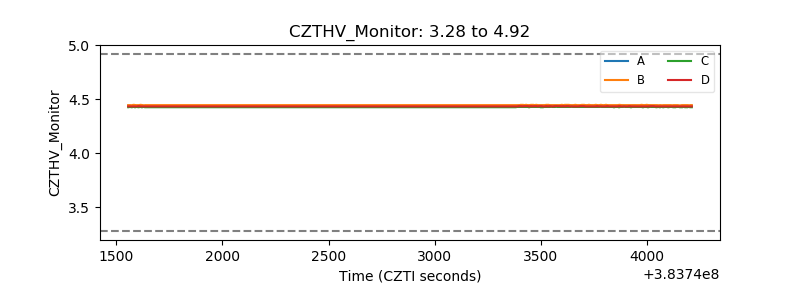 |
| D_VDD | 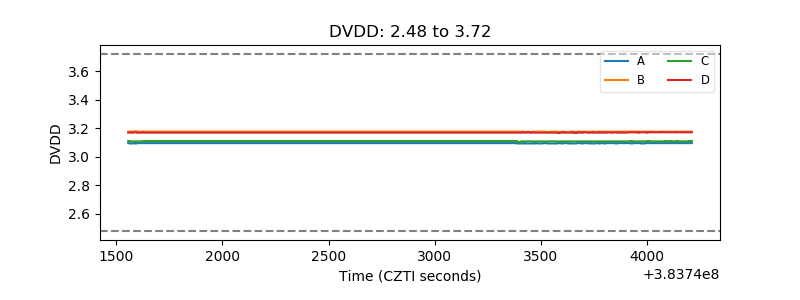 |
| Temperature 1 | 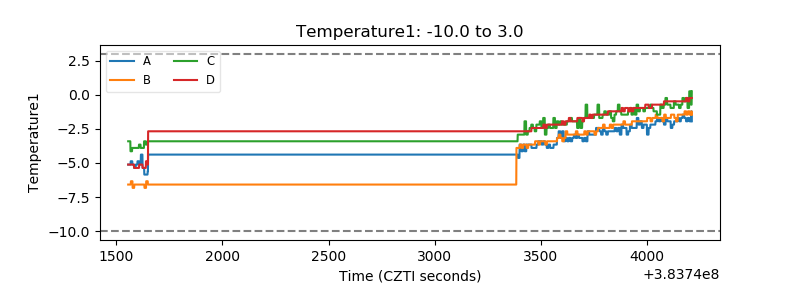 |
| Veto HV Monitor | 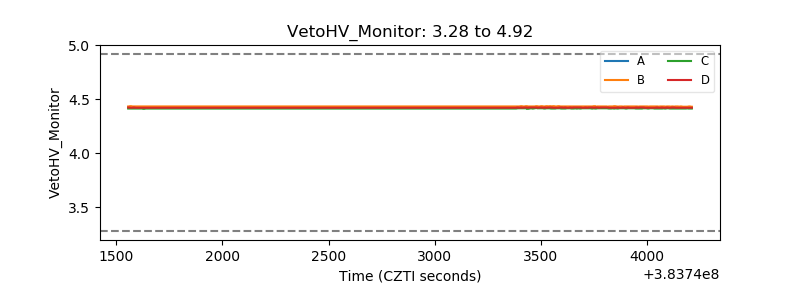 |
| Veto LLD | 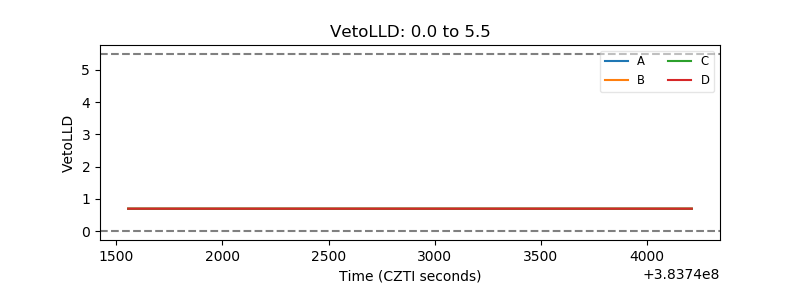 |
| Alpha Counter | 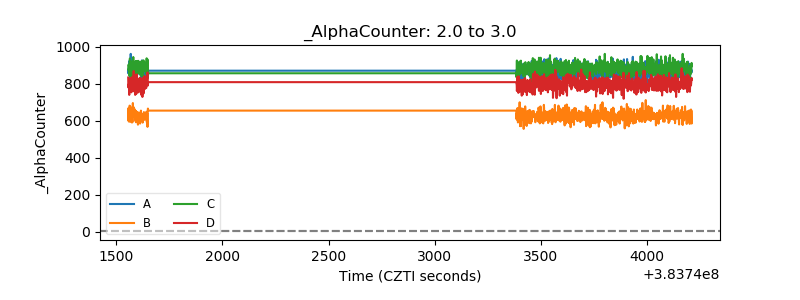 |
| _CPM_Rate | 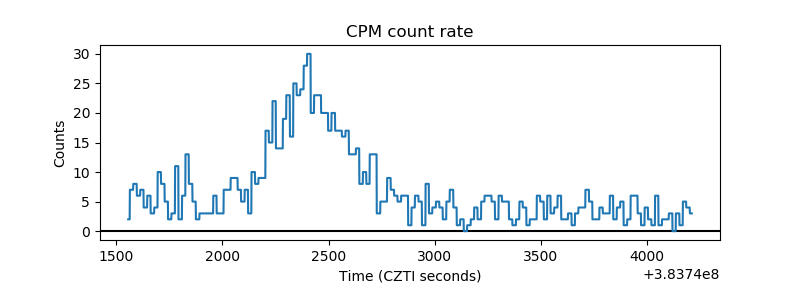 |
| CZT Counter | 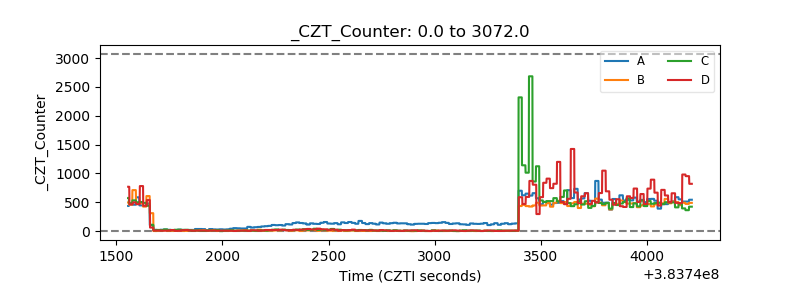 |
| +2.5 Volts monitor | 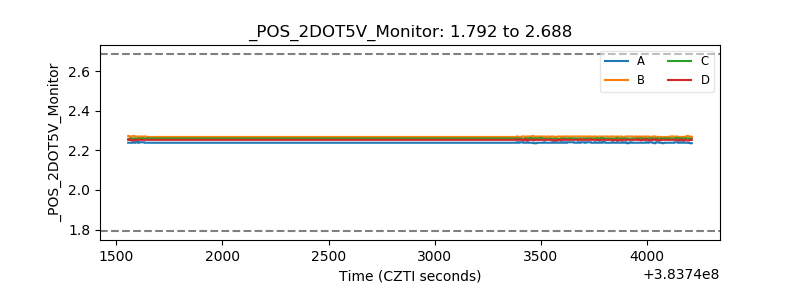 |
| +5 Volts monitor | 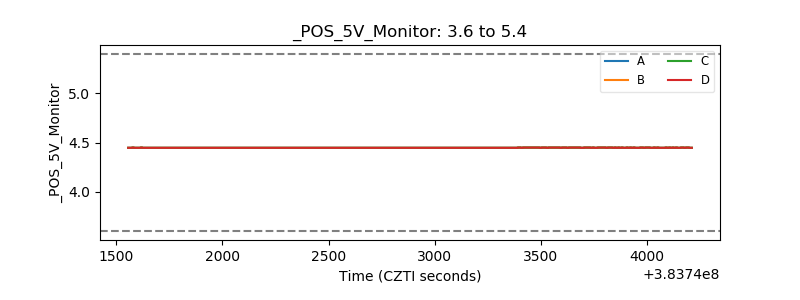 |
| _ROLL_ROT | 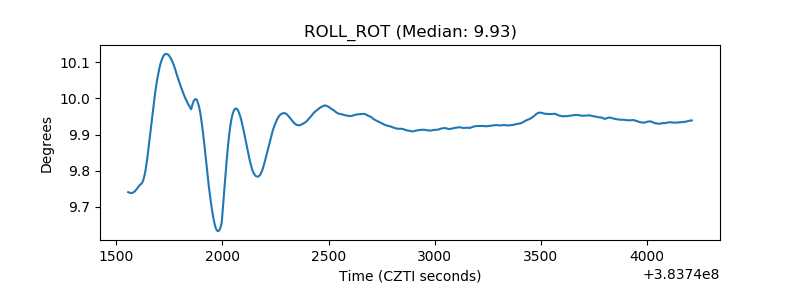 |
| _Roll_DEC | 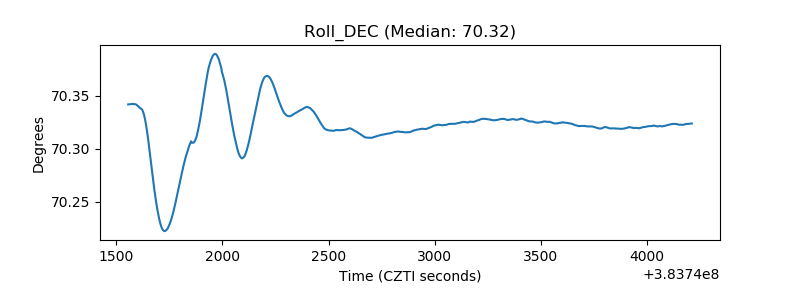 |
| _Roll_RA | 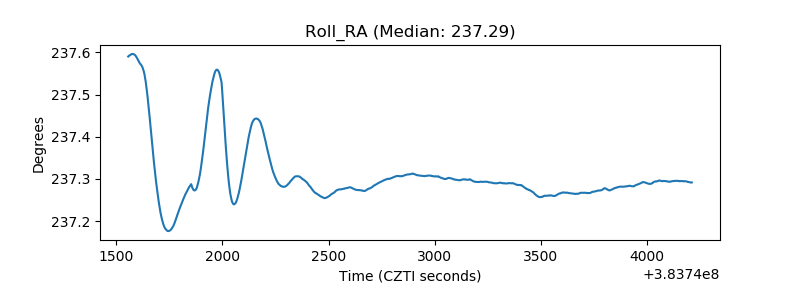 |
| Veto Counter | 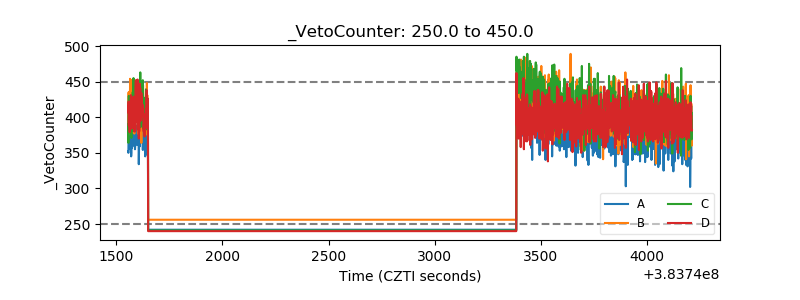 |