| Param | Original file | Final file |
|---|---|---|
| Filename | modeM0/AS1A09_038T41_9000004978_34713cztM0_level2.evt | modeM0/AS1A09_038T41_9000004978_34713cztM0_level2_quad_clean.evt |
| Size (bytes) | 469,800,000 | 106,488,000 |
| Size | 448.0 MB | 101.6 MB |
| Events in quadrant A | 3,605,968 | 724,080 |
| Events in quadrant B | 3,072,984 | 731,551 |
| Events in quadrant C | 2,763,143 | 737,928 |
| Events in quadrant D | 4,451,008 | 684,969 |
| Mode SS | |||
|---|---|---|---|
| Quadrant | BADHDUFLAG | Total packets | Discarded packets |
| A | 0 | 100 | 0 |
| B | 0 | 100 | 0 |
| C | 0 | 100 | 0 |
| D | 0 | 100 | 0 |
| Mode M9 | |||
|---|---|---|---|
| Quadrant | BADHDUFLAG | Total packets | Discarded packets |
| A | 0 | 29 | 0 |
| B | 0 | 29 | 0 |
| C | 0 | 29 | 0 |
| D | 0 | 30 | 0 |
| Mode M0 | |||
|---|---|---|---|
| Quadrant | BADHDUFLAG | Total packets | Discarded packets |
| A | 0 | 14150 | 3 |
| B | 0 | 12062 | 2 |
| C | 0 | 10925 | 2 |
| D | 0 | 16594 | 2 |
| Quadrant | Total seconds | Saturated seconds | Saturation percentage |
|---|---|---|---|
| A | 4944 | 30 | 0.606796% |
| B | 4944 | 152 | 3.074434% |
| C | 4944 | 39 | 0.788835% |
| D | 4944 | 149 | 3.013754% |
Noise dominated data is calculated using 1-second bins in cleaned event files. If a bin has >2000 counts, and if more than 50% of those come from <1% of pixels, then it is considered to be noise-dominated and hence unusable.
| Quadrant | # 1 sec bins | Bins with >0 counts | Bins with >2000 counts | High rate bins dominated by noise | Noise dominated (total time) | Noise dominated (detector-on time) | Marked lightcurve |
|---|---|---|---|---|---|---|---|
| A | 7068 | 4945 | 17 | 17 | 0.24% | 0.34% | 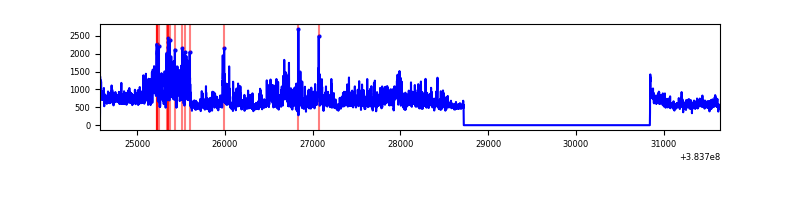 |
| B | 7068 | 4945 | 111 | 111 | 1.57% | 2.24% | 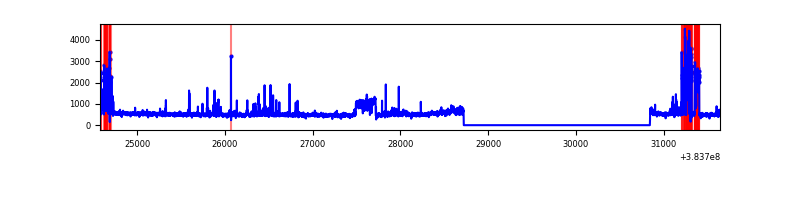 |
| C | 7068 | 4945 | 34 | 34 | 0.48% | 0.69% | 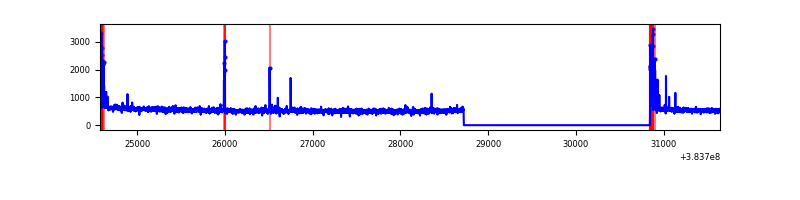 |
| D | 7068 | 4945 | 146 | 146 | 2.07% | 2.95% | 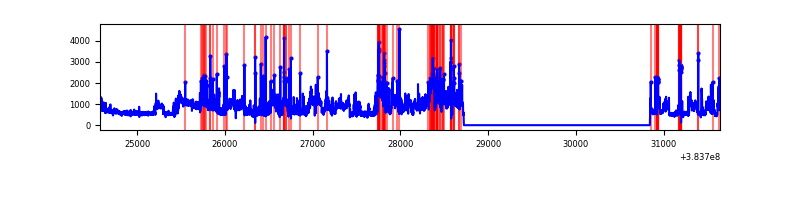 |
Top three noisy pixels from each quadrant. If the there are fewer than three noisy pixels in the level2.evt file, extra rows are filled as -1
| Pixel properties | Quadrant properties | ||||||
|---|---|---|---|---|---|---|---|
| Quadrant | DetID | PixID | Counts | Sigma | Mean | Median | Sigma |
| A | 15 | 169 | 1114139 | 9069.49 | 620 | 612 | 122.8 |
| A | 10 | 83 | 48810 | 392.56 | 620 | 612 | 122.8 |
| A | 9 | 143 | 15969 | 125.08 | 620 | 612 | 122.8 |
| B | 5 | 172 | 383531 | 3421.46 | 608 | 596 | 111.9 |
| B | 0 | 182 | 171961 | 1531.12 | 608 | 596 | 111.9 |
| B | 0 | 155 | 57921 | 512.19 | 608 | 596 | 111.9 |
| C | 15 | 214 | 216473 | 1571.75 | 605 | 610 | 137.3 |
| C | 0 | 10 | 125793 | 911.49 | 605 | 610 | 137.3 |
| C | 15 | 159 | 28375 | 202.16 | 605 | 610 | 137.3 |
| D | 8 | 195 | 1139843 | 7380.2 | 597 | 583 | 154.4 |
| D | 12 | 227 | 267049 | 1726.18 | 597 | 583 | 154.4 |
| D | 2 | 250 | 161880 | 1044.89 | 597 | 583 | 154.4 |
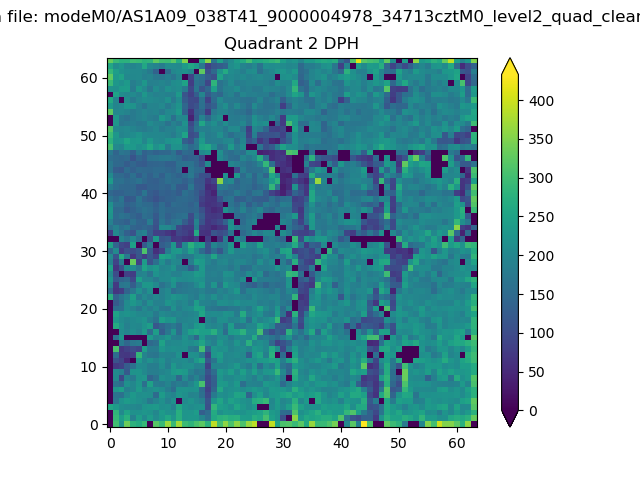
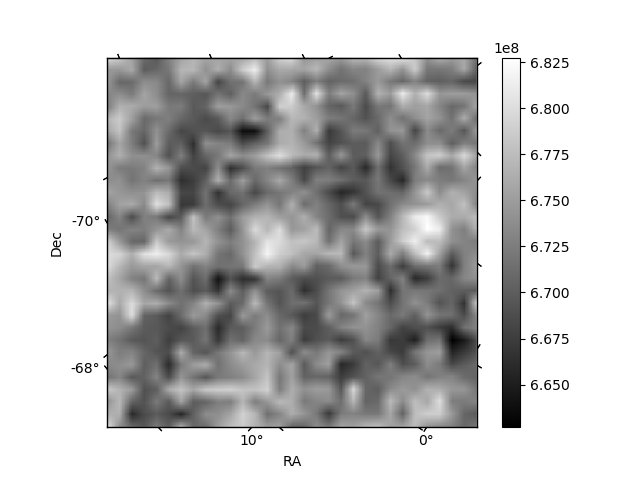
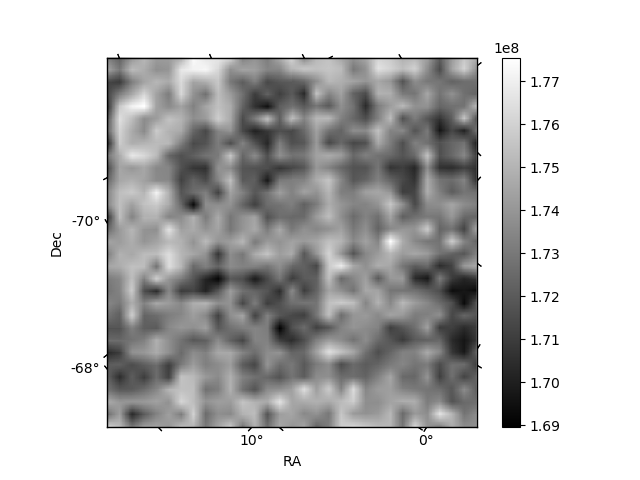
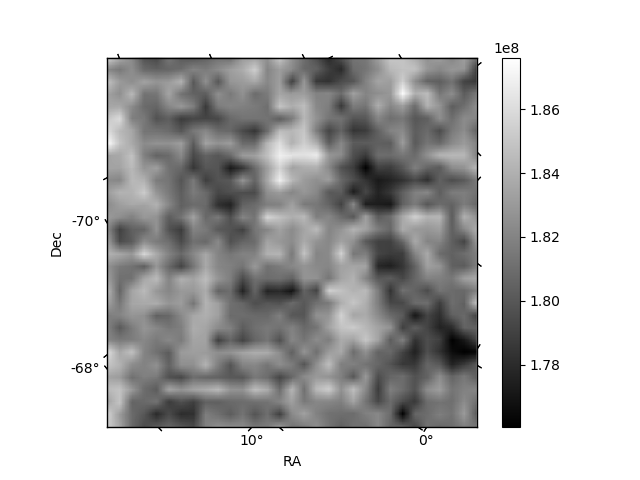
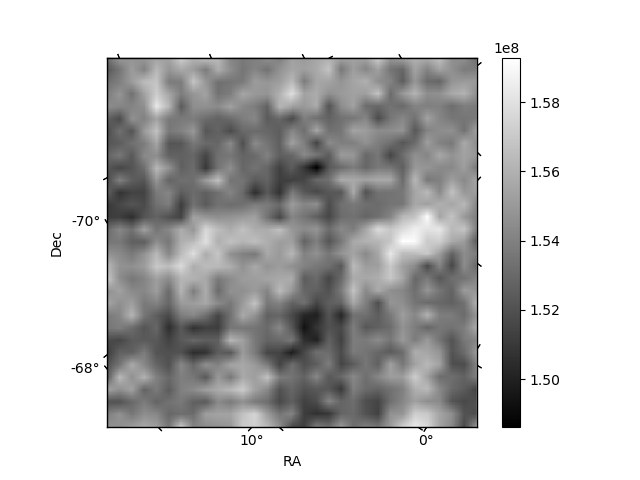
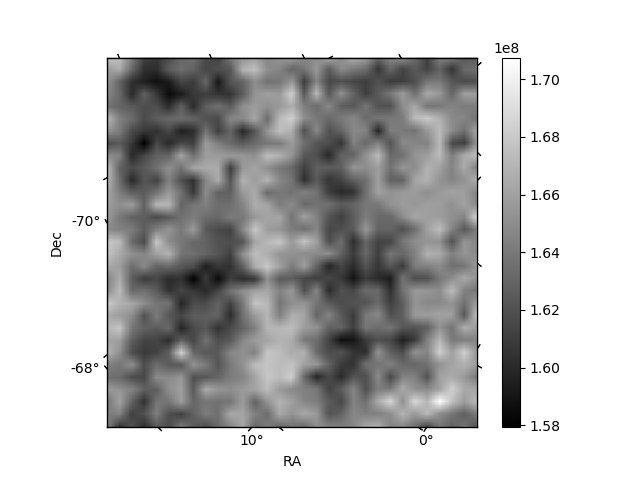
Histogram calculated using DETX and DETY for each event in the final _common_clean file
| Quadrant A | 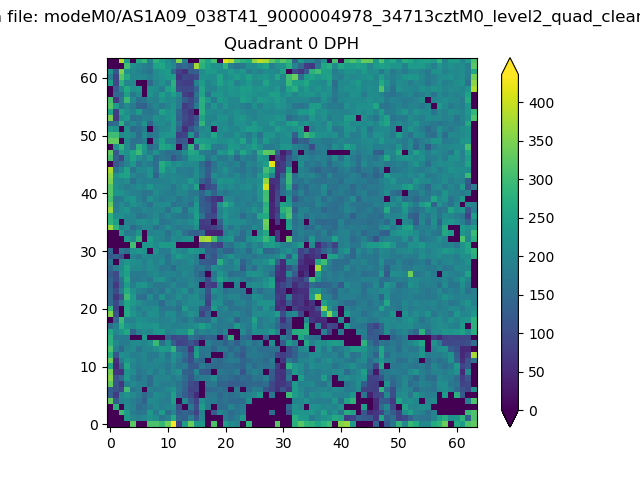 |
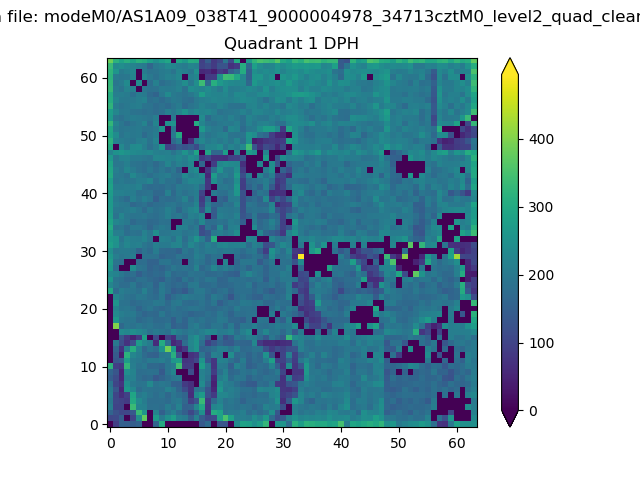 |
Quadrant B |
|---|---|---|---|
| Quadrant D | 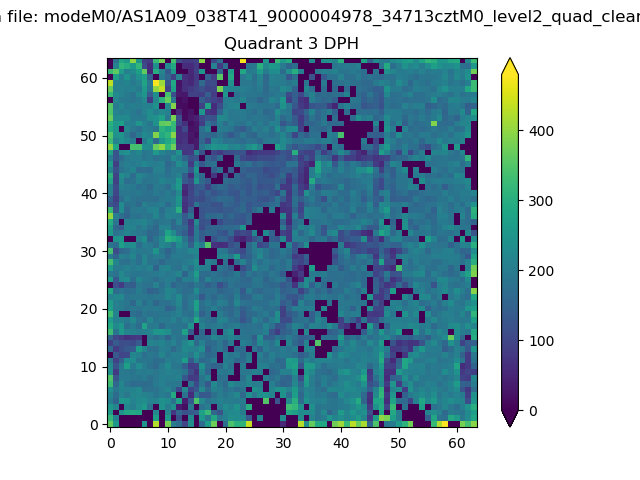 |
 |
Quadrant C |
| Plot type | Count rate plots | Images |
|---|---|---|
| Comparison with Poisson distribution Blue bars denote a histogram of data divided into 1 sec bins. Red curve is a Poisson curve with rate = median count rate of data. |
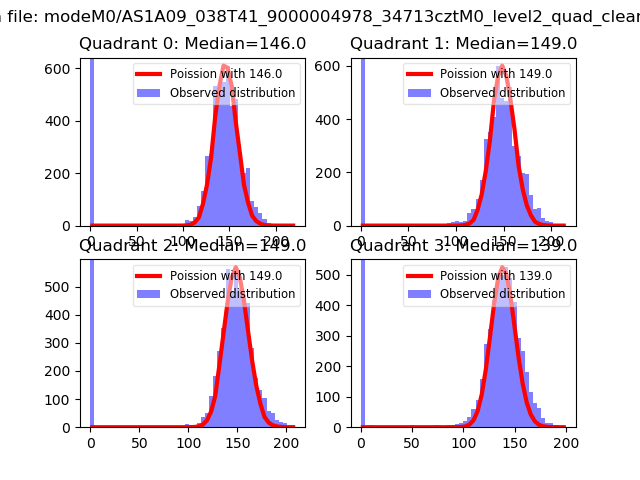 |
 |
| Quadrant-wise count rates Data is divided into 100 sec bins |
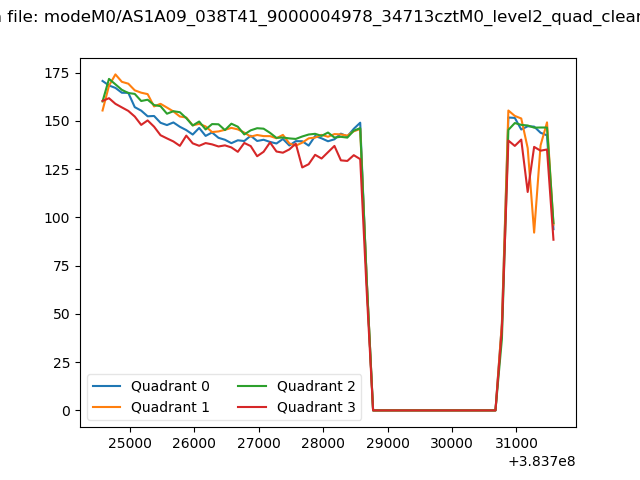 |
|
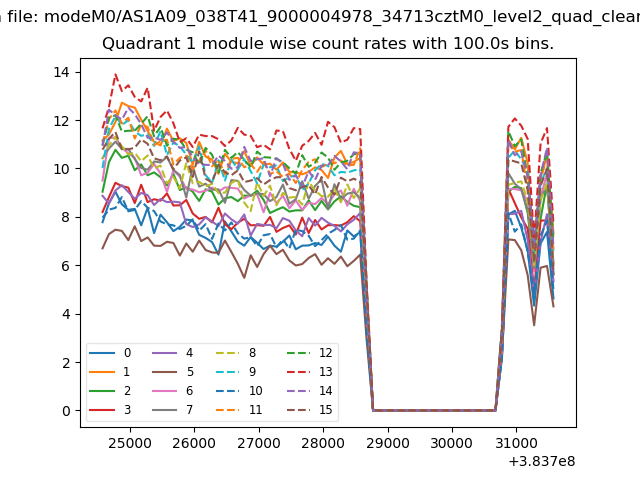
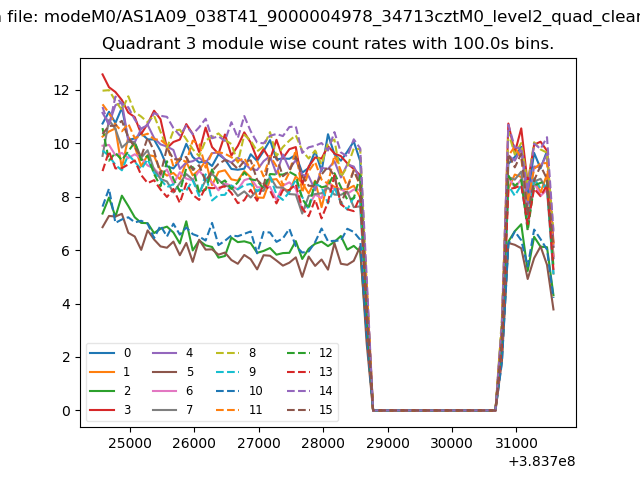
| Module-wise count rates for Quadrant A Data is divided into 100 sec bins |
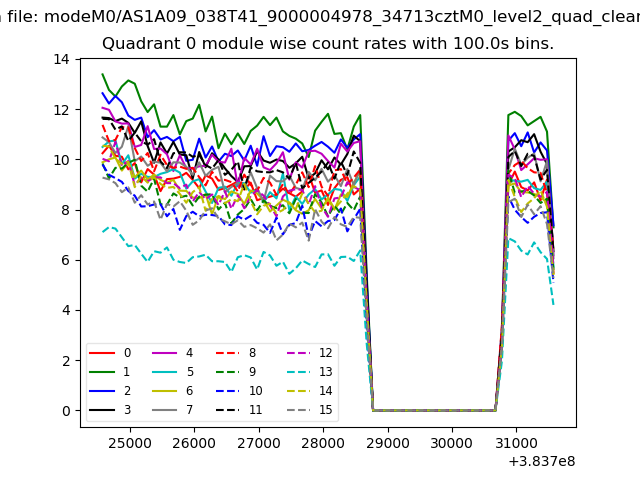 |
 |
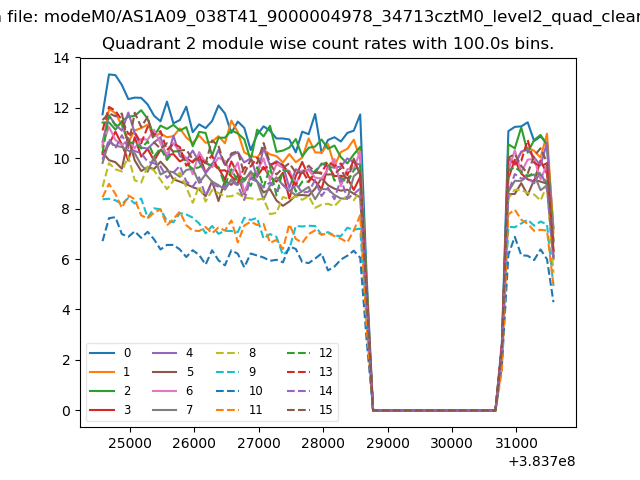
| Module-wise count rates for Quadrant B Data is divided into 100 sec bins |
 |
 |
| Module-wise count rates for Quadrant C Data is divided into 100 sec bins |
 |
 |
| Module-wise count rates for Quadrant D Data is divided into 100 sec bins |
 |
 |
| Parameter | Plot |
|---|---|
| CZT HV Monitor | 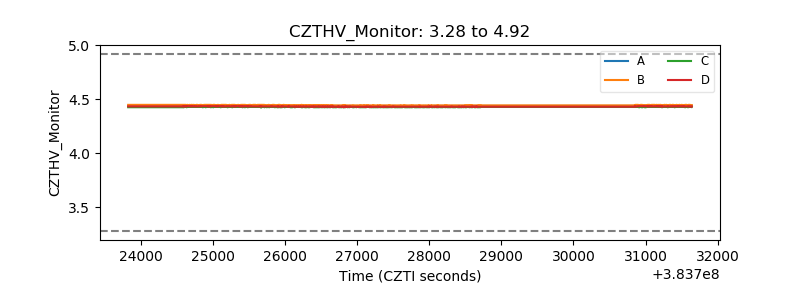 |
| D_VDD | 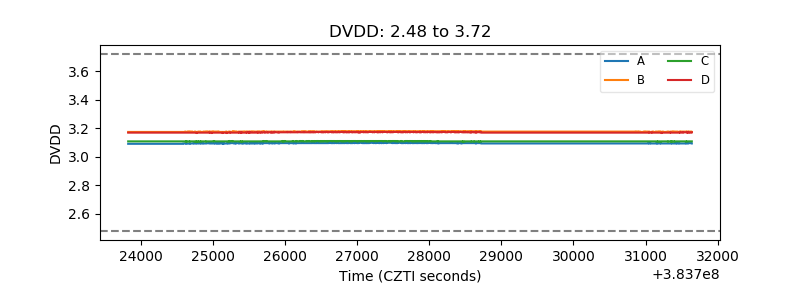 |
| Temperature 1 | 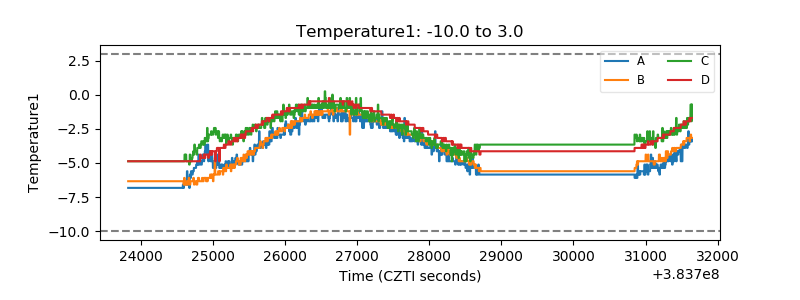 |
| Veto HV Monitor | 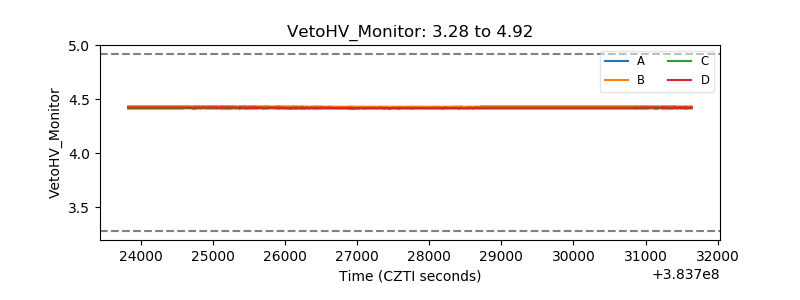 |
| Veto LLD | 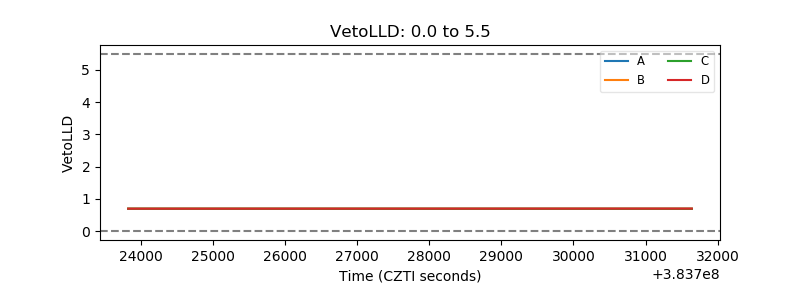 |
| Alpha Counter | 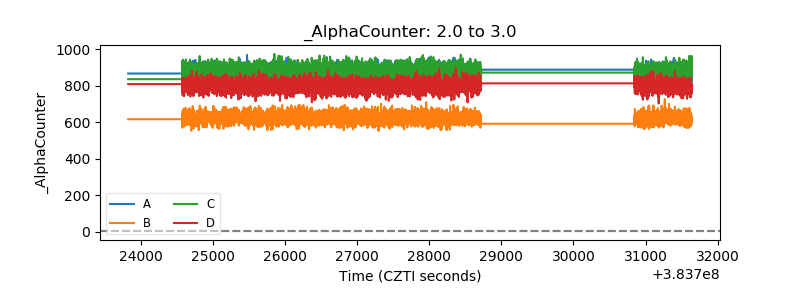 |
| _CPM_Rate | 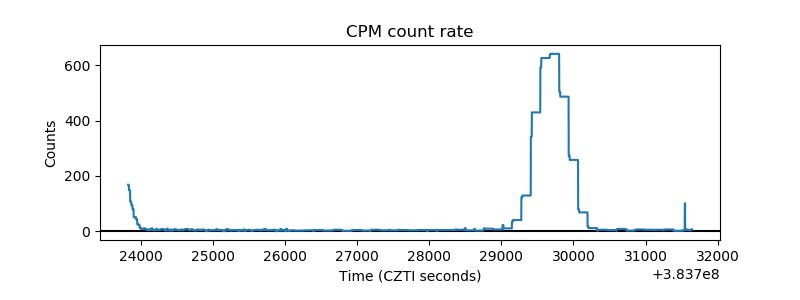 |
| CZT Counter | 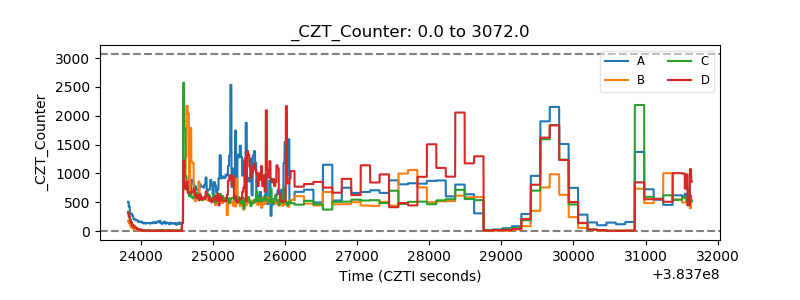 |
| +2.5 Volts monitor | 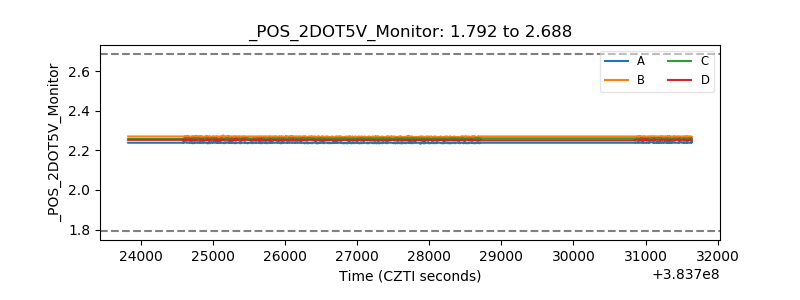 |
| +5 Volts monitor | 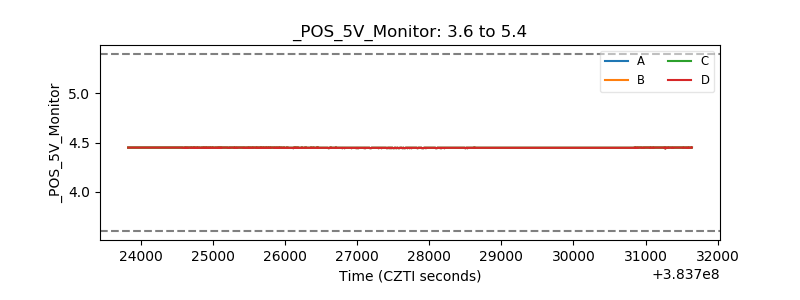 |
| _ROLL_ROT | 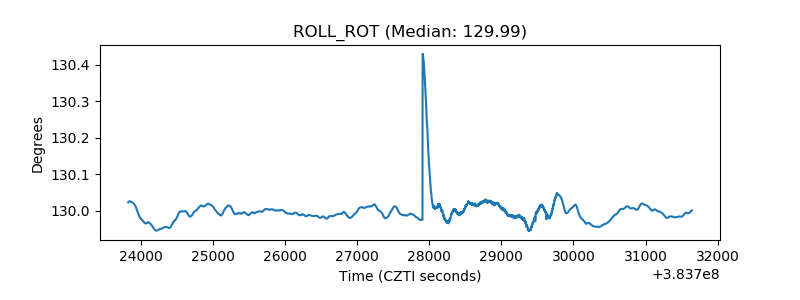 |
| _Roll_DEC | 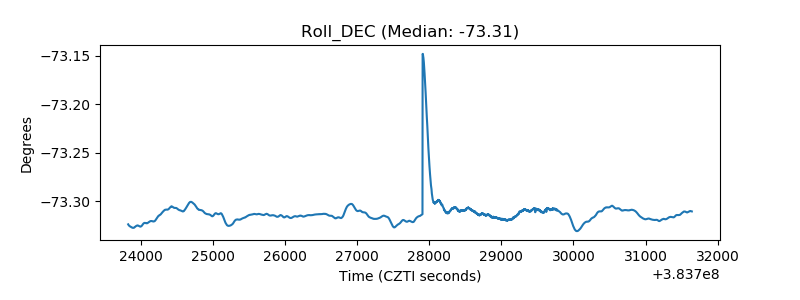 |
| _Roll_RA | 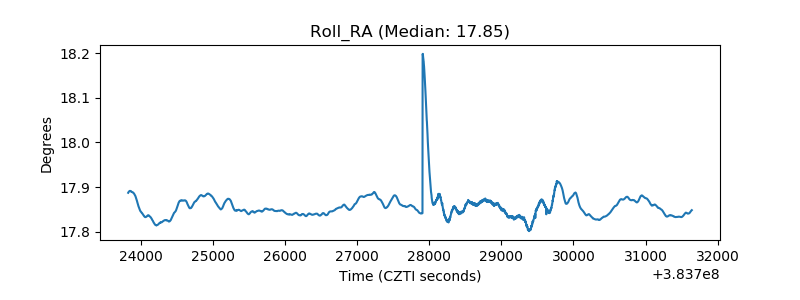 |
| Veto Counter | 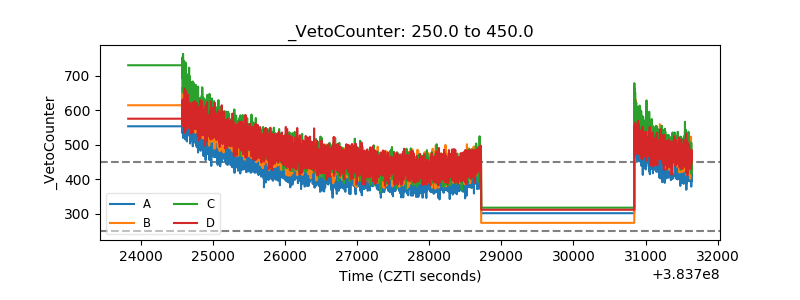 |