| Param | Original file | Final file |
|---|---|---|
| Filename | modeM0/AS1A09_038T30_9000004974cztM0_level2_bc.evt | modeM0/AS1A09_038T30_9000004974cztM0_level2_quad_clean.evt |
| Size (bytes) | 183,672,000 | 69,482,880 |
| Size | 175.2 MB | 66.3 MB |
| Events in quadrant A | 1,226,934 | 439,156 |
| Events in quadrant B | 1,054,006 | 484,618 |
| Events in quadrant C | 931,433 | 474,381 |
| Events in quadrant D | 2,084,254 | 438,128 |
| Mode SS | |||
|---|---|---|---|
| Quadrant | BADHDUFLAG | Total packets | Discarded packets |
| A | 0 | 78 | 0 |
| B | 0 | 78 | 0 |
| C | 0 | 78 | 0 |
| D | 0 | 78 | 0 |
| Mode M0 | |||
|---|---|---|---|
| Quadrant | BADHDUFLAG | Total packets | Discarded packets |
| A | 0 | 11566 | 0 |
| B | 0 | 8738 | 0 |
| C | 0 | 7778 | 0 |
| D | 0 | 12112 | 0 |
| Mode M9 | |||
|---|---|---|---|
| Quadrant | BADHDUFLAG | Total packets | Discarded packets |
| A | 0 | 16 | 0 |
| B | 0 | 16 | 0 |
| C | 0 | 16 | 0 |
| D | 0 | 16 | 0 |
| Quadrant | Total seconds | Saturated seconds | Saturation percentage |
|---|---|---|---|
| A | 3787 | 504 | 13.308688% |
| B | 3787 | 42 | 1.109057% |
| C | 3787 | 12 | 0.316874% |
| D | 3787 | 228 | 6.020597% |
Noise dominated data is calculated using 1-second bins in cleaned event files. If a bin has >2000 counts, and if more than 50% of those come from <1% of pixels, then it is considered to be noise-dominated and hence unusable.
| Quadrant | # 1 sec bins | Bins with >0 counts | Bins with >2000 counts | High rate bins dominated by noise | Noise dominated (total time) | Noise dominated (detector-on time) | Marked lightcurve |
|---|---|---|---|---|---|---|---|
| A | 5341 | 3786 | 0 | 0 | 0.00% | 0.00% | 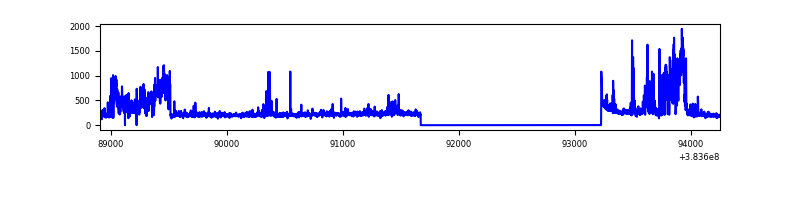 |
| B | 5341 | 3787 | 6 | 6 | 0.11% | 0.16% | 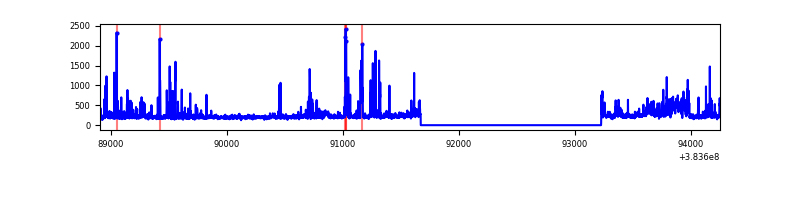 |
| C | 5341 | 3787 | 0 | 0 | 0.00% | 0.00% | 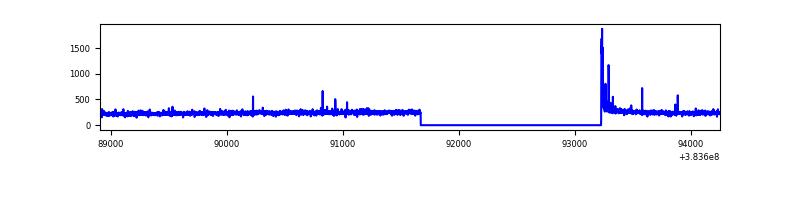 |
| D | 5341 | 3786 | 49 | 49 | 0.92% | 1.29% | 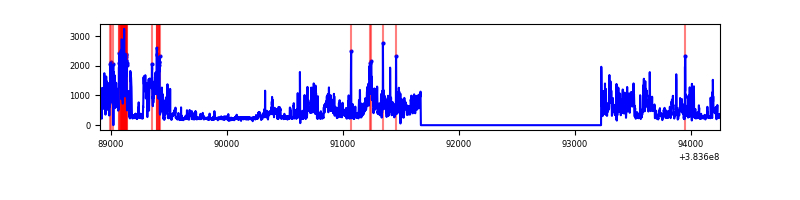 |
Top three noisy pixels from each quadrant. If the there are fewer than three noisy pixels in the level2.evt file, extra rows are filled as -1
| Pixel properties | Quadrant properties | ||||||
|---|---|---|---|---|---|---|---|
| Quadrant | DetID | PixID | Counts | Sigma | Mean | Median | Sigma |
| A | 15 | 169 | 246703 | 5953.61 | 176 | 173 | 41.4 |
| A | 15 | 174 | 229787 | 5545.1 | 176 | 173 | 41.4 |
| A | 10 | 83 | 25466 | 610.82 | 176 | 173 | 41.4 |
| B | 4 | 232 | 77163 | 1866.36 | 193 | 189 | 41.2 |
| B | 5 | 172 | 74549 | 1802.98 | 193 | 189 | 41.2 |
| B | 5 | 255 | 54244 | 1310.65 | 193 | 189 | 41.2 |
| C | 15 | 214 | 152430 | 3373.66 | 188 | 185 | 45.1 |
| C | 0 | 10 | 26017 | 572.42 | 188 | 185 | 45.1 |
| C | 14 | 67 | 10460 | 227.69 | 188 | 185 | 45.1 |
| D | 8 | 195 | 637786 | 12698.99 | 181 | 176 | 50.2 |
| D | 13 | 249 | 320221 | 6374.19 | 181 | 176 | 50.2 |
| D | 2 | 250 | 145680 | 2897.94 | 181 | 176 | 50.2 |
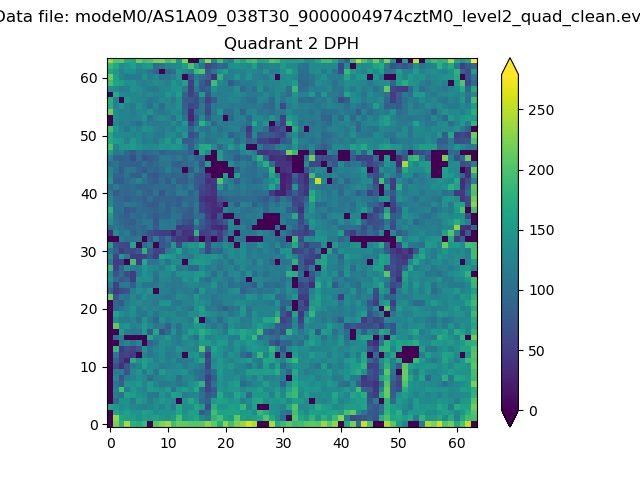
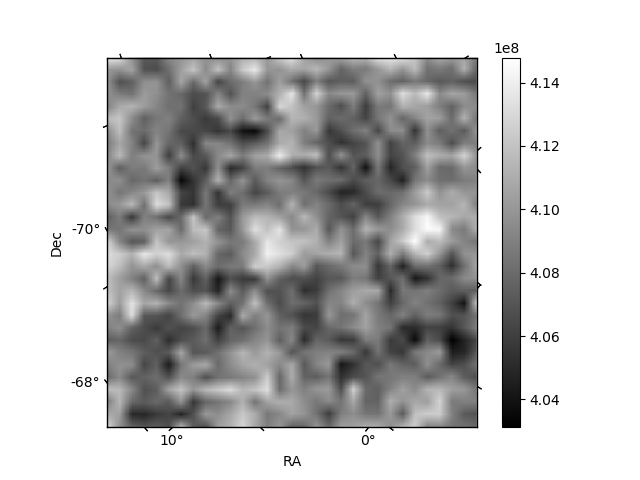
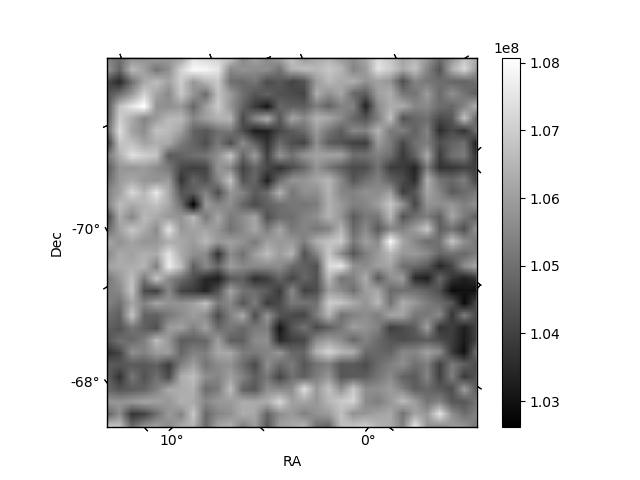
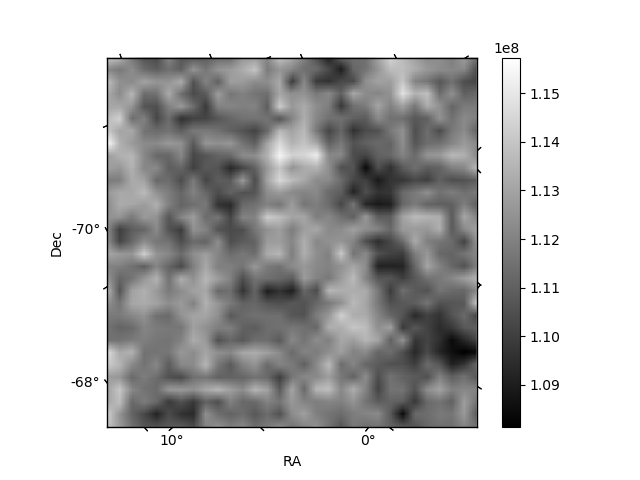
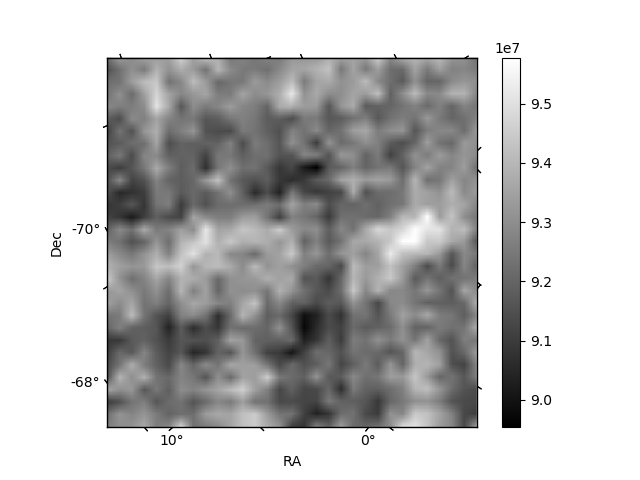
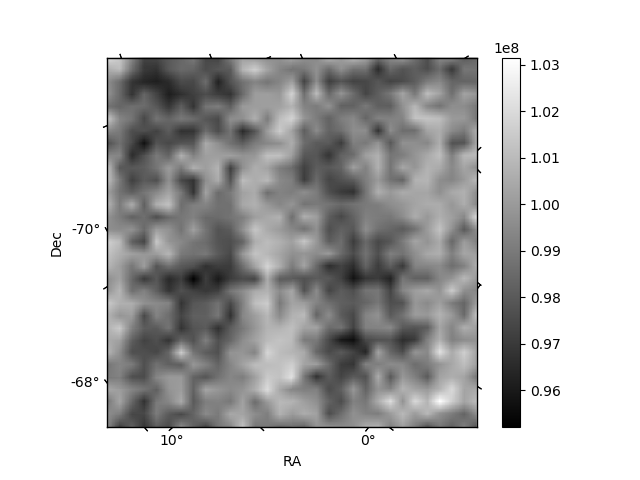
Histogram calculated using DETX and DETY for each event in the final _common_clean file
| Quadrant A | 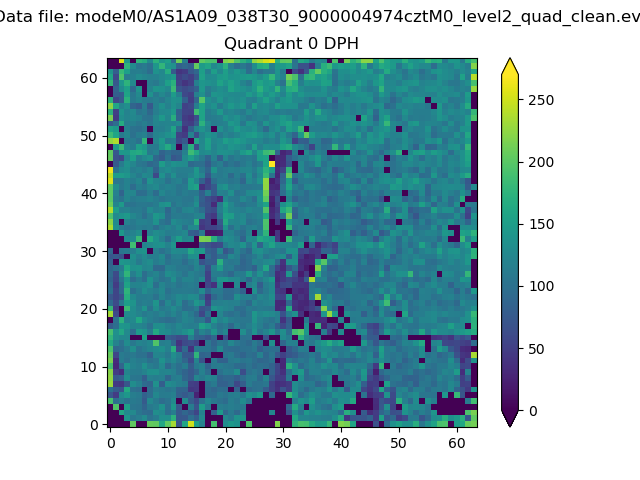 |
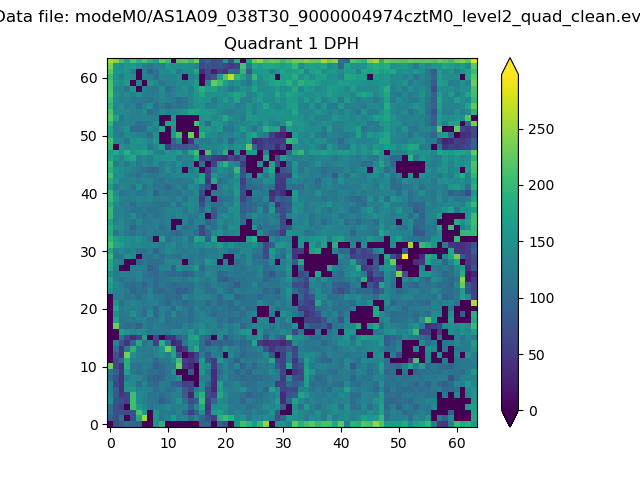 |
Quadrant B |
|---|---|---|---|
| Quadrant D | 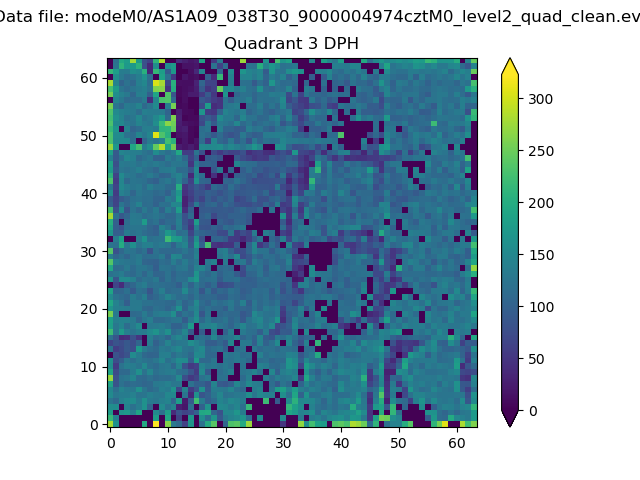 |
 |
Quadrant C |
| Plot type | Count rate plots | Images |
|---|---|---|
| Comparison with Poisson distribution Blue bars denote a histogram of data divided into 1 sec bins. Red curve is a Poisson curve with rate = median count rate of data. |
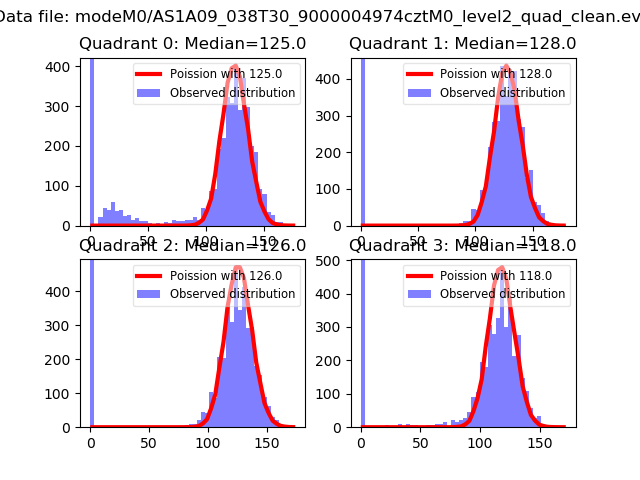 |
 |
| Quadrant-wise count rates Data is divided into 100 sec bins |
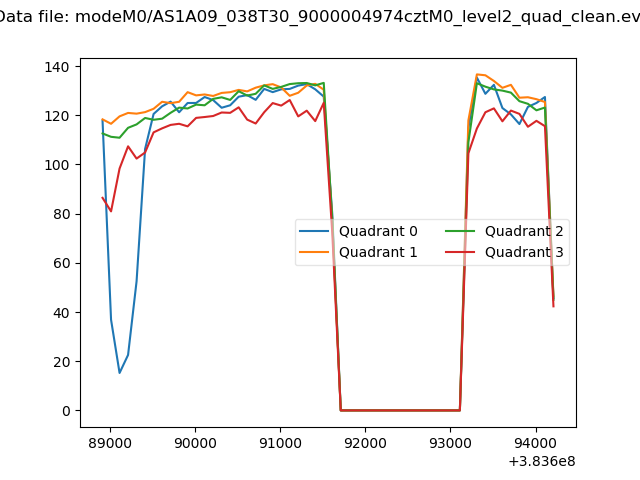 |
|
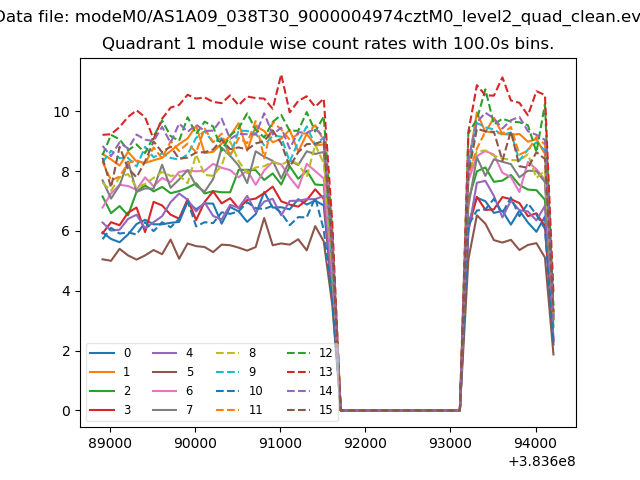
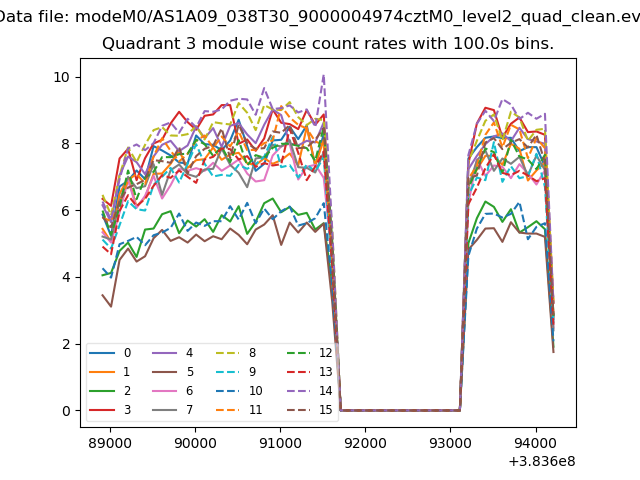
| Module-wise count rates for Quadrant A Data is divided into 100 sec bins |
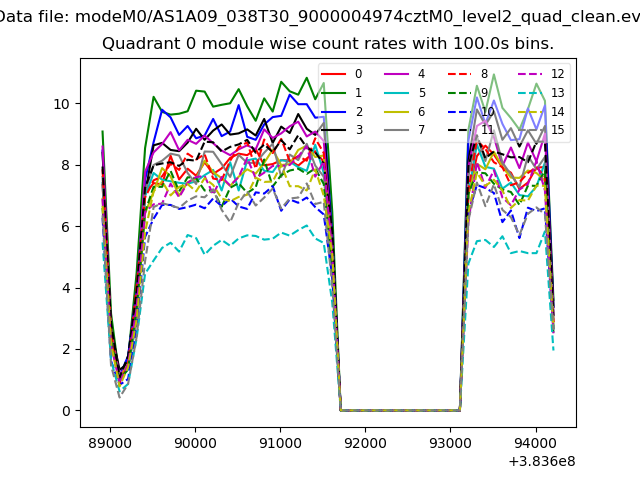 |
 |
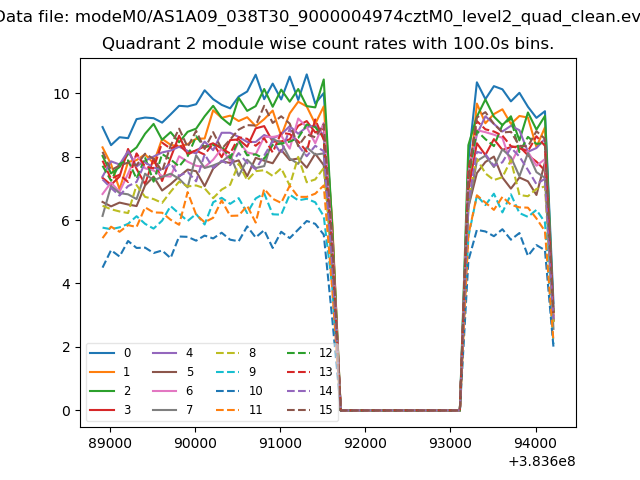
| Module-wise count rates for Quadrant B Data is divided into 100 sec bins |
 |
 |
| Module-wise count rates for Quadrant C Data is divided into 100 sec bins |
 |
 |
| Module-wise count rates for Quadrant D Data is divided into 100 sec bins |
 |
 |
| Parameter | Plot |
|---|---|
| CZT HV Monitor | 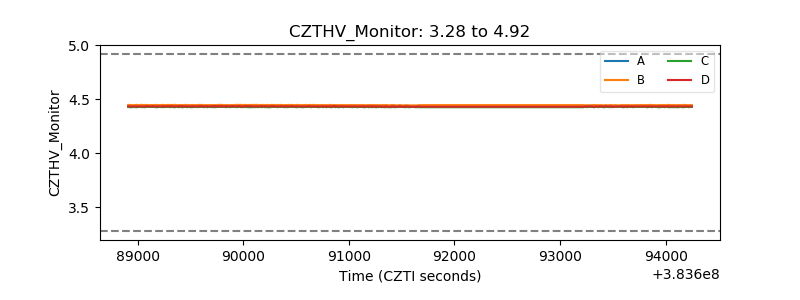 |
| D_VDD | 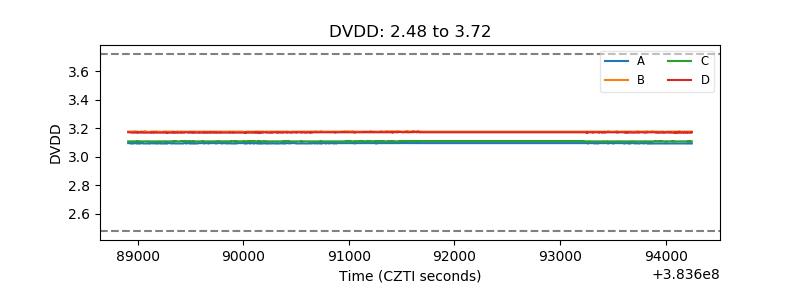 |
| Temperature 1 | 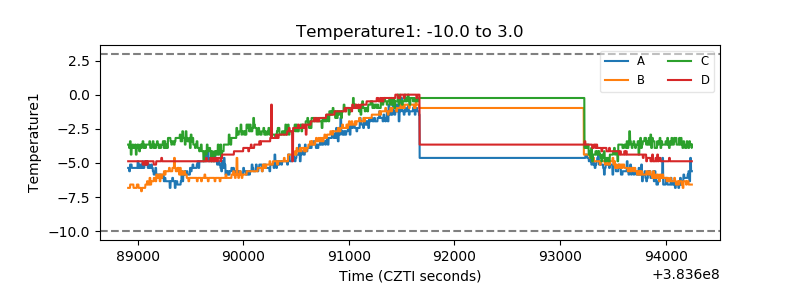 |
| Veto HV Monitor | 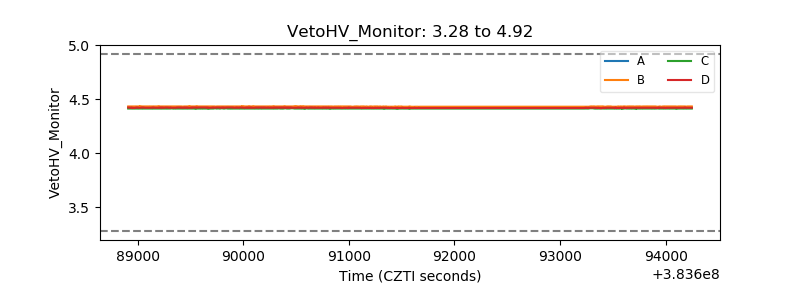 |
| Veto LLD | 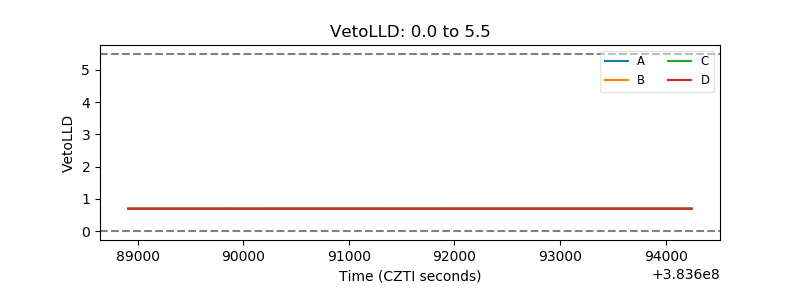 |
| Alpha Counter | 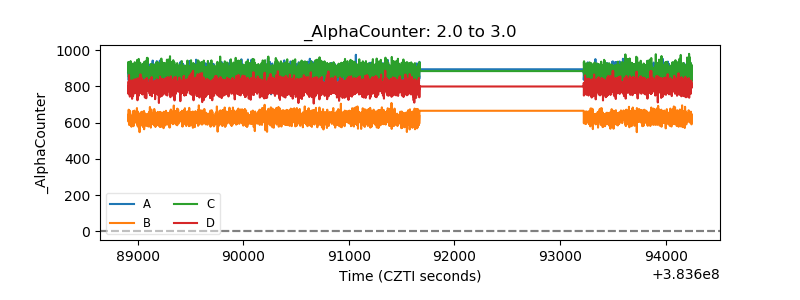 |
| _CPM_Rate | 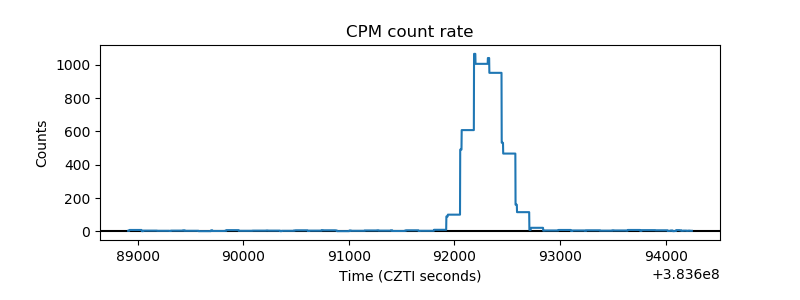 |
| CZT Counter | 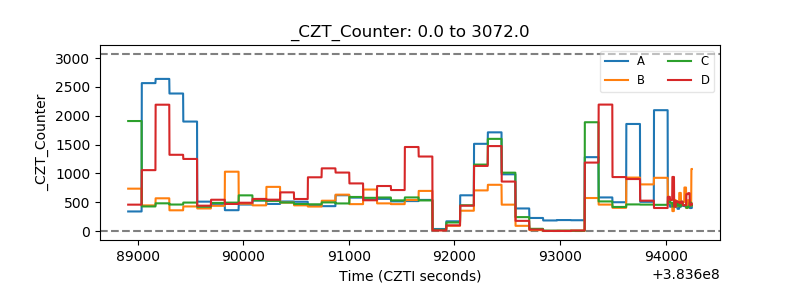 |
| +2.5 Volts monitor | 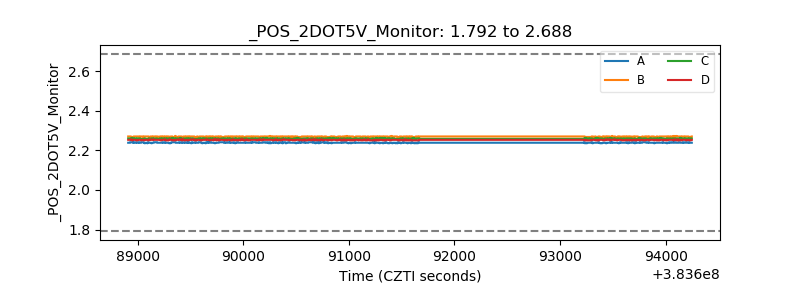 |
| +5 Volts monitor | 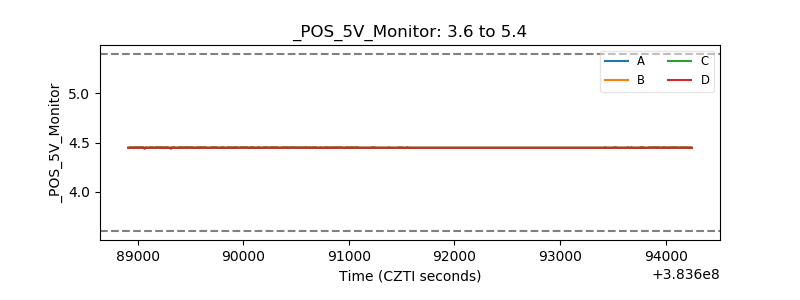 |
| _ROLL_ROT | 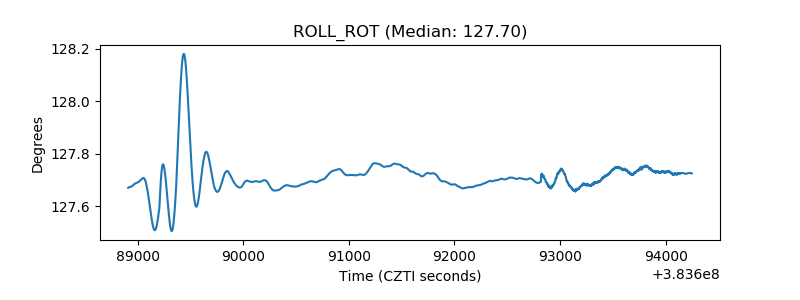 |
| _Roll_DEC | 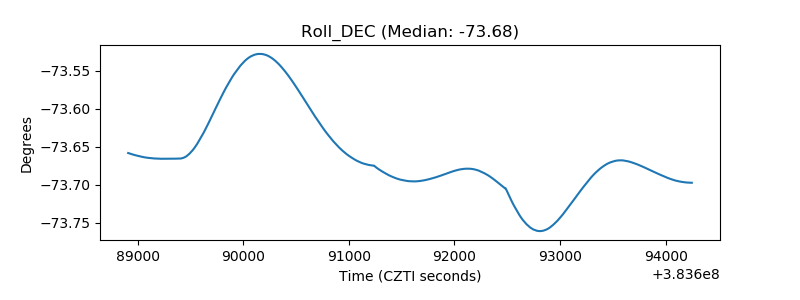 |
| _Roll_RA | 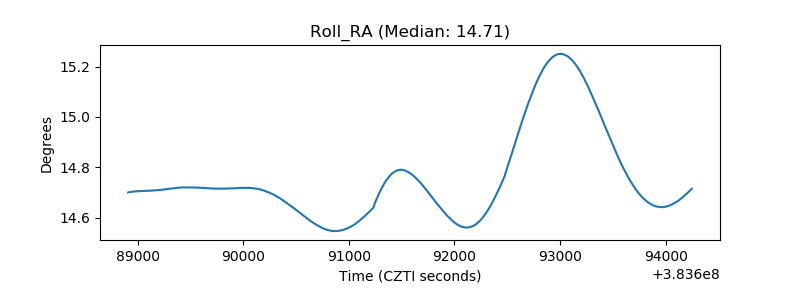 |
| Veto Counter | 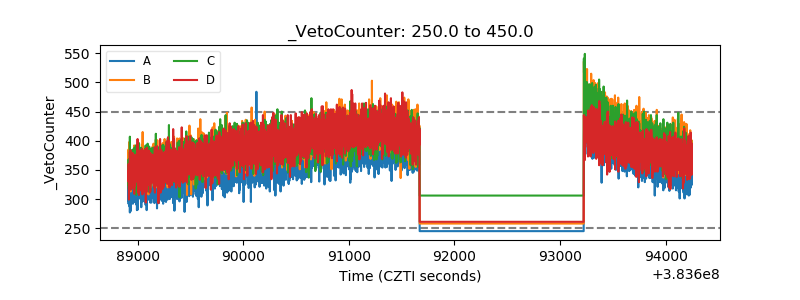 |