| Param | Original file | Final file |
|---|---|---|
| Filename | modeM0/AS1A07_138T08_9000004970_34701cztM0_level2.evt | modeM0/AS1A07_138T08_9000004970_34701cztM0_level2_quad_clean.evt |
| Size (bytes) | 365,569,920 | 43,202,880 |
| Size | 348.6 MB | 41.2 MB |
| Events in quadrant A | 1,949,485 | 260,244 |
| Events in quadrant B | 2,212,777 | 262,283 |
| Events in quadrant C | 1,991,480 | 260,857 |
| Events in quadrant D | 4,645,572 | 242,215 |
| Mode M0 | |||
|---|---|---|---|
| Quadrant | BADHDUFLAG | Total packets | Discarded packets |
| A | 0 | 8294 | 1 |
| B | 0 | 9109 | 1 |
| C | 0 | 8222 | 1 |
| D | 0 | 16581 | 1 |
| Mode M9 | |||
|---|---|---|---|
| Quadrant | BADHDUFLAG | Total packets | Discarded packets |
| A | 0 | 6 | 0 |
| B | 0 | 6 | 0 |
| C | 0 | 6 | 0 |
| D | 0 | 7 | 0 |
| Mode SS | |||
|---|---|---|---|
| Quadrant | BADHDUFLAG | Total packets | Discarded packets |
| A | 0 | 80 | 0 |
| B | 0 | 80 | 0 |
| C | 0 | 80 | 0 |
| D | 0 | 80 | 0 |
| Quadrant | Total seconds | Saturated seconds | Saturation percentage |
|---|---|---|---|
| A | 3999 | 11 | 0.275069% |
| B | 3999 | 49 | 1.225306% |
| C | 3999 | 8 | 0.200050% |
| D | 3999 | 340 | 8.502126% |
Noise dominated data is calculated using 1-second bins in cleaned event files. If a bin has >2000 counts, and if more than 50% of those come from <1% of pixels, then it is considered to be noise-dominated and hence unusable.
| Quadrant | # 1 sec bins | Bins with >0 counts | Bins with >2000 counts | High rate bins dominated by noise | Noise dominated (total time) | Noise dominated (detector-on time) | Marked lightcurve |
|---|---|---|---|---|---|---|---|
| A | 3999 | 3999 | 7 | 7 | 0.18% | 0.18% | 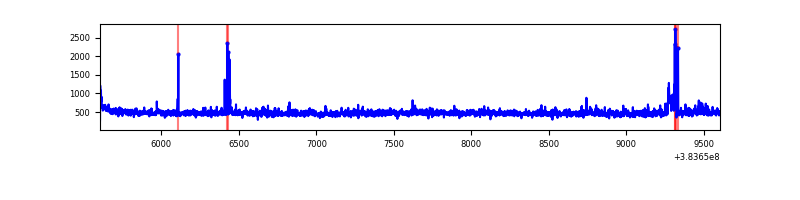 |
| B | 3999 | 3999 | 34 | 34 | 0.85% | 0.85% | 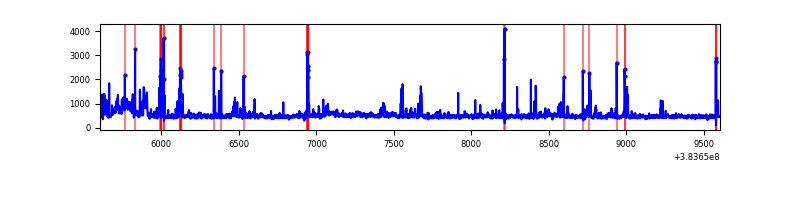 |
| C | 3999 | 3999 | 6 | 6 | 0.15% | 0.15% | 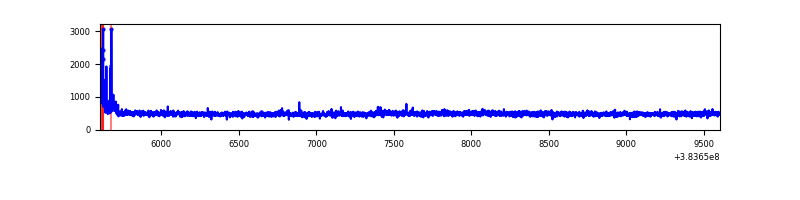 |
| D | 3999 | 3999 | 304 | 304 | 7.60% | 7.60% | 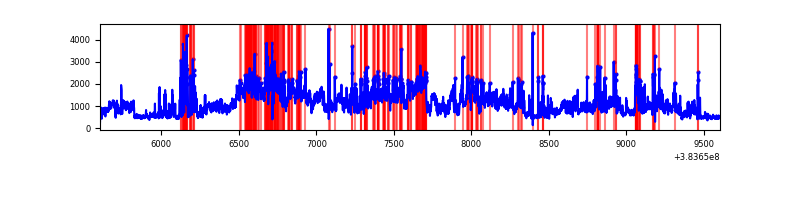 |
Top three noisy pixels from each quadrant. If the there are fewer than three noisy pixels in the level2.evt file, extra rows are filled as -1
| Pixel properties | Quadrant properties | ||||||
|---|---|---|---|---|---|---|---|
| Quadrant | DetID | PixID | Counts | Sigma | Mean | Median | Sigma |
| A | 7 | 48 | 41874 | 439.33 | 461 | 452 | 94.3 |
| A | 15 | 174 | 39044 | 409.32 | 461 | 452 | 94.3 |
| A | 9 | 143 | 28405 | 296.48 | 461 | 452 | 94.3 |
| B | 5 | 172 | 124783 | 1432.29 | 455 | 444 | 86.8 |
| B | 4 | 171 | 84831 | 972.07 | 455 | 444 | 86.8 |
| B | 5 | 255 | 62798 | 718.27 | 455 | 444 | 86.8 |
| C | 15 | 214 | 171913 | 1642.81 | 447 | 449 | 104.4 |
| C | 0 | 10 | 56313 | 535.24 | 447 | 449 | 104.4 |
| C | 14 | 67 | 11345 | 104.4 | 447 | 449 | 104.4 |
| D | 8 | 195 | 1531502 | 14029.6 | 439 | 425 | 109.1 |
| D | 1 | 52 | 624317 | 5716.86 | 439 | 425 | 109.1 |
| D | 2 | 250 | 288266 | 2637.55 | 439 | 425 | 109.1 |
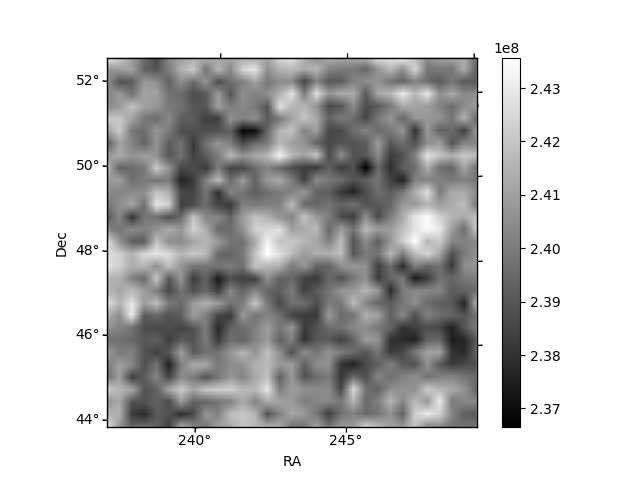
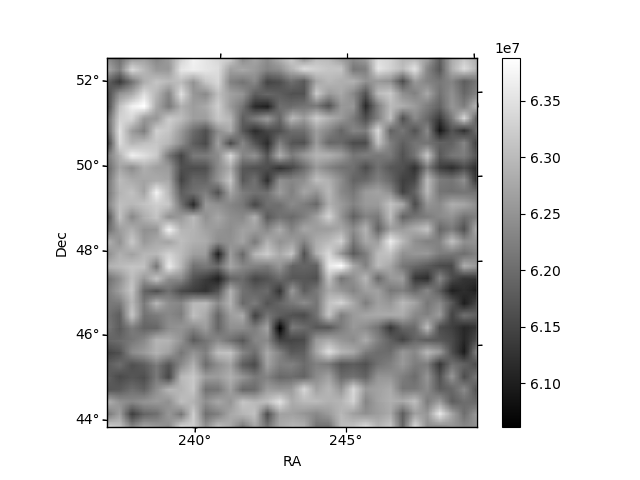
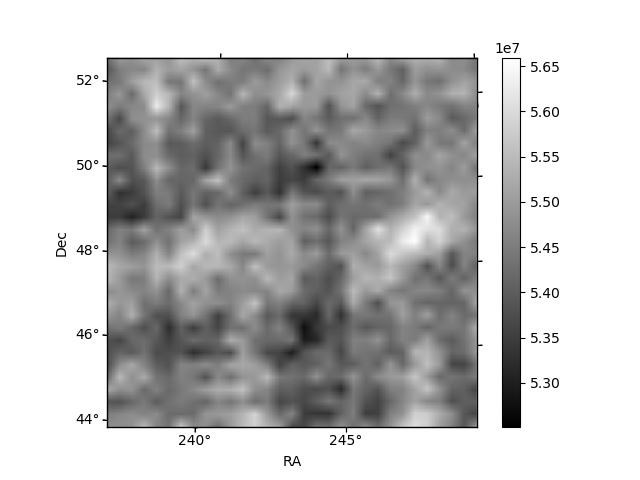
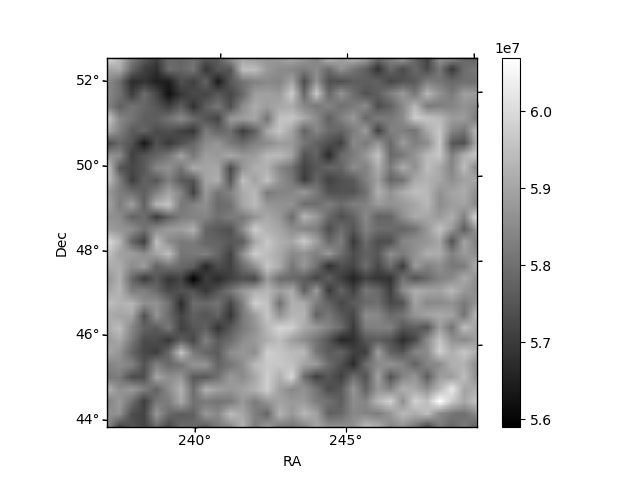
Histogram calculated using DETX and DETY for each event in the final _common_clean file
| Quadrant A | 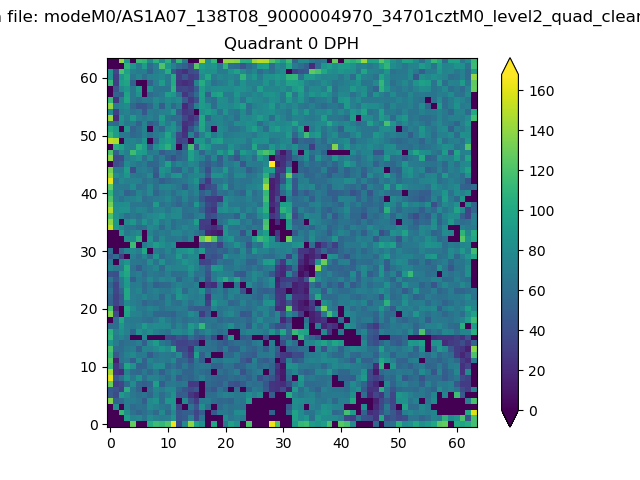 |
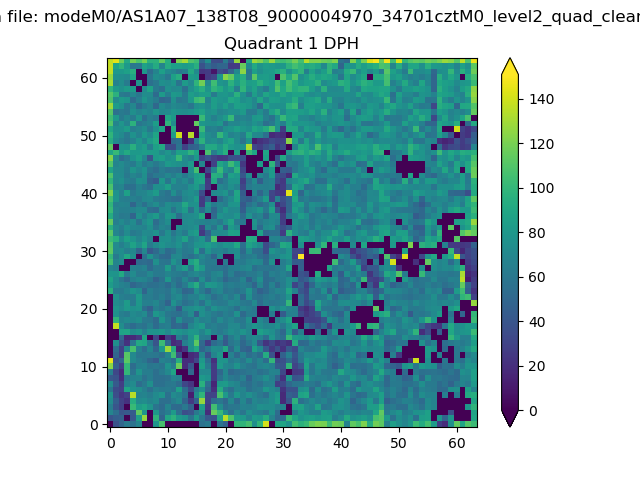 |
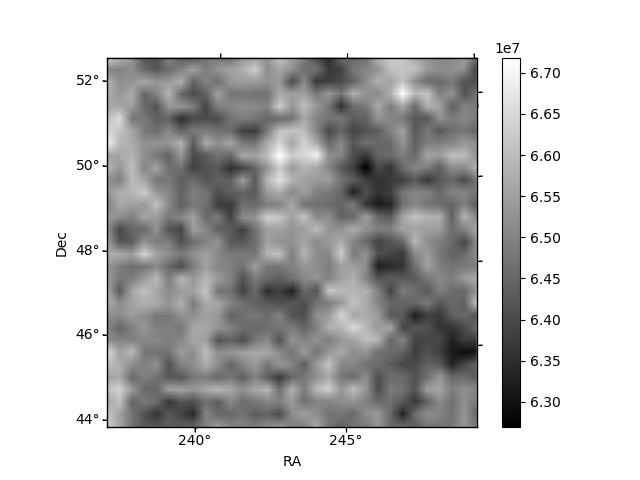
Quadrant B |
|---|---|---|---|
| Quadrant D | 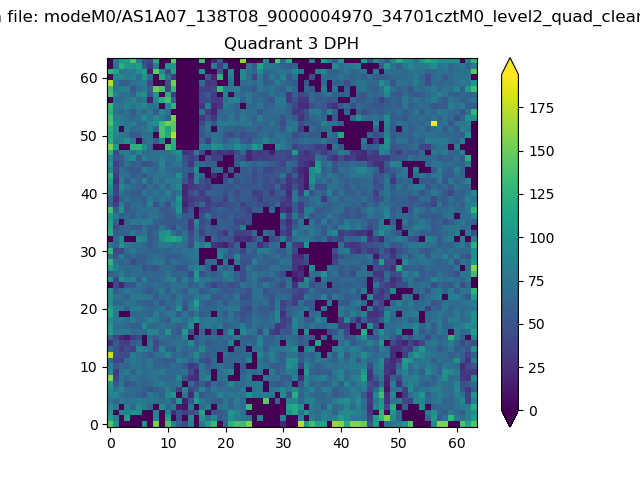 |
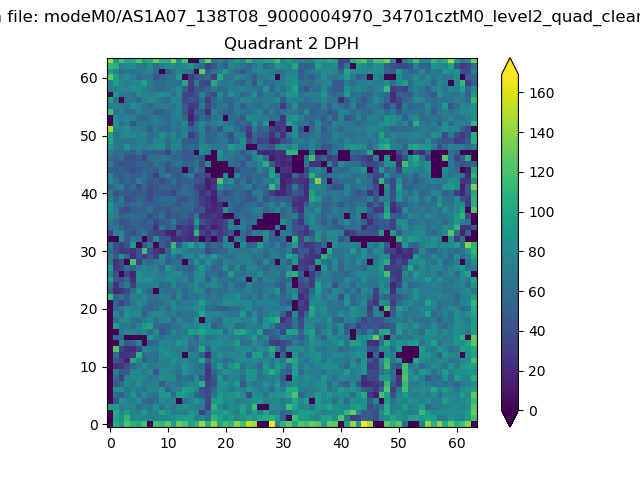 |
Quadrant C |
| Plot type | Count rate plots | Images |
|---|---|---|
| Comparison with Poisson distribution Blue bars denote a histogram of data divided into 1 sec bins. Red curve is a Poisson curve with rate = median count rate of data. |
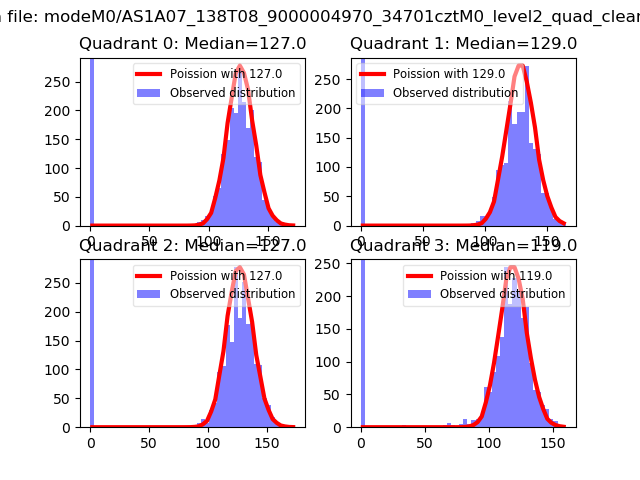 |
 |
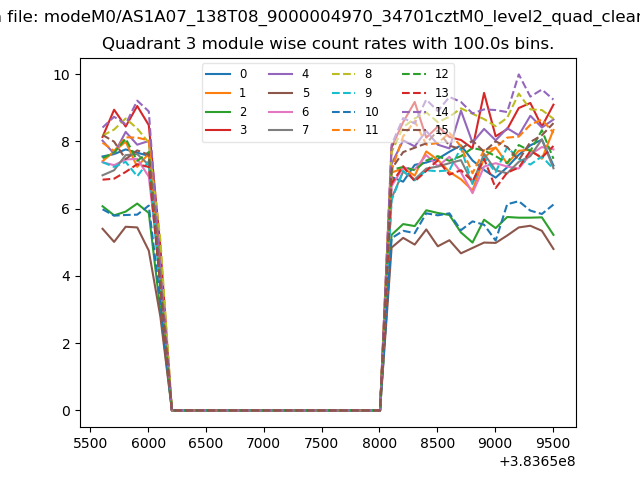
| Quadrant-wise count rates Data is divided into 100 sec bins |
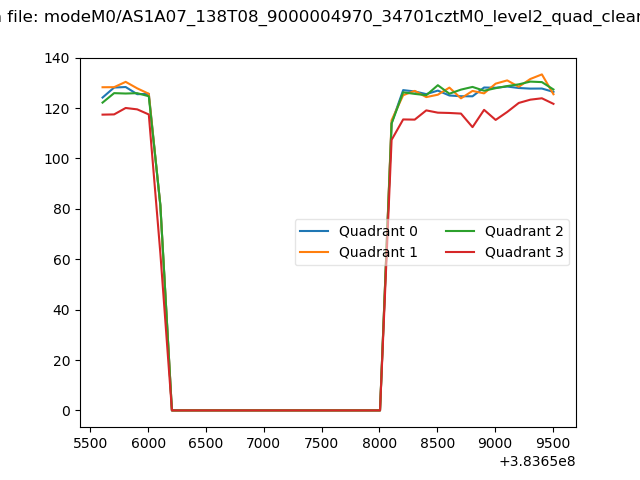 |
|
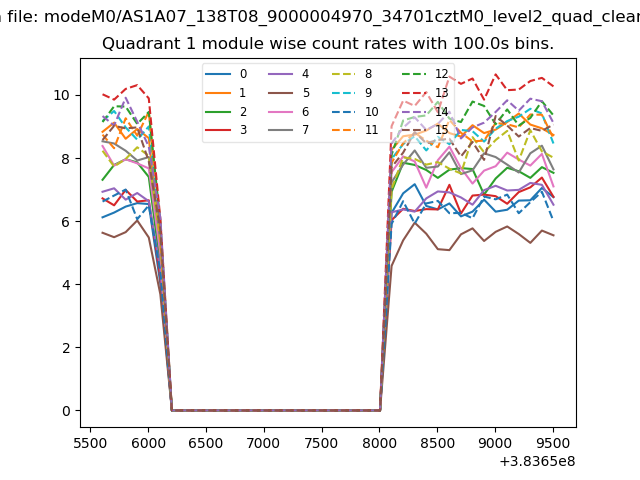
| Module-wise count rates for Quadrant A Data is divided into 100 sec bins |
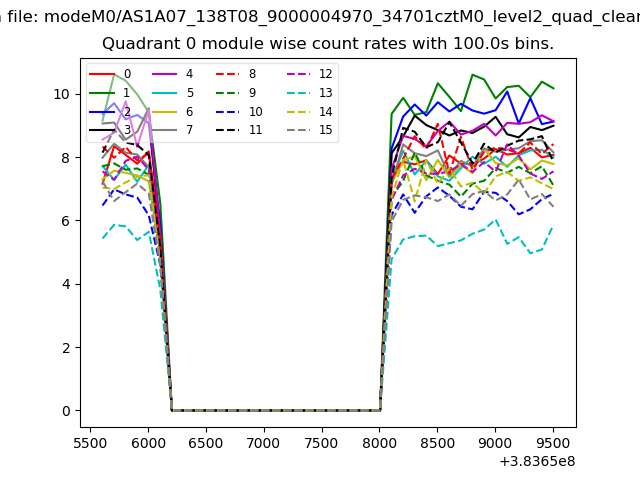 |
 |
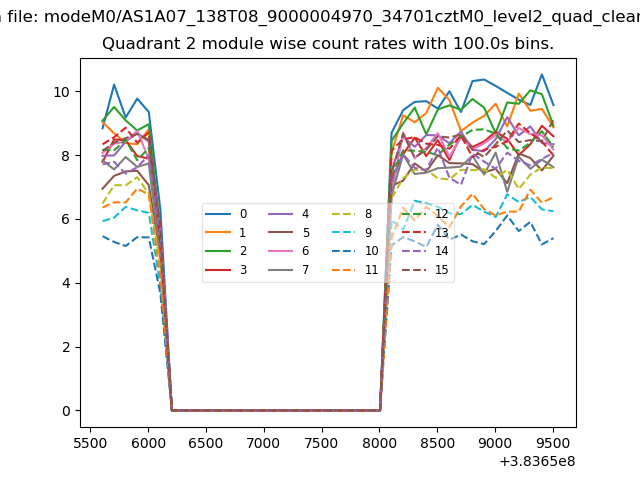
| Module-wise count rates for Quadrant B Data is divided into 100 sec bins |
 |
 |
| Module-wise count rates for Quadrant C Data is divided into 100 sec bins |
 |
 |
| Module-wise count rates for Quadrant D Data is divided into 100 sec bins |
 |
 |
| Parameter | Plot |
|---|---|
| CZT HV Monitor | 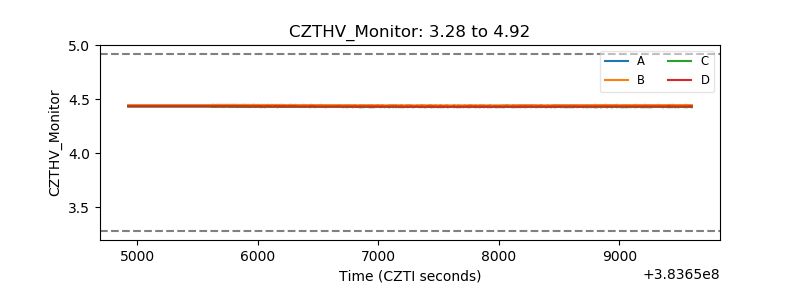 |
| D_VDD | 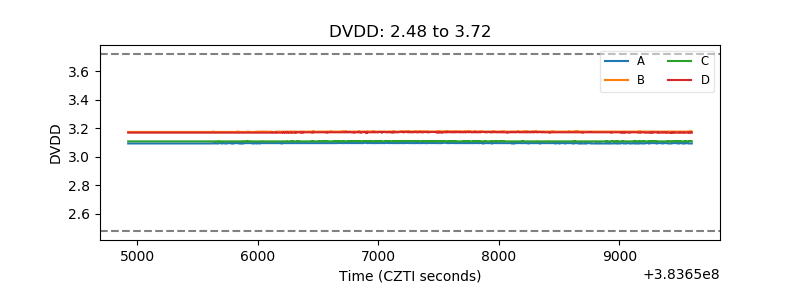 |
| Temperature 1 | 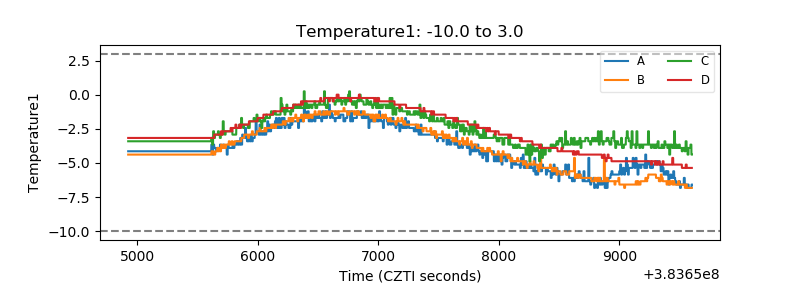 |
| Veto HV Monitor | 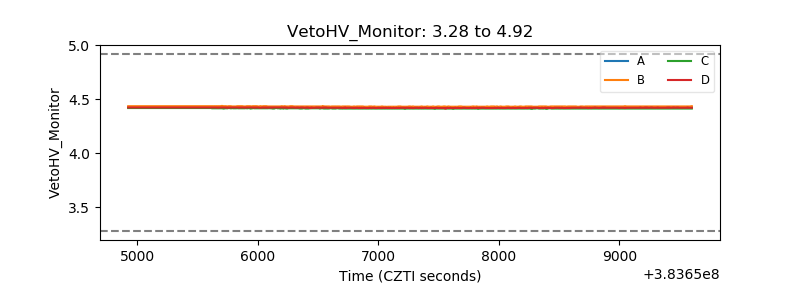 |
| Veto LLD | 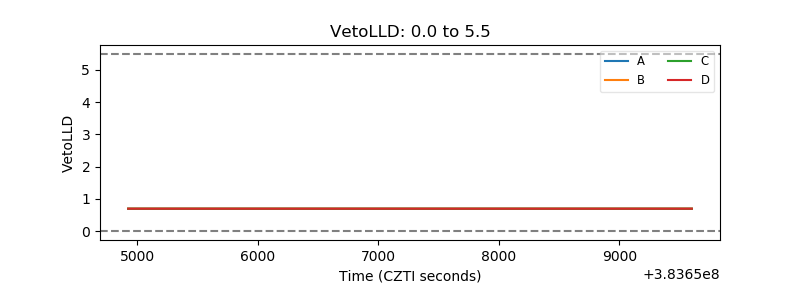 |
| Alpha Counter | 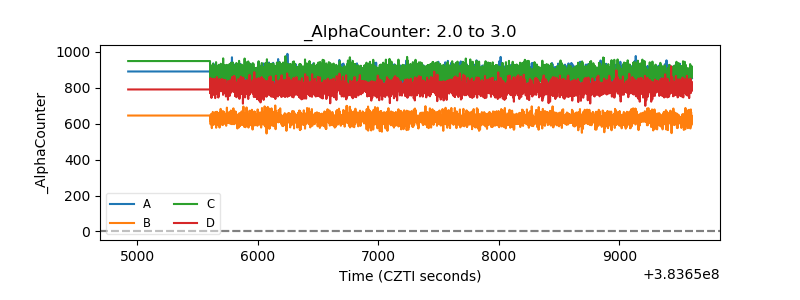 |
| _CPM_Rate | 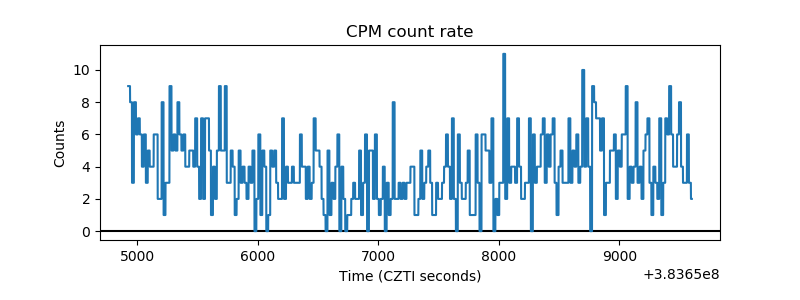 |
| CZT Counter | 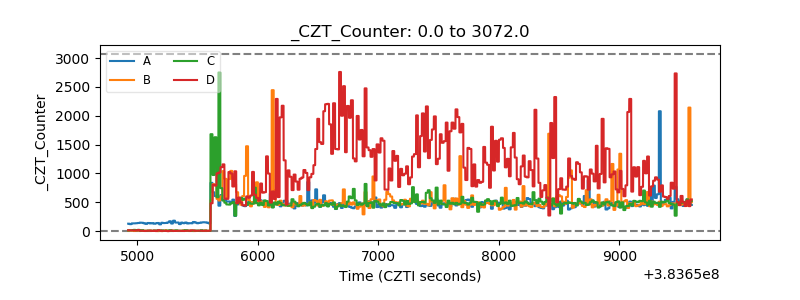 |
| +2.5 Volts monitor | 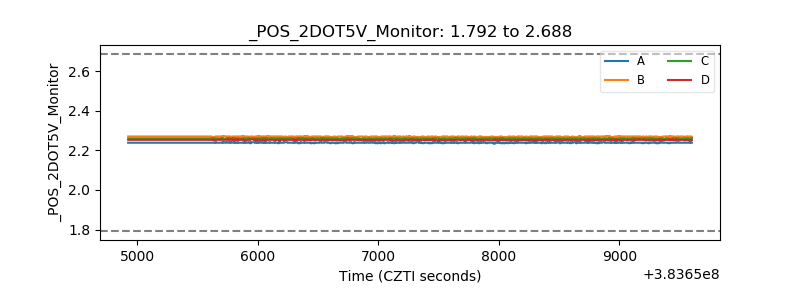 |
| +5 Volts monitor | 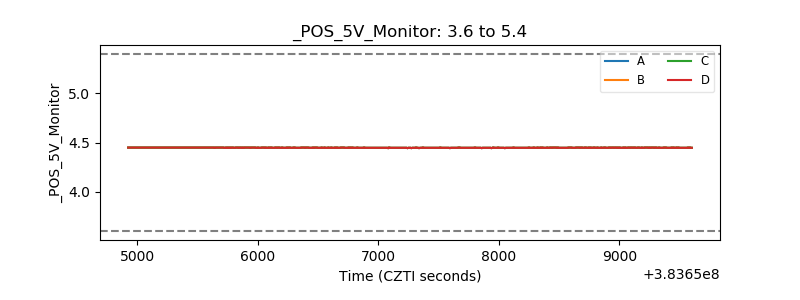 |
| _ROLL_ROT | 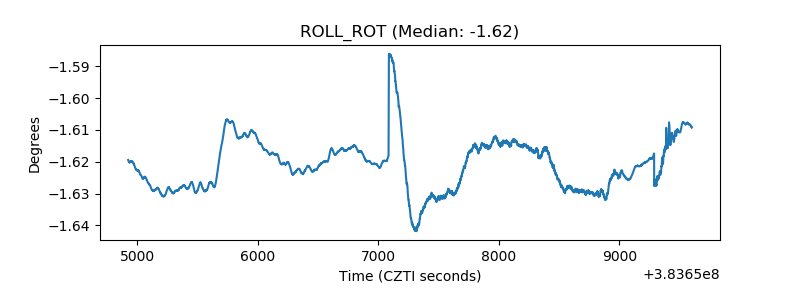 |
| _Roll_DEC | 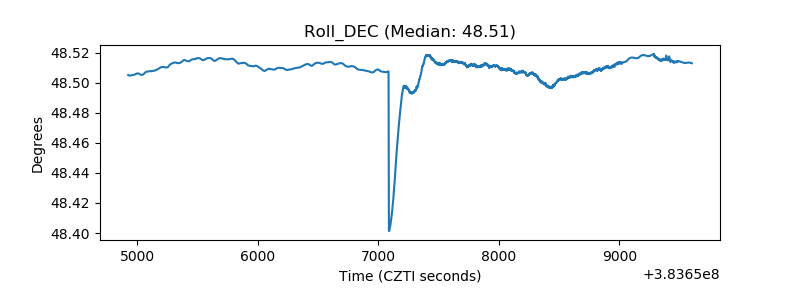 |
| _Roll_RA | 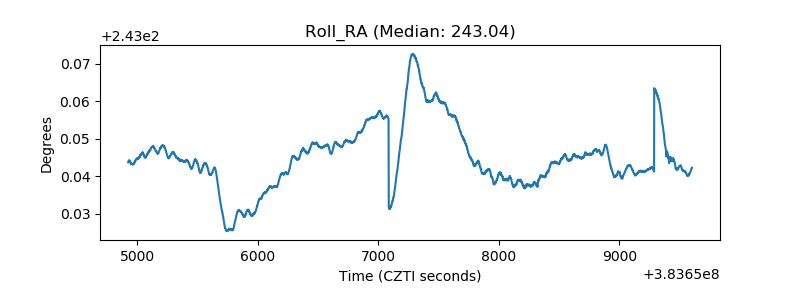 |
| Veto Counter | 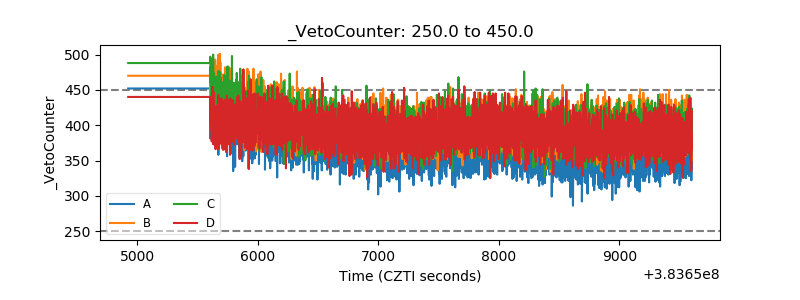 |