| Param | Original file | Final file |
|---|---|---|
| Filename | modeM0/AS1A07_138T08_9000004970_34696cztM0_level2.evt | modeM0/AS1A07_138T08_9000004970_34696cztM0_level2_quad_clean.evt |
| Size (bytes) | 521,458,560 | 81,244,800 |
| Size | 497.3 MB | 77.5 MB |
| Events in quadrant A | 2,845,508 | 544,326 |
| Events in quadrant B | 5,089,722 | 497,587 |
| Events in quadrant C | 2,822,116 | 542,610 |
| Events in quadrant D | 4,672,129 | 500,268 |
| Mode M0 | |||
|---|---|---|---|
| Quadrant | BADHDUFLAG | Total packets | Discarded packets |
| A | 0 | 11686 | 2 |
| B | 0 | 18511 | 1 |
| C | 0 | 11389 | 1 |
| D | 0 | 17434 | 1 |
| Mode M9 | |||
|---|---|---|---|
| Quadrant | BADHDUFLAG | Total packets | Discarded packets |
| A | 0 | 22 | 0 |
| B | 0 | 22 | 0 |
| C | 0 | 22 | 0 |
| D | 0 | 23 | 0 |
| Mode SS | |||
|---|---|---|---|
| Quadrant | BADHDUFLAG | Total packets | Discarded packets |
| A | 0 | 108 | 0 |
| B | 0 | 108 | 0 |
| C | 0 | 108 | 0 |
| D | 0 | 108 | 0 |
| Quadrant | Total seconds | Saturated seconds | Saturation percentage |
|---|---|---|---|
| A | 5362 | 35 | 0.652742% |
| B | 5362 | 825 | 15.386050% |
| C | 5362 | 23 | 0.428944% |
| D | 5362 | 322 | 6.005222% |
Noise dominated data is calculated using 1-second bins in cleaned event files. If a bin has >2000 counts, and if more than 50% of those come from <1% of pixels, then it is considered to be noise-dominated and hence unusable.
| Quadrant | # 1 sec bins | Bins with >0 counts | Bins with >2000 counts | High rate bins dominated by noise | Noise dominated (total time) | Noise dominated (detector-on time) | Marked lightcurve |
|---|---|---|---|---|---|---|---|
| A | 7335 | 5363 | 33 | 33 | 0.45% | 0.62% | 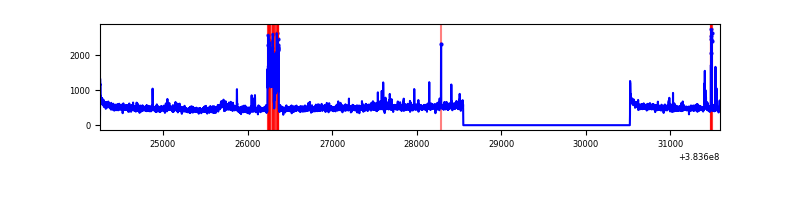 |
| B | 7335 | 5363 | 664 | 664 | 9.05% | 12.38% | 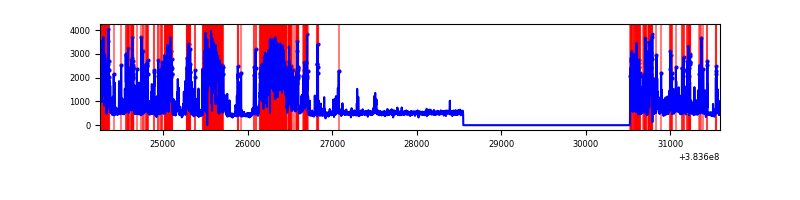 |
| C | 7335 | 5363 | 13 | 13 | 0.18% | 0.24% | 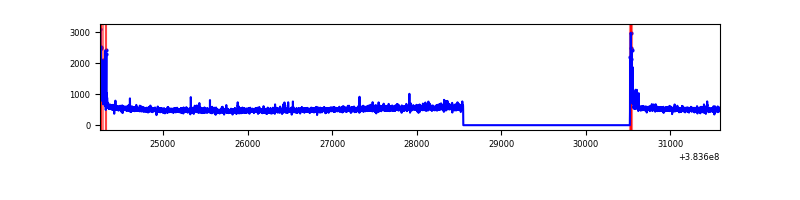 |
| D | 7335 | 5363 | 247 | 247 | 3.37% | 4.61% | 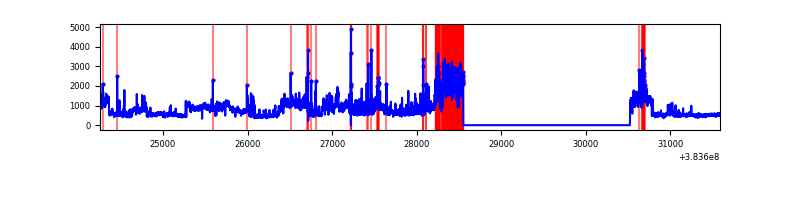 |
Top three noisy pixels from each quadrant. If the there are fewer than three noisy pixels in the level2.evt file, extra rows are filled as -1
| Pixel properties | Quadrant properties | ||||||
|---|---|---|---|---|---|---|---|
| Quadrant | DetID | PixID | Counts | Sigma | Mean | Median | Sigma |
| A | 15 | 174 | 191570 | 1481.43 | 652 | 641 | 128.9 |
| A | 10 | 83 | 48174 | 368.81 | 652 | 641 | 128.9 |
| A | 9 | 143 | 22436 | 169.11 | 652 | 641 | 128.9 |
| B | 5 | 172 | 2275995 | 19815.57 | 611 | 597 | 114.8 |
| B | 5 | 255 | 278540 | 2420.5 | 611 | 597 | 114.8 |
| B | 0 | 190 | 62336 | 537.66 | 611 | 597 | 114.8 |
| C | 15 | 214 | 232153 | 1606.6 | 629 | 633 | 144.1 |
| C | 0 | 10 | 105135 | 725.18 | 629 | 633 | 144.1 |
| C | 14 | 67 | 30043 | 204.09 | 629 | 633 | 144.1 |
| D | 8 | 195 | 1295315 | 8881.29 | 606 | 592 | 145.8 |
| D | 7 | 38 | 573575 | 3930.44 | 606 | 592 | 145.8 |
| D | 2 | 250 | 126619 | 864.5 | 606 | 592 | 145.8 |
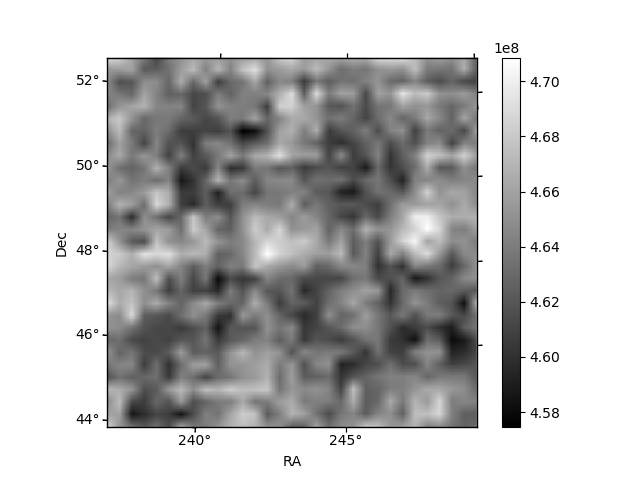
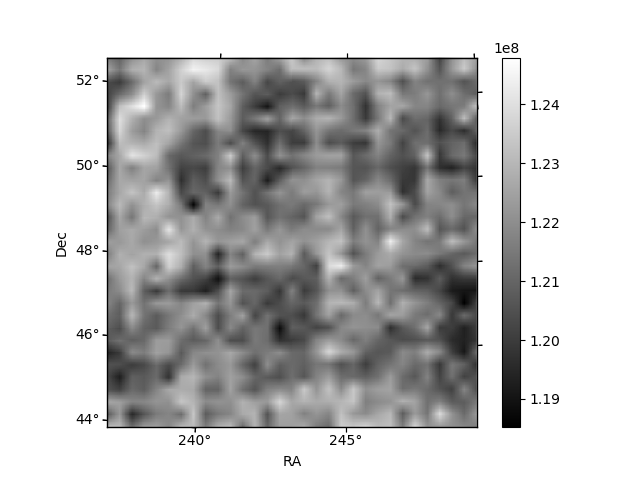
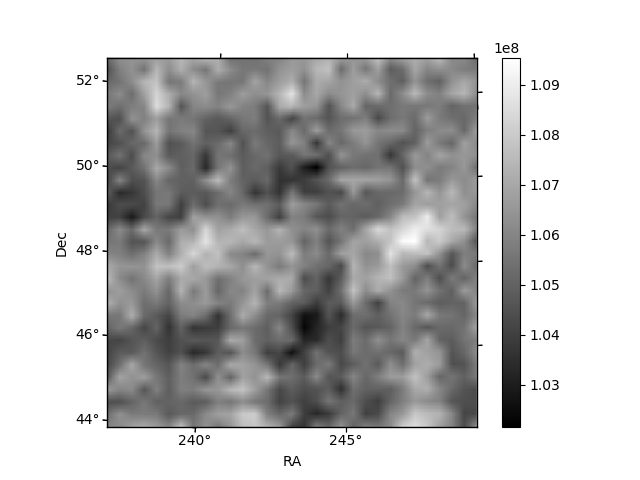
Histogram calculated using DETX and DETY for each event in the final _common_clean file
| Quadrant A | 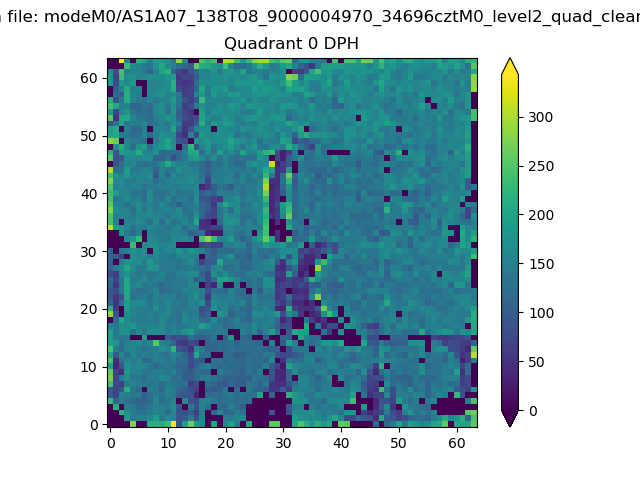 |
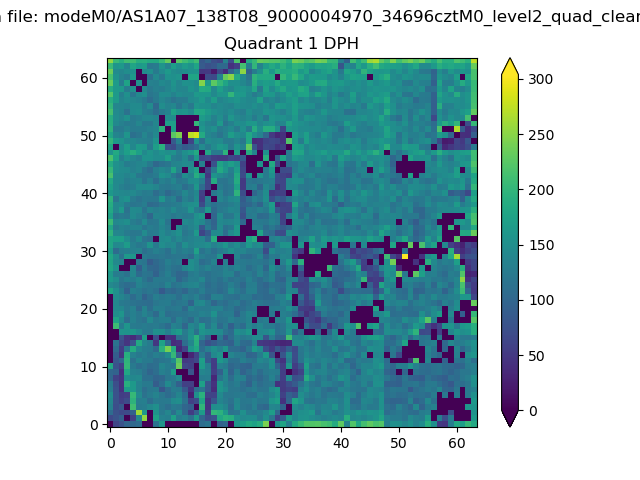 |
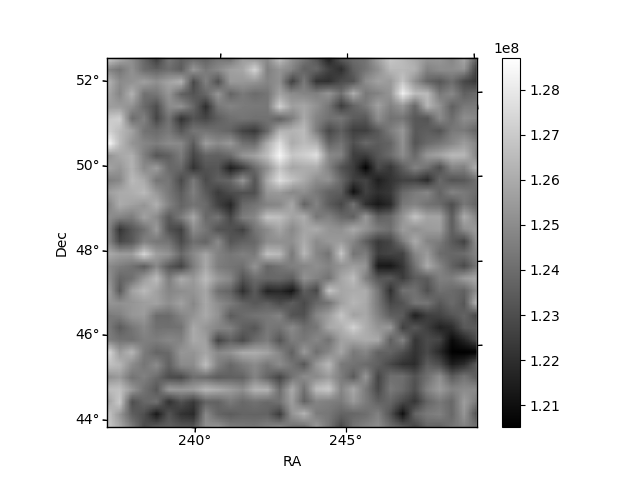
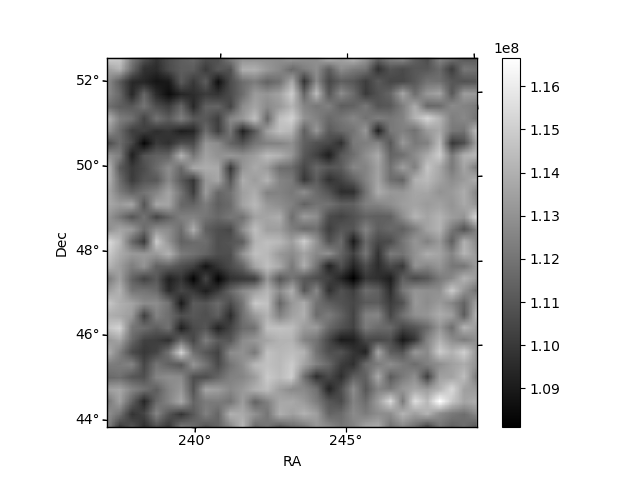
Quadrant B |
|---|---|---|---|
| Quadrant D | 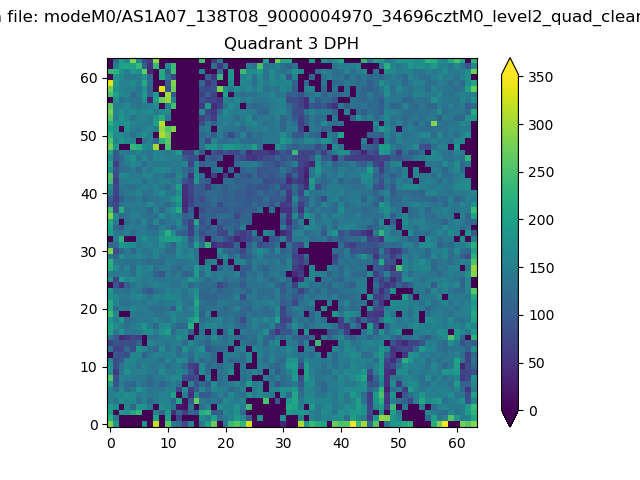 |
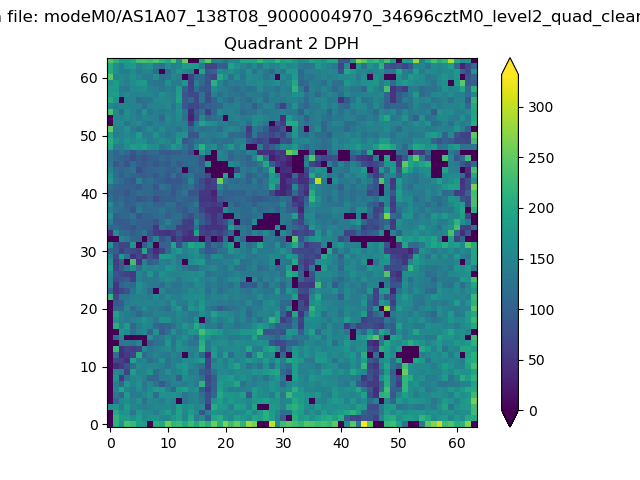 |
Quadrant C |
| Plot type | Count rate plots | Images |
|---|---|---|
| Comparison with Poisson distribution Blue bars denote a histogram of data divided into 1 sec bins. Red curve is a Poisson curve with rate = median count rate of data. |
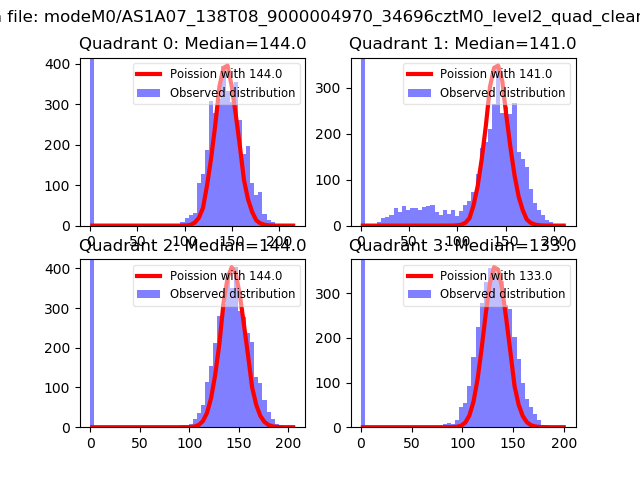 |
 |
| Quadrant-wise count rates Data is divided into 100 sec bins |
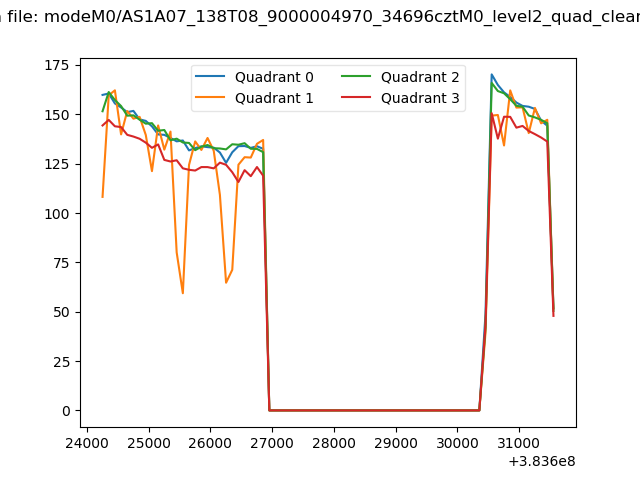 |
|
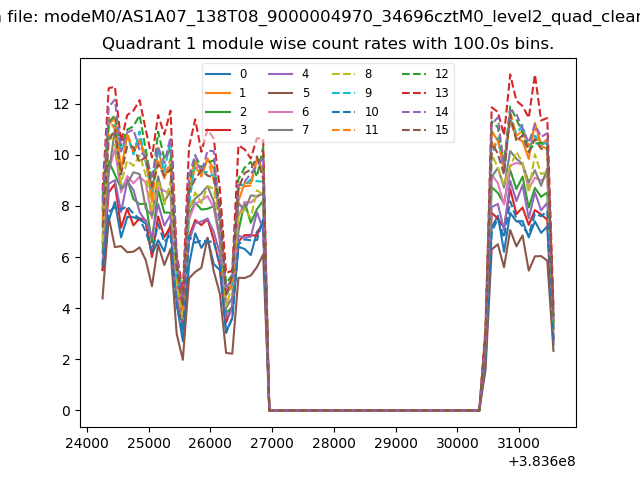
| Module-wise count rates for Quadrant A Data is divided into 100 sec bins |
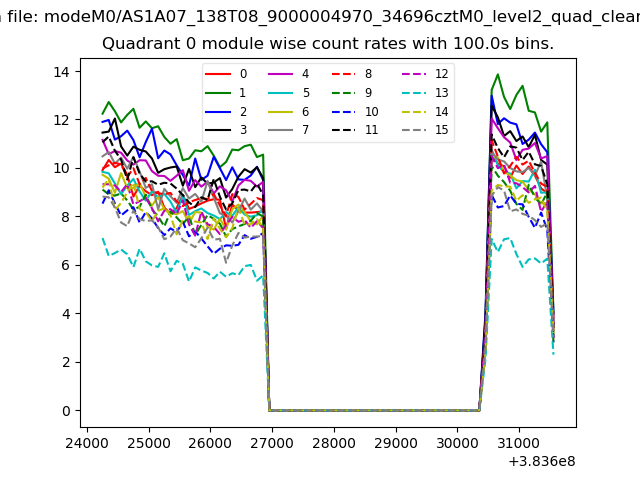 |
 |
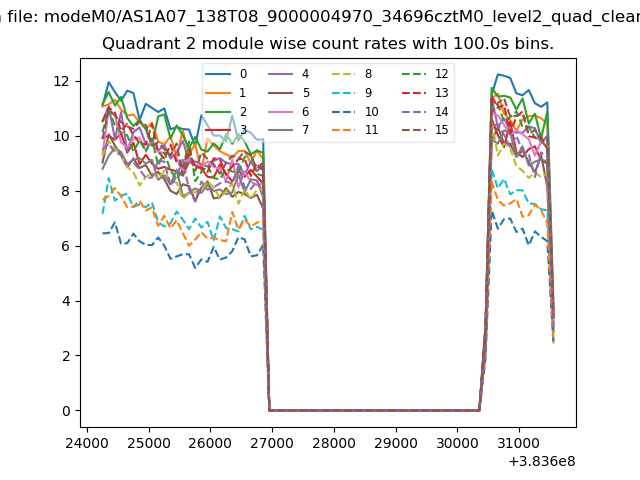
| Module-wise count rates for Quadrant B Data is divided into 100 sec bins |
 |
 |
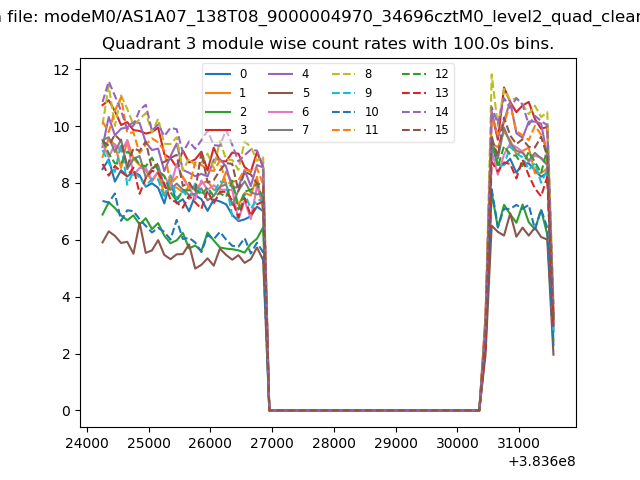
| Module-wise count rates for Quadrant C Data is divided into 100 sec bins |
 |
 |
| Module-wise count rates for Quadrant D Data is divided into 100 sec bins |
 |
 |
| Parameter | Plot |
|---|---|
| CZT HV Monitor | 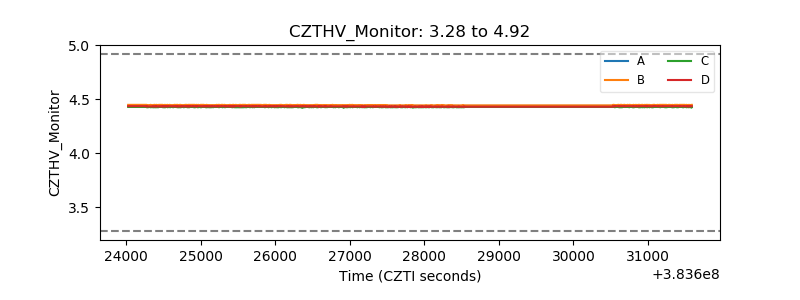 |
| D_VDD | 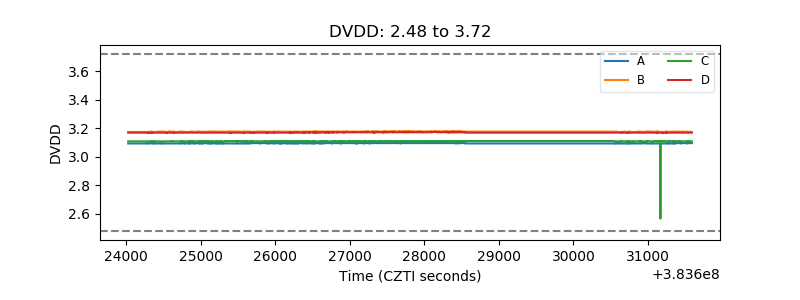 |
| Temperature 1 | 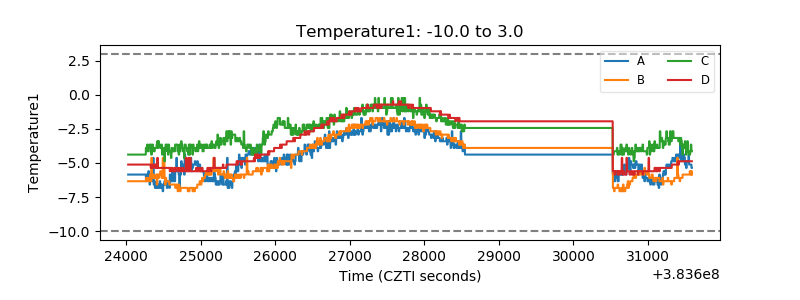 |
| Veto HV Monitor | 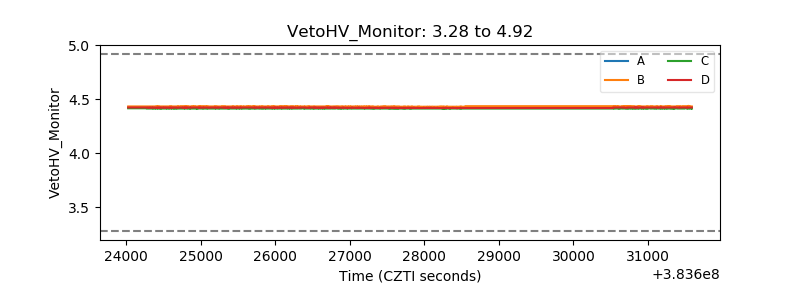 |
| Veto LLD | 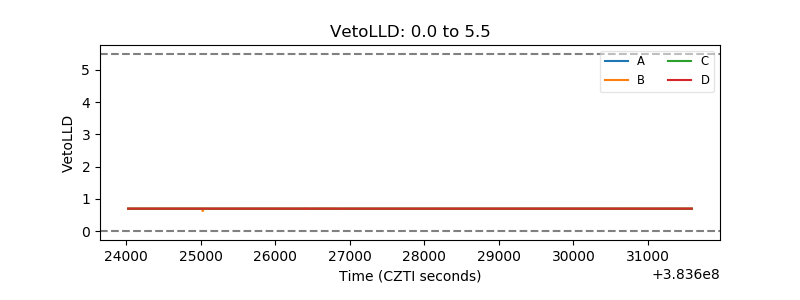 |
| Alpha Counter | 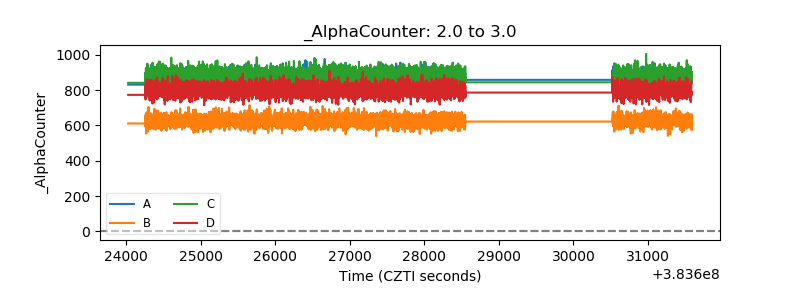 |
| _CPM_Rate | 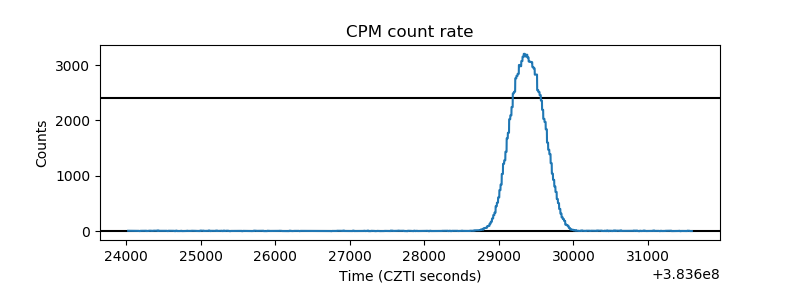 |
| CZT Counter | 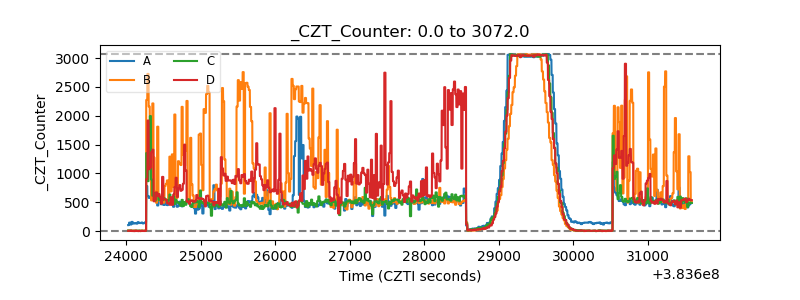 |
| +2.5 Volts monitor | 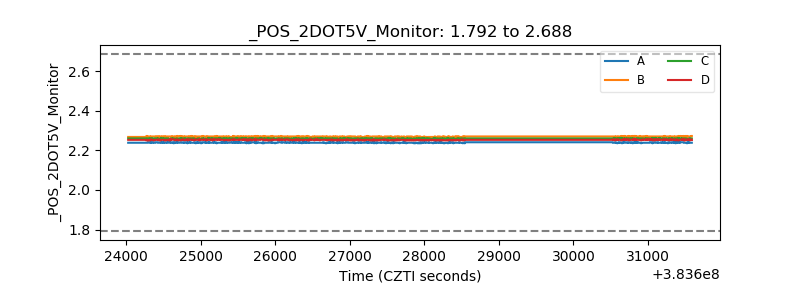 |
| +5 Volts monitor | 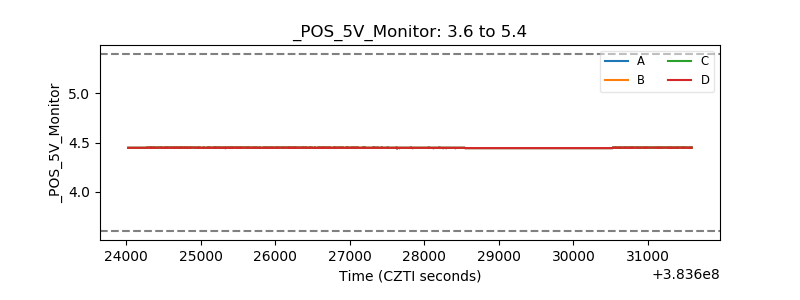 |
| _ROLL_ROT | 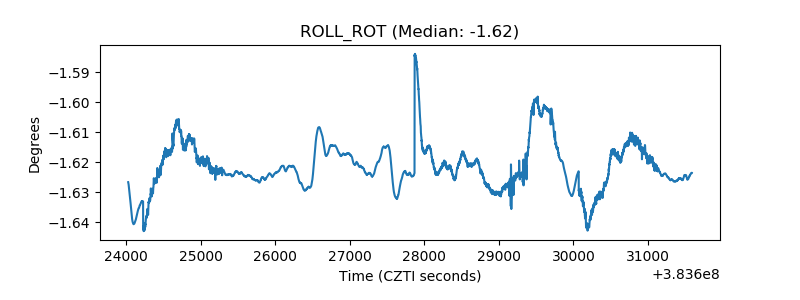 |
| _Roll_DEC | 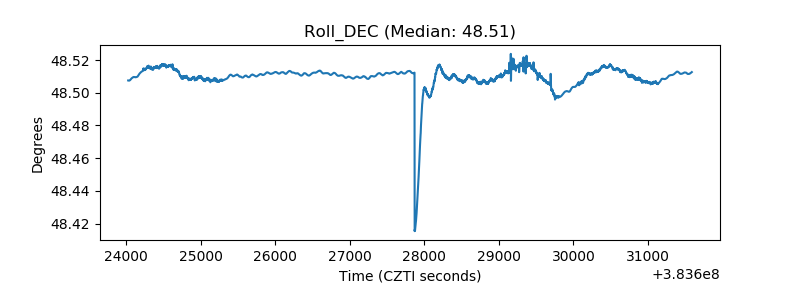 |
| _Roll_RA | 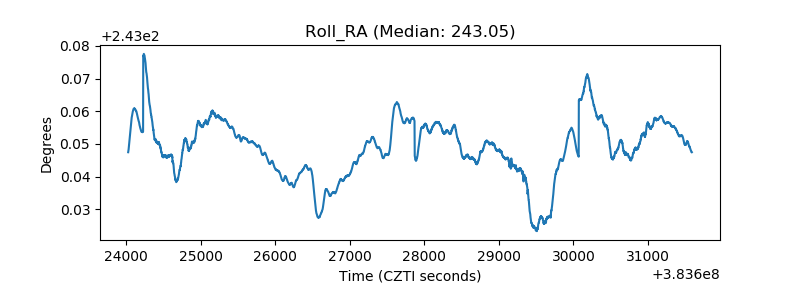 |
| Veto Counter | 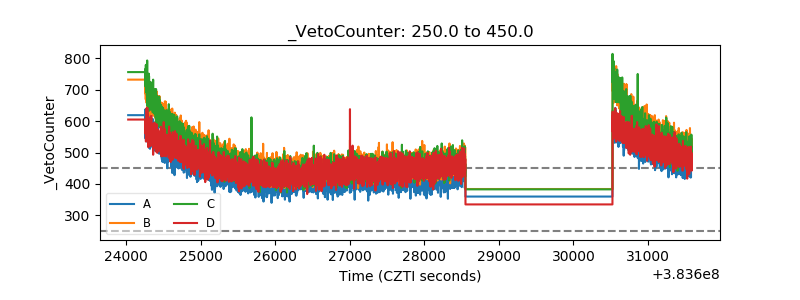 |