| Param | Original file | Final file |
|---|---|---|
| Filename | modeM0/AS1A07_138T08_9000004970_34695cztM0_level2.evt | modeM0/AS1A07_138T08_9000004970_34695cztM0_level2_quad_clean.evt |
| Size (bytes) | 468,478,080 | 83,174,400 |
| Size | 446.8 MB | 79.3 MB |
| Events in quadrant A | 2,571,841 | 546,950 |
| Events in quadrant B | 3,703,231 | 542,654 |
| Events in quadrant C | 2,767,551 | 550,237 |
| Events in quadrant D | 4,785,482 | 507,379 |
| Mode M0 | |||
|---|---|---|---|
| Quadrant | BADHDUFLAG | Total packets | Discarded packets |
| A | 0 | 10999 | 3 |
| B | 0 | 14396 | 2 |
| C | 0 | 11295 | 2 |
| D | 0 | 17848 | 2 |
| Mode M9 | |||
|---|---|---|---|
| Quadrant | BADHDUFLAG | Total packets | Discarded packets |
| A | 0 | 34 | 0 |
| B | 0 | 34 | 0 |
| C | 0 | 34 | 0 |
| D | 0 | 35 | 0 |
| Mode SS | |||
|---|---|---|---|
| Quadrant | BADHDUFLAG | Total packets | Discarded packets |
| A | 0 | 108 | 0 |
| B | 0 | 108 | 0 |
| C | 0 | 108 | 0 |
| D | 0 | 108 | 0 |
| Quadrant | Total seconds | Saturated seconds | Saturation percentage |
|---|---|---|---|
| A | 5306 | 12 | 0.226159% |
| B | 5306 | 291 | 5.484357% |
| C | 5306 | 45 | 0.848096% |
| D | 5306 | 199 | 3.750471% |
Noise dominated data is calculated using 1-second bins in cleaned event files. If a bin has >2000 counts, and if more than 50% of those come from <1% of pixels, then it is considered to be noise-dominated and hence unusable.
| Quadrant | # 1 sec bins | Bins with >0 counts | Bins with >2000 counts | High rate bins dominated by noise | Noise dominated (total time) | Noise dominated (detector-on time) | Marked lightcurve |
|---|---|---|---|---|---|---|---|
| A | 7158 | 5307 | 2 | 2 | 0.03% | 0.04% | 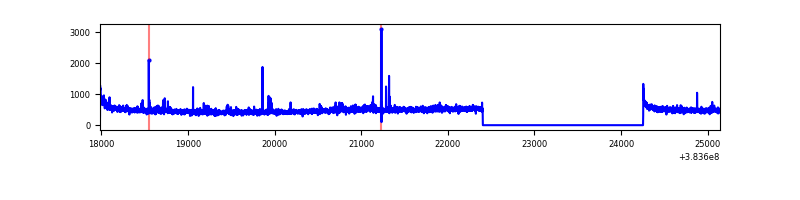 |
| B | 7158 | 5307 | 217 | 217 | 3.03% | 4.09% | 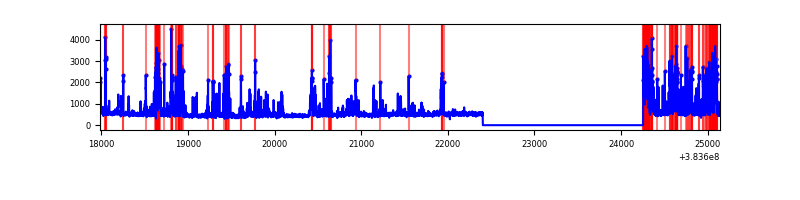 |
| C | 7158 | 5307 | 30 | 30 | 0.42% | 0.57% | 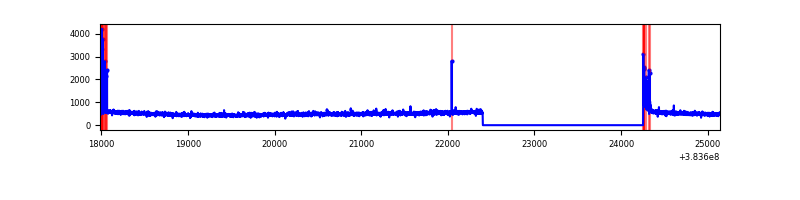 |
| D | 7158 | 5307 | 169 | 169 | 2.36% | 3.18% | 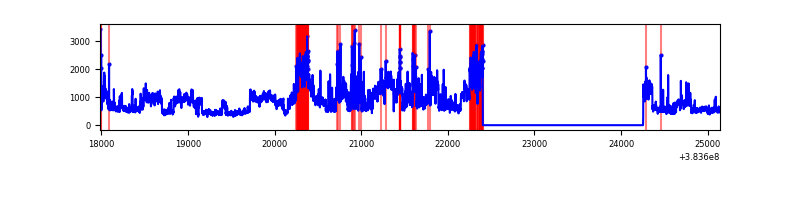 |
Top three noisy pixels from each quadrant. If the there are fewer than three noisy pixels in the level2.evt file, extra rows are filled as -1
| Pixel properties | Quadrant properties | ||||||
|---|---|---|---|---|---|---|---|
| Quadrant | DetID | PixID | Counts | Sigma | Mean | Median | Sigma |
| A | 10 | 83 | 46608 | 369.37 | 625 | 614 | 124.5 |
| A | 15 | 169 | 43298 | 342.78 | 625 | 614 | 124.5 |
| A | 13 | 6 | 16045 | 123.92 | 625 | 614 | 124.5 |
| B | 5 | 172 | 990572 | 8553.37 | 615 | 600 | 115.7 |
| B | 5 | 255 | 226977 | 1955.9 | 615 | 600 | 115.7 |
| B | 4 | 232 | 22328 | 187.73 | 615 | 600 | 115.7 |
| C | 15 | 214 | 224805 | 1607.27 | 606 | 609 | 139.5 |
| C | 0 | 10 | 130639 | 932.19 | 606 | 609 | 139.5 |
| C | 14 | 67 | 45918 | 324.82 | 606 | 609 | 139.5 |
| D | 8 | 195 | 1790668 | 12502.81 | 592 | 577 | 143.2 |
| D | 10 | 204 | 147200 | 1024.08 | 592 | 577 | 143.2 |
| D | 2 | 250 | 138383 | 962.5 | 592 | 577 | 143.2 |
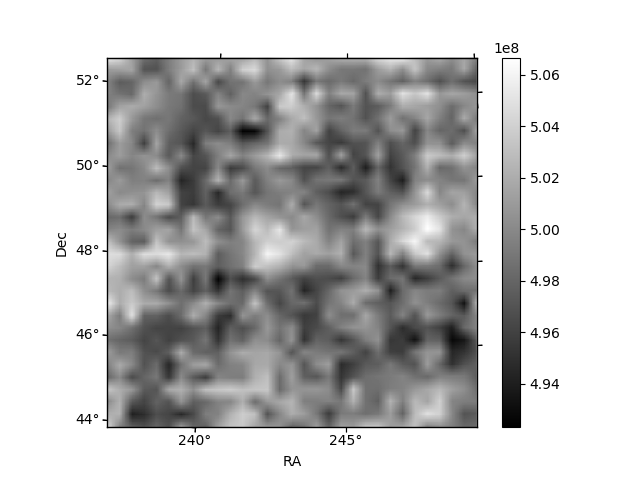
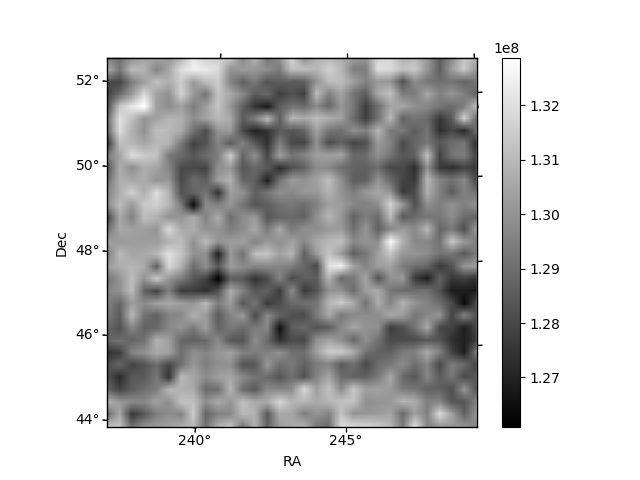
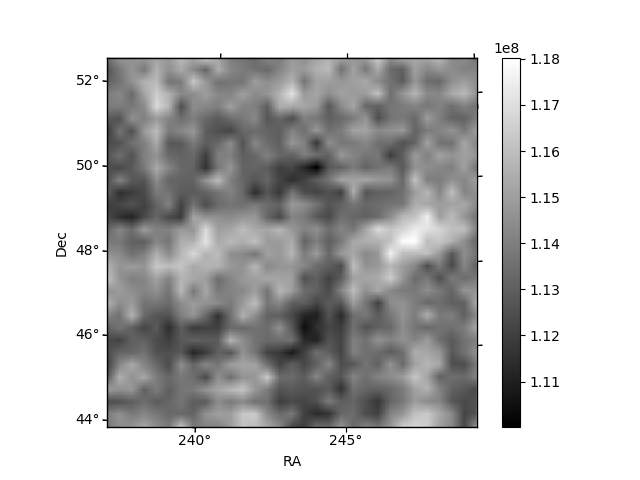
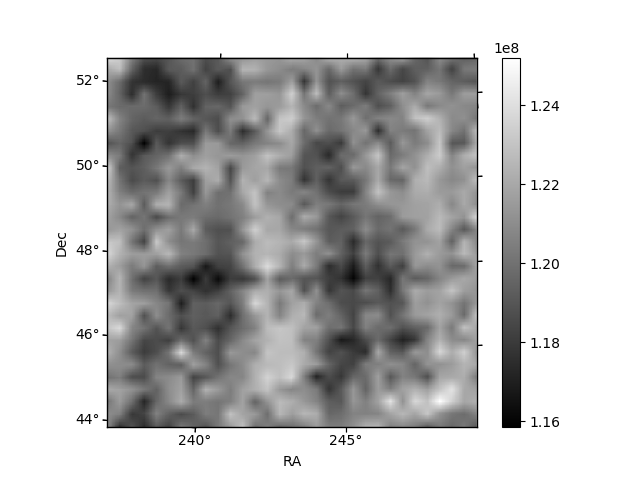
Histogram calculated using DETX and DETY for each event in the final _common_clean file
| Quadrant A | 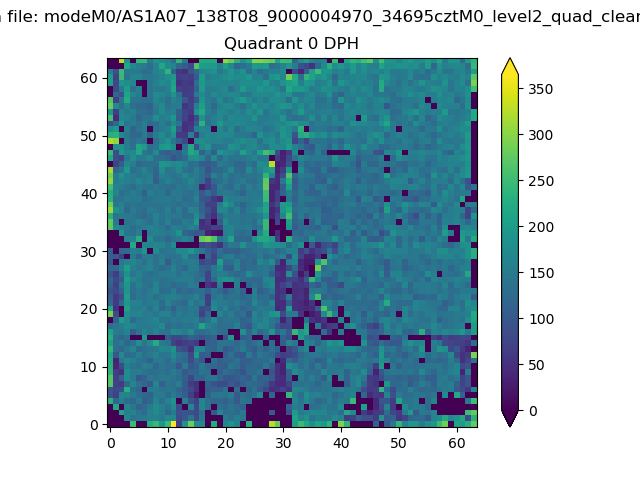 |
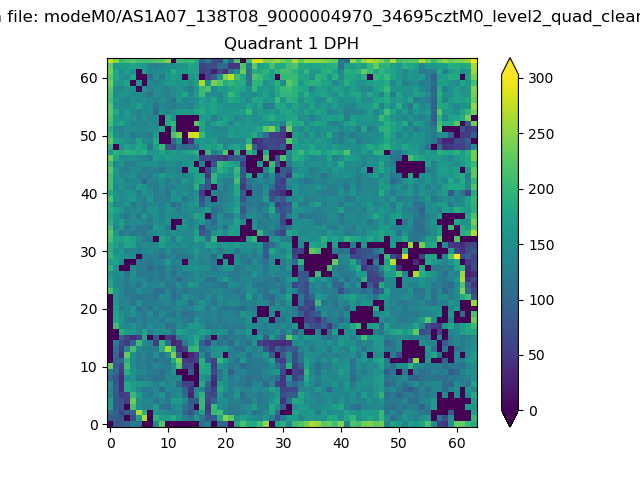 |
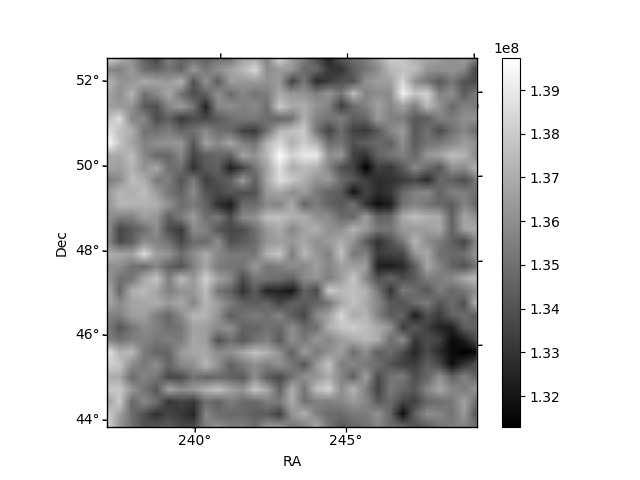
Quadrant B |
|---|---|---|---|
| Quadrant D | 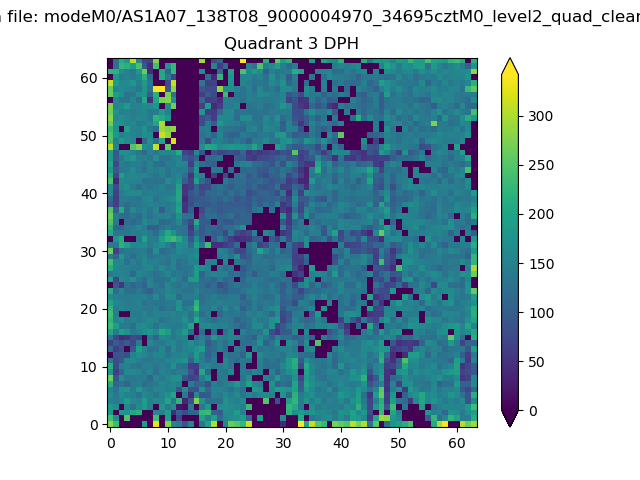 |
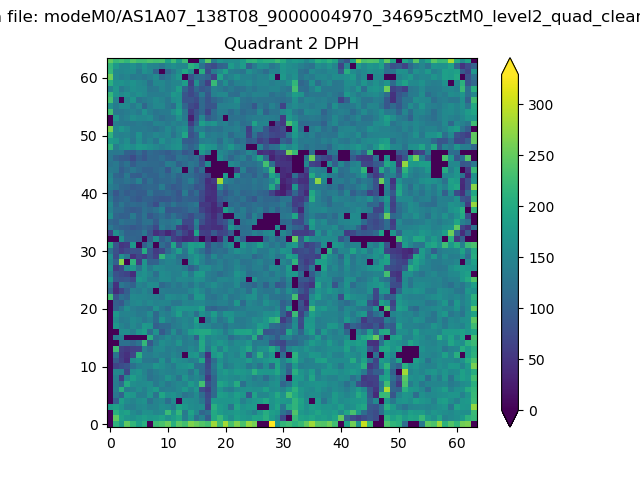 |
Quadrant C |
| Plot type | Count rate plots | Images |
|---|---|---|
| Comparison with Poisson distribution Blue bars denote a histogram of data divided into 1 sec bins. Red curve is a Poisson curve with rate = median count rate of data. |
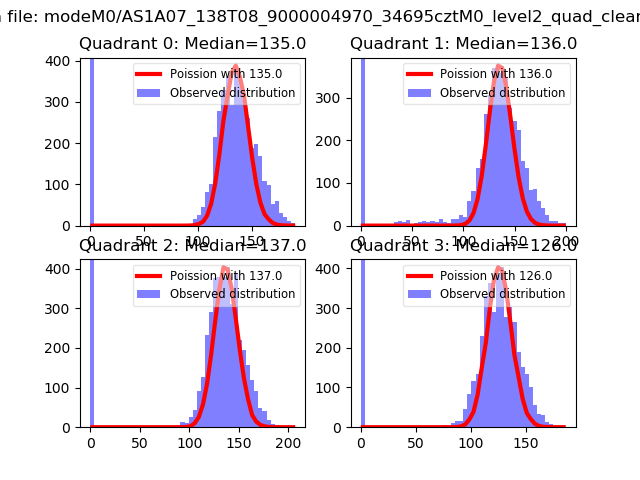 |
 |
| Quadrant-wise count rates Data is divided into 100 sec bins |
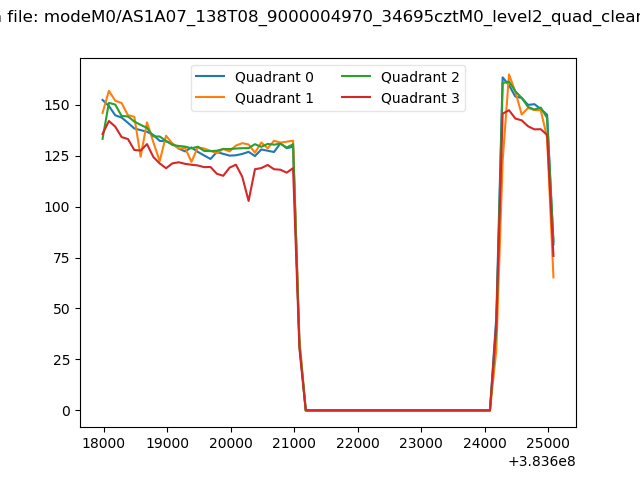 |
|
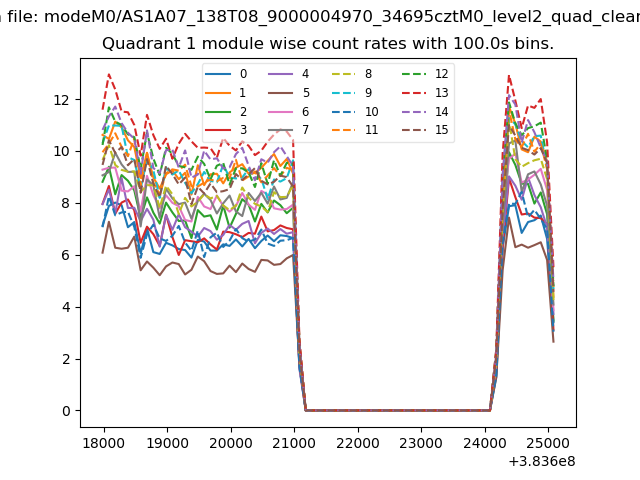
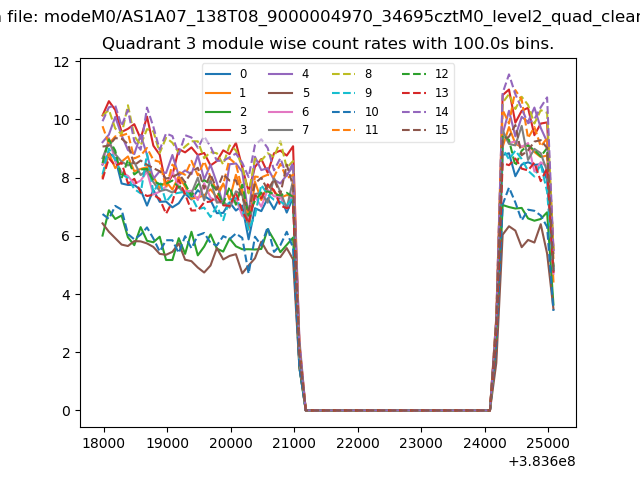
| Module-wise count rates for Quadrant A Data is divided into 100 sec bins |
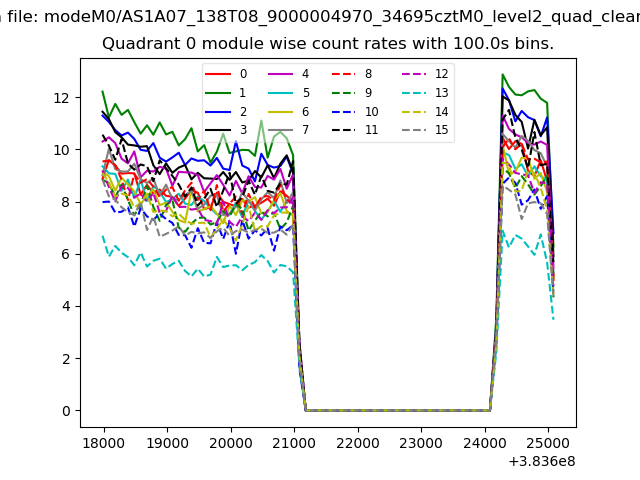 |
 |
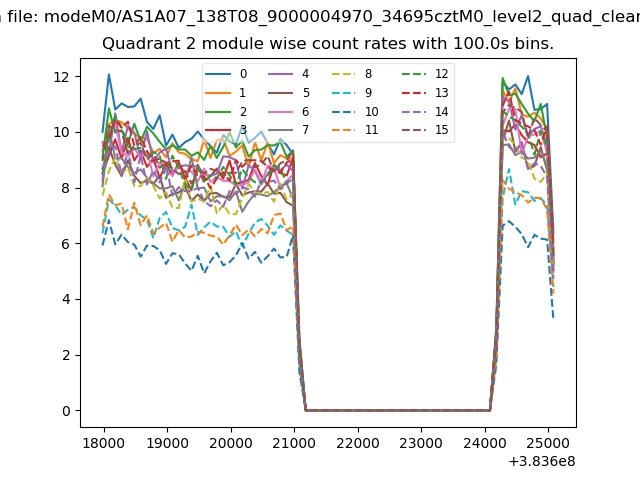
| Module-wise count rates for Quadrant B Data is divided into 100 sec bins |
 |
 |
| Module-wise count rates for Quadrant C Data is divided into 100 sec bins |
 |
 |
| Module-wise count rates for Quadrant D Data is divided into 100 sec bins |
 |
 |
| Parameter | Plot |
|---|---|
| CZT HV Monitor | 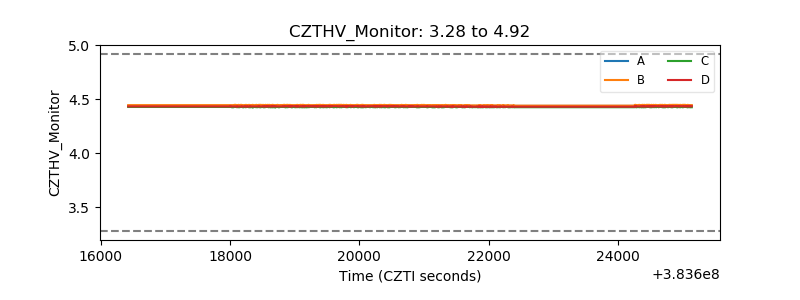 |
| D_VDD | 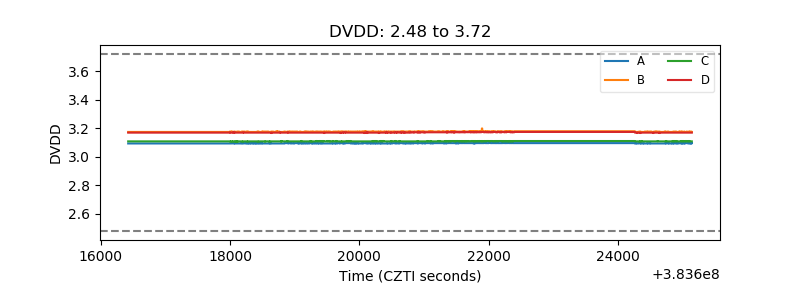 |
| Temperature 1 | 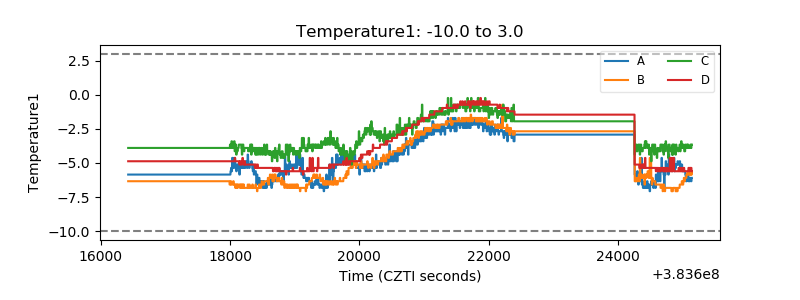 |
| Veto HV Monitor | 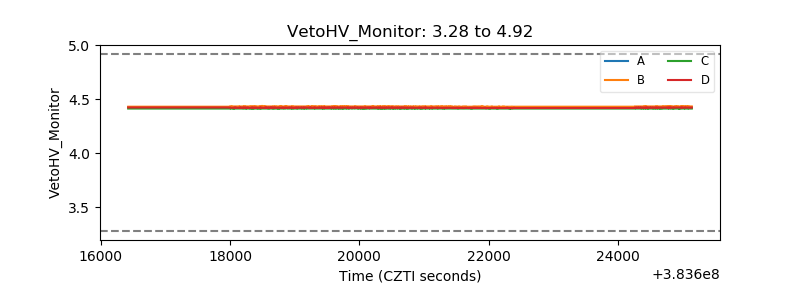 |
| Veto LLD | 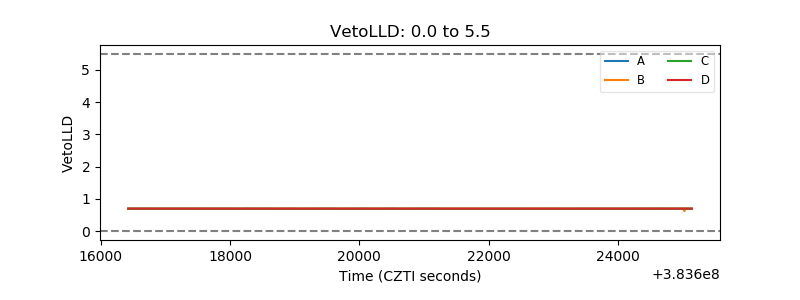 |
| Alpha Counter | 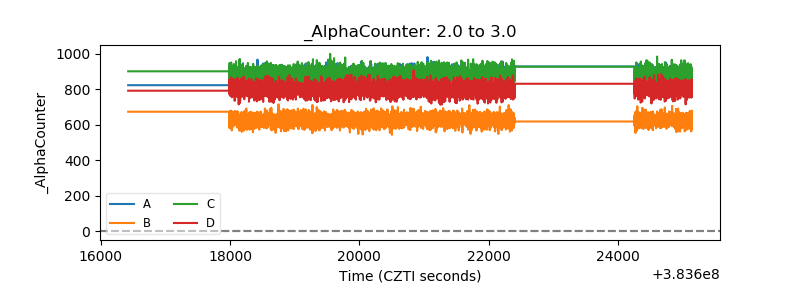 |
| _CPM_Rate | 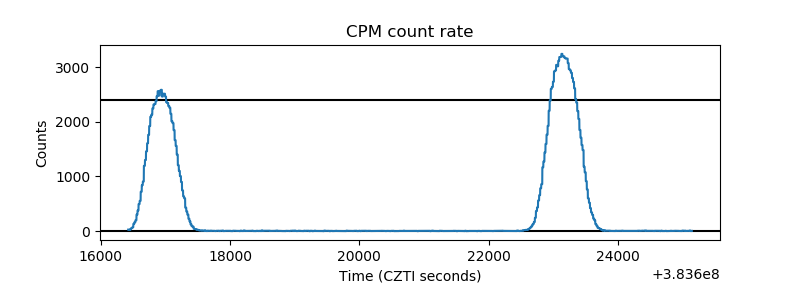 |
| CZT Counter | 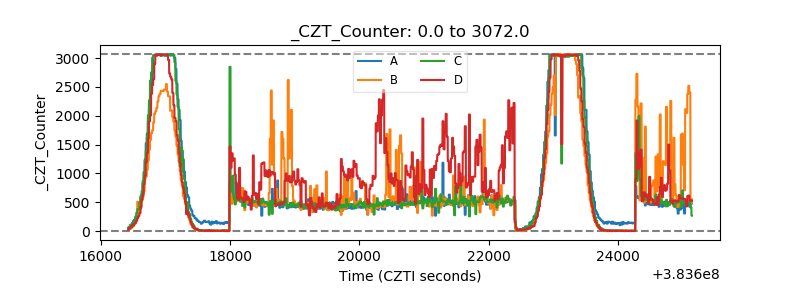 |
| +2.5 Volts monitor | 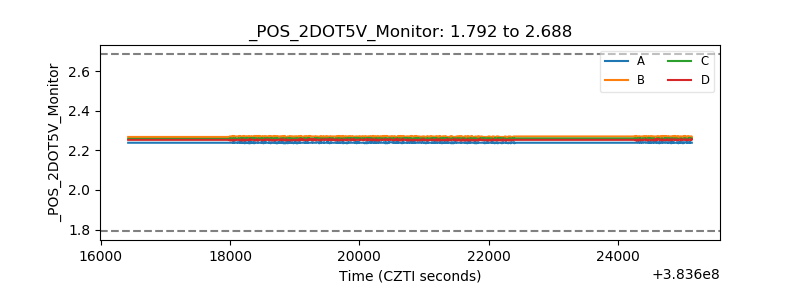 |
| +5 Volts monitor | 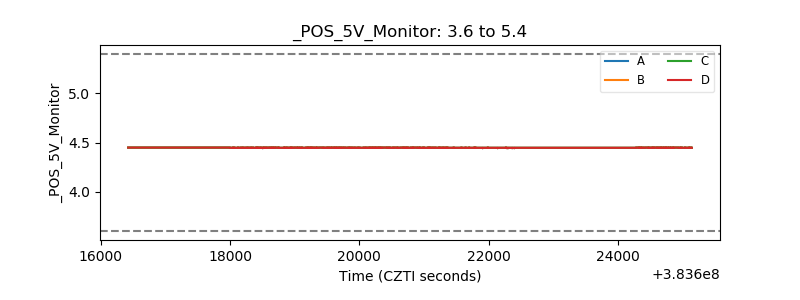 |
| _ROLL_ROT | 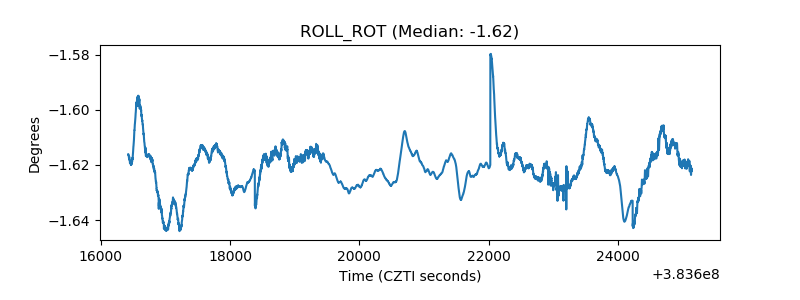 |
| _Roll_DEC | 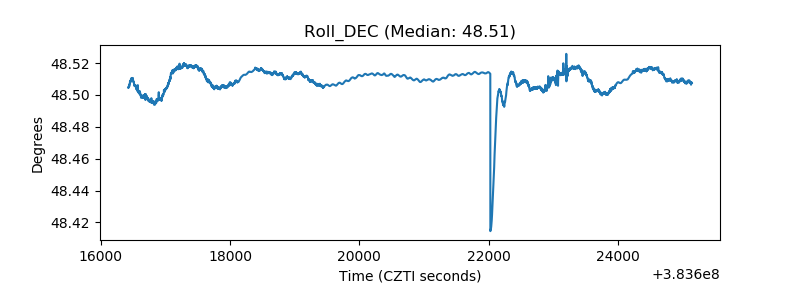 |
| _Roll_RA | 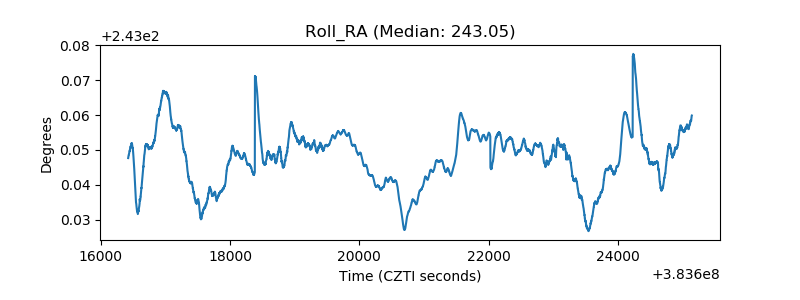 |
| Veto Counter | 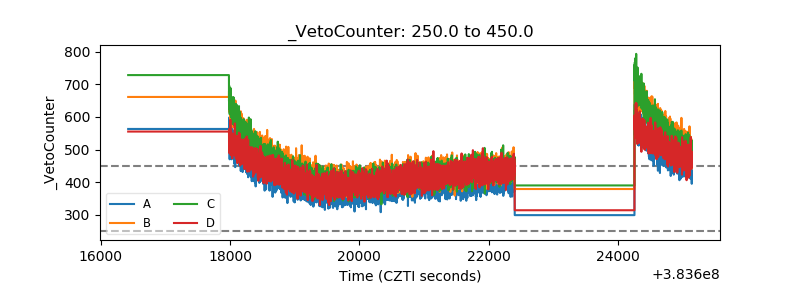 |