| Param | Original file | Final file |
|---|---|---|
| Filename | modeM0/AS1A07_138T08_9000004970_34694cztM0_level2.evt | modeM0/AS1A07_138T08_9000004970_34694cztM0_level2_quad_clean.evt |
| Size (bytes) | 384,327,360 | 65,266,560 |
| Size | 366.5 MB | 62.2 MB |
| Events in quadrant A | 2,040,905 | 425,811 |
| Events in quadrant B | 3,549,944 | 415,995 |
| Events in quadrant C | 2,145,063 | 428,211 |
| Events in quadrant D | 3,609,505 | 401,757 |
| Mode M0 | |||
|---|---|---|---|
| Quadrant | BADHDUFLAG | Total packets | Discarded packets |
| A | 0 | 8990 | 2 |
| B | 0 | 13381 | 1 |
| C | 0 | 9040 | 1 |
| D | 0 | 13755 | 1 |
| Mode M9 | |||
|---|---|---|---|
| Quadrant | BADHDUFLAG | Total packets | Discarded packets |
| A | 0 | 17 | 0 |
| B | 0 | 17 | 0 |
| C | 0 | 17 | 0 |
| D | 0 | 17 | 0 |
| Mode SS | |||
|---|---|---|---|
| Quadrant | BADHDUFLAG | Total packets | Discarded packets |
| A | 0 | 90 | 0 |
| B | 0 | 90 | 0 |
| C | 0 | 90 | 0 |
| D | 0 | 90 | 0 |
| Quadrant | Total seconds | Saturated seconds | Saturation percentage |
|---|---|---|---|
| A | 4320 | 13 | 0.300926% |
| B | 4320 | 419 | 9.699074% |
| C | 4320 | 30 | 0.694444% |
| D | 4320 | 100 | 2.314815% |
Noise dominated data is calculated using 1-second bins in cleaned event files. If a bin has >2000 counts, and if more than 50% of those come from <1% of pixels, then it is considered to be noise-dominated and hence unusable.
| Quadrant | # 1 sec bins | Bins with >0 counts | Bins with >2000 counts | High rate bins dominated by noise | Noise dominated (total time) | Noise dominated (detector-on time) | Marked lightcurve |
|---|---|---|---|---|---|---|---|
| A | 6053 | 4321 | 3 | 3 | 0.05% | 0.07% | 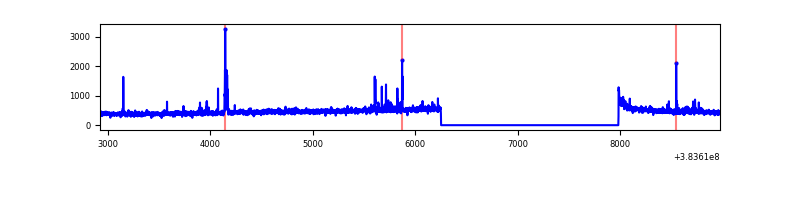 |
| B | 6053 | 4320 | 300 | 300 | 4.96% | 6.94% | 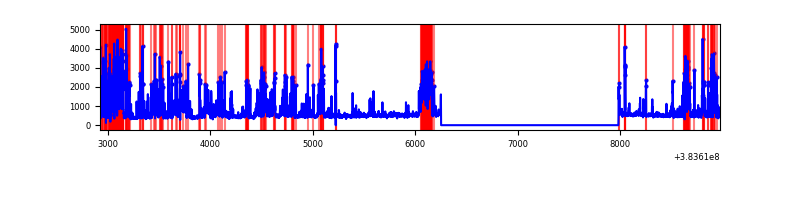 |
| C | 6053 | 4321 | 21 | 21 | 0.35% | 0.49% | 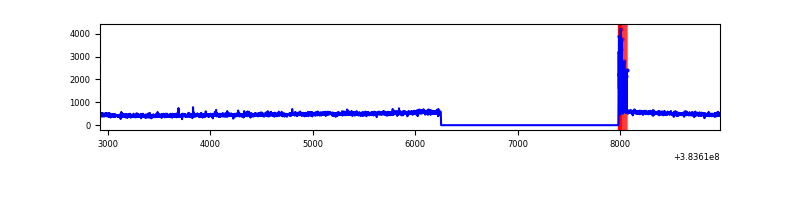 |
| D | 6053 | 4321 | 46 | 46 | 0.76% | 1.06% | 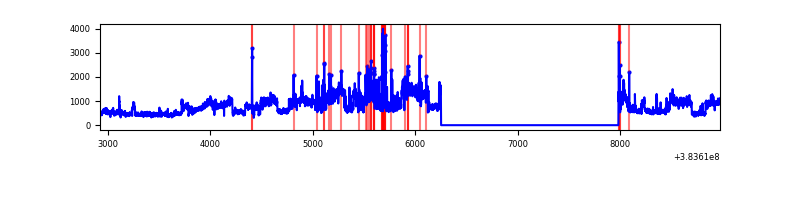 |
Top three noisy pixels from each quadrant. If the there are fewer than three noisy pixels in the level2.evt file, extra rows are filled as -1
| Pixel properties | Quadrant properties | ||||||
|---|---|---|---|---|---|---|---|
| Quadrant | DetID | PixID | Counts | Sigma | Mean | Median | Sigma |
| A | 7 | 3 | 30008 | 293.87 | 495 | 485 | 100.5 |
| A | 10 | 83 | 26419 | 258.14 | 495 | 485 | 100.5 |
| A | 9 | 143 | 26369 | 257.65 | 495 | 485 | 100.5 |
| B | 5 | 172 | 1358369 | 14797.33 | 475 | 462 | 91.8 |
| B | 5 | 255 | 278129 | 3025.78 | 475 | 462 | 91.8 |
| B | 4 | 232 | 14226 | 149.99 | 475 | 462 | 91.8 |
| C | 15 | 214 | 180413 | 1618.57 | 476 | 480 | 111.2 |
| C | 0 | 10 | 74575 | 666.52 | 476 | 480 | 111.2 |
| C | 14 | 67 | 27716 | 245.0 | 476 | 480 | 111.2 |
| D | 8 | 195 | 1232087 | 10608.24 | 471 | 456 | 116.1 |
| D | 1 | 52 | 239477 | 2058.73 | 471 | 456 | 116.1 |
| D | 2 | 249 | 152858 | 1312.66 | 471 | 456 | 116.1 |
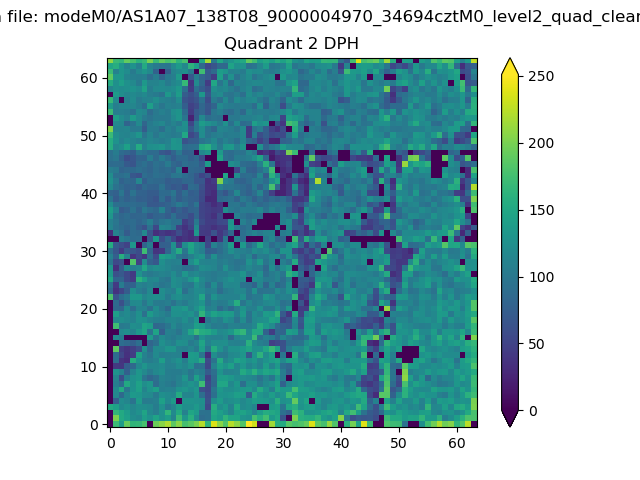
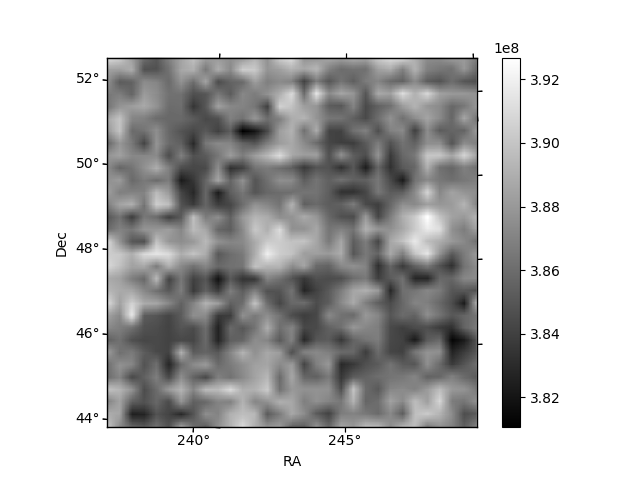
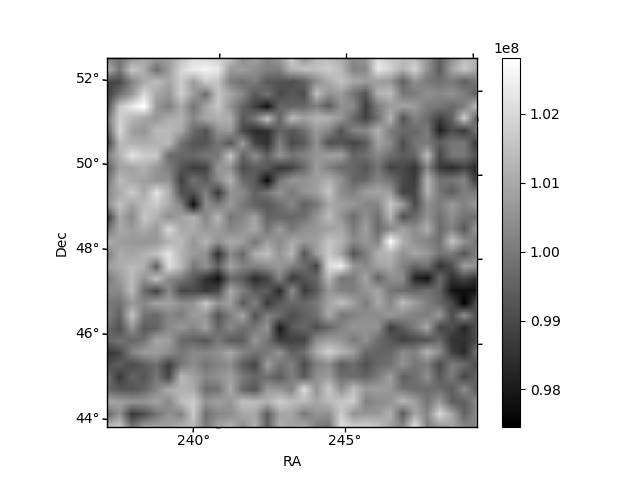
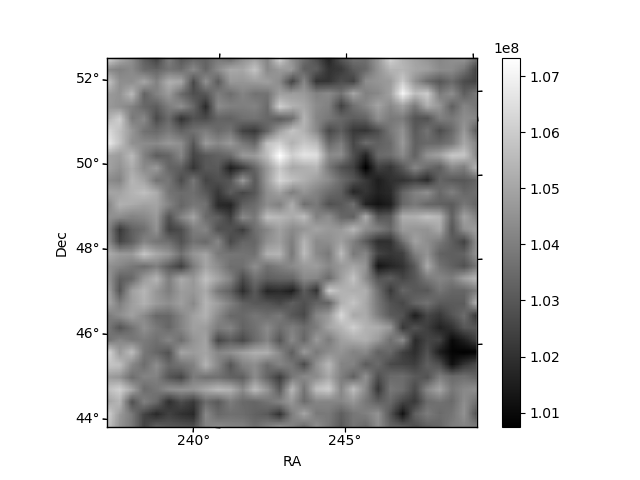
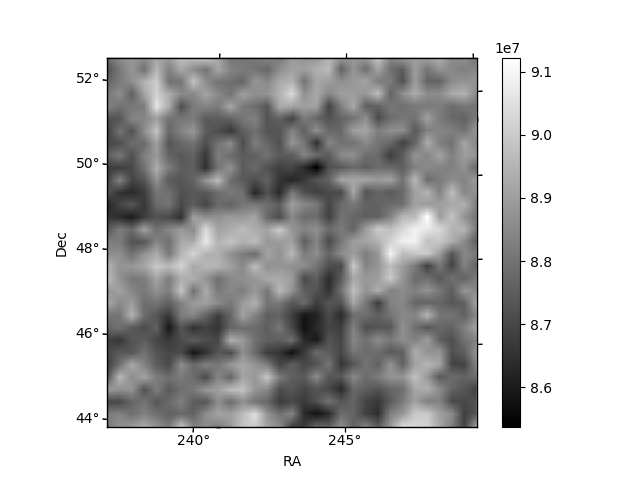
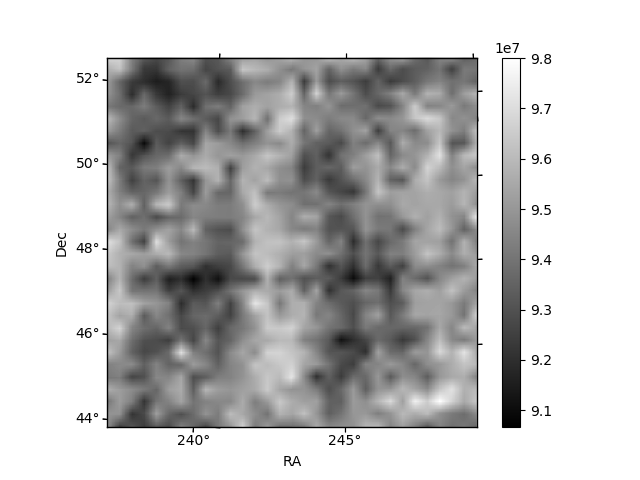
Histogram calculated using DETX and DETY for each event in the final _common_clean file
| Quadrant A | 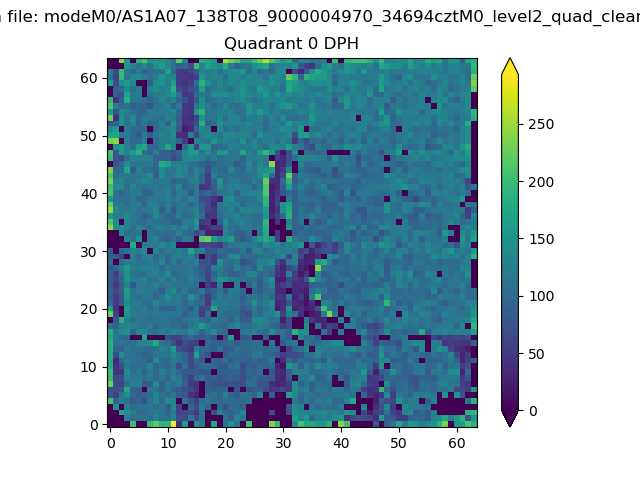 |
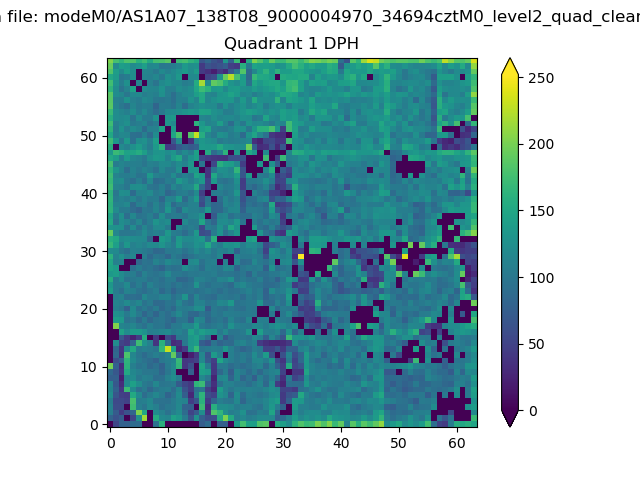 |
Quadrant B |
|---|---|---|---|
| Quadrant D | 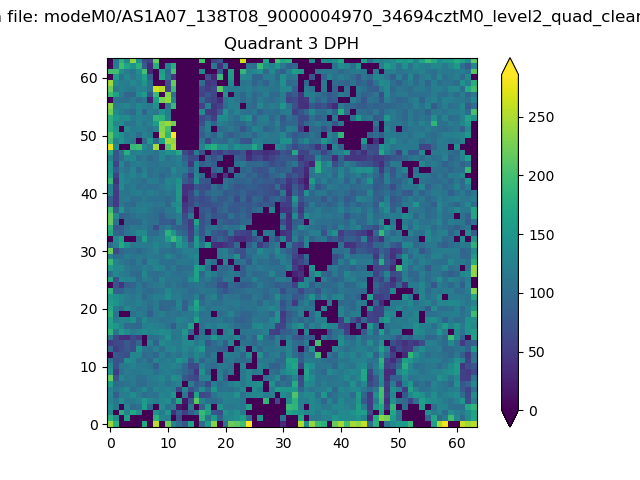 |
 |
Quadrant C |
| Plot type | Count rate plots | Images |
|---|---|---|
| Comparison with Poisson distribution Blue bars denote a histogram of data divided into 1 sec bins. Red curve is a Poisson curve with rate = median count rate of data. |
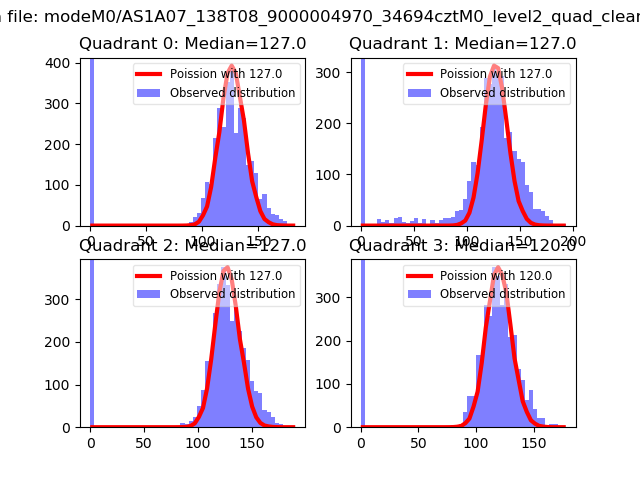 |
 |
| Quadrant-wise count rates Data is divided into 100 sec bins |
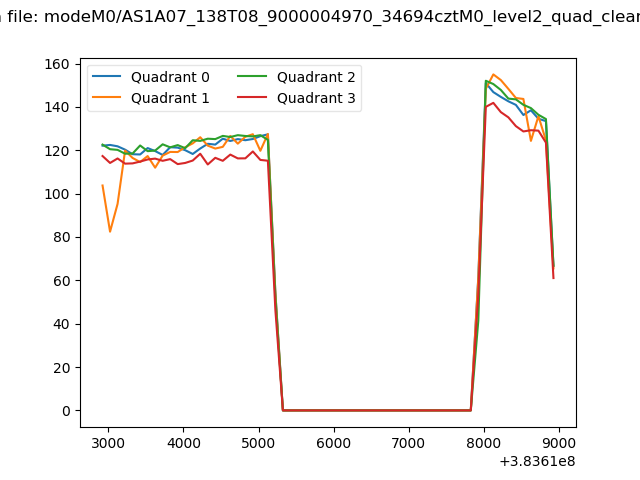 |
|
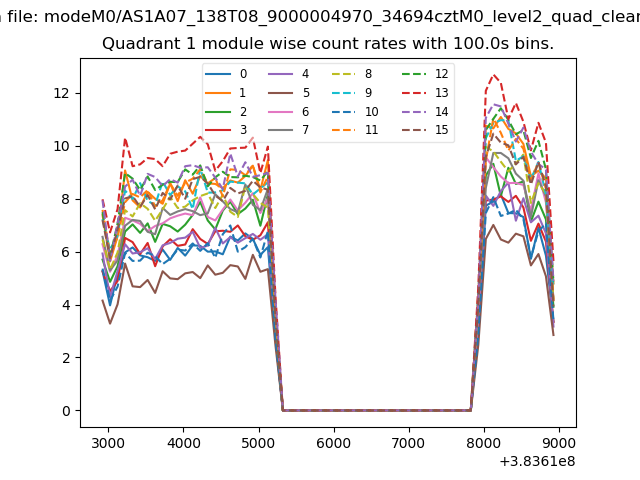
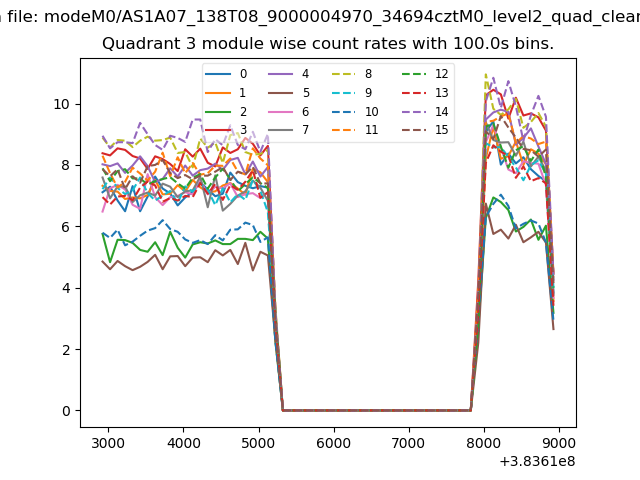
| Module-wise count rates for Quadrant A Data is divided into 100 sec bins |
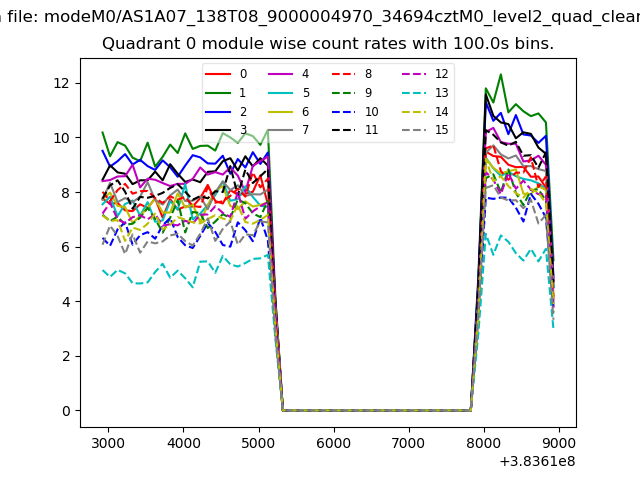 |
 |
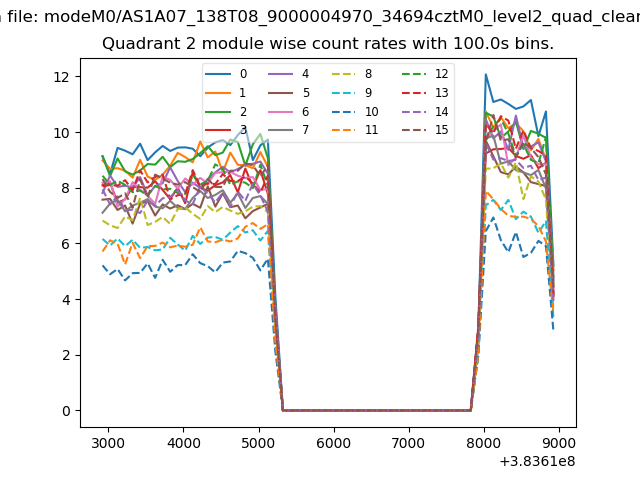
| Module-wise count rates for Quadrant B Data is divided into 100 sec bins |
 |
 |
| Module-wise count rates for Quadrant C Data is divided into 100 sec bins |
 |
 |
| Module-wise count rates for Quadrant D Data is divided into 100 sec bins |
 |
 |
| Parameter | Plot |
|---|---|
| CZT HV Monitor | 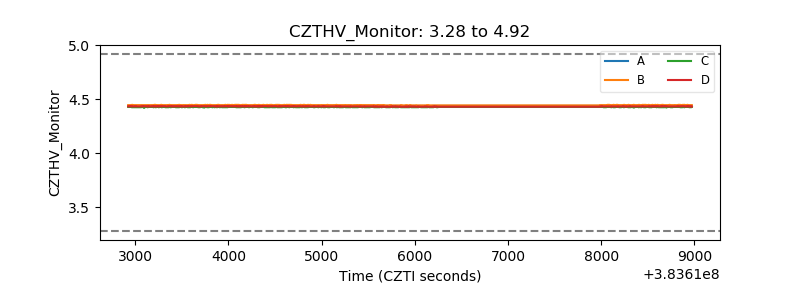 |
| D_VDD | 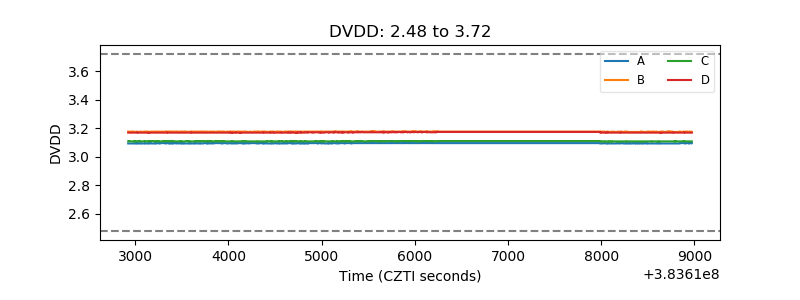 |
| Temperature 1 | 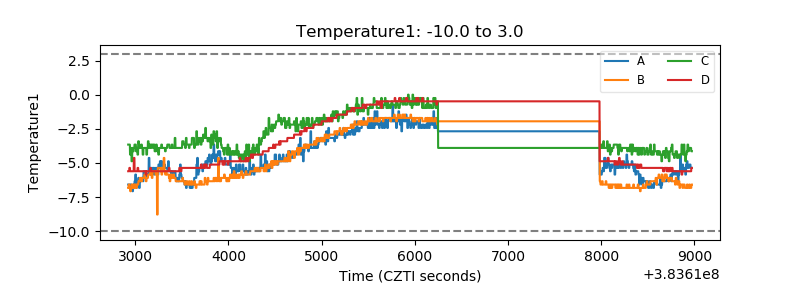 |
| Veto HV Monitor | 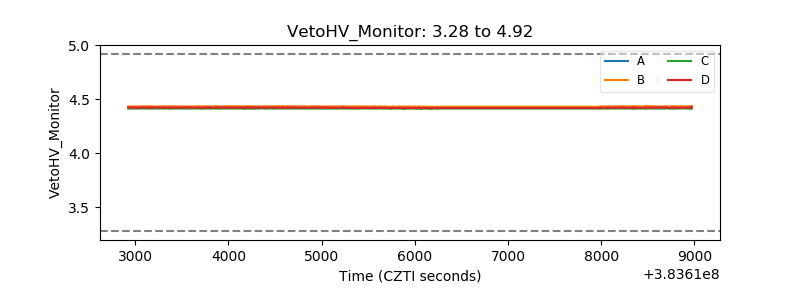 |
| Veto LLD | 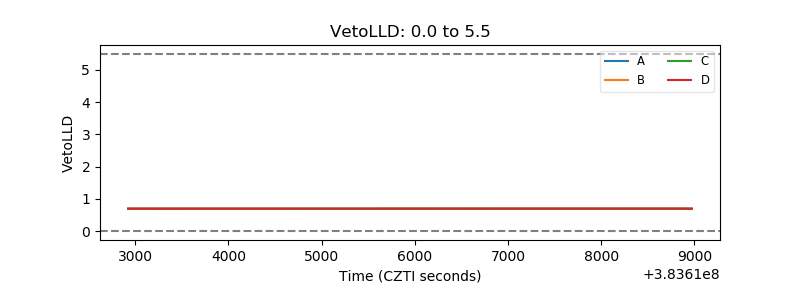 |
| Alpha Counter | 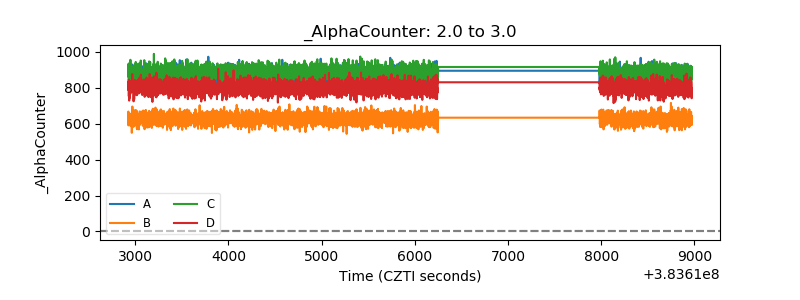 |
| _CPM_Rate | 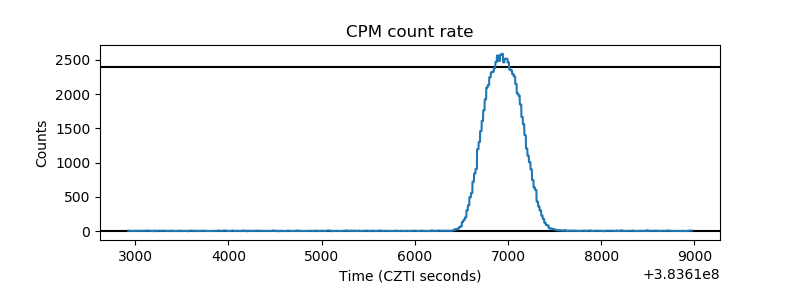 |
| CZT Counter | 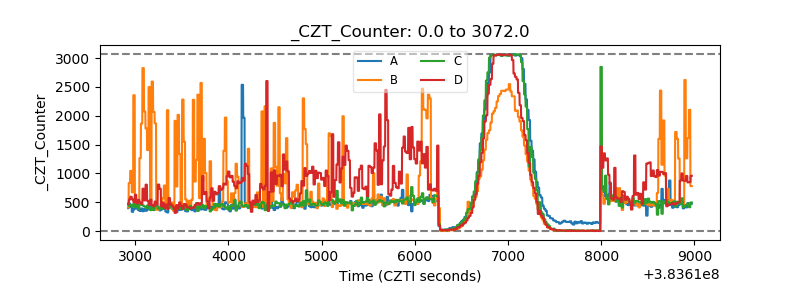 |
| +2.5 Volts monitor | 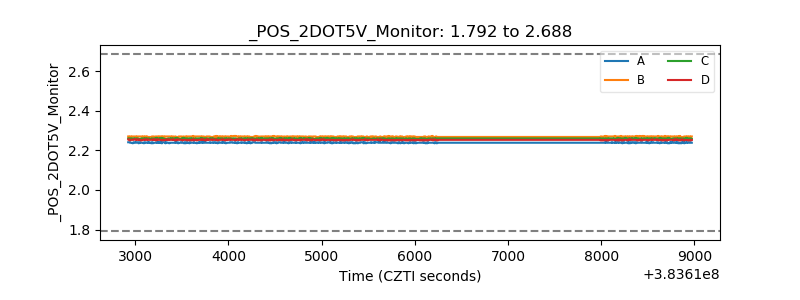 |
| +5 Volts monitor | 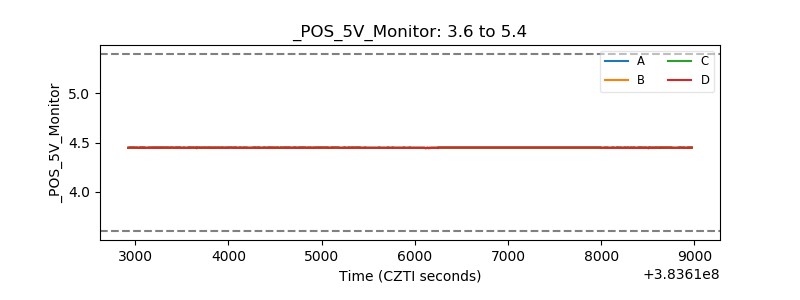 |
| _ROLL_ROT | 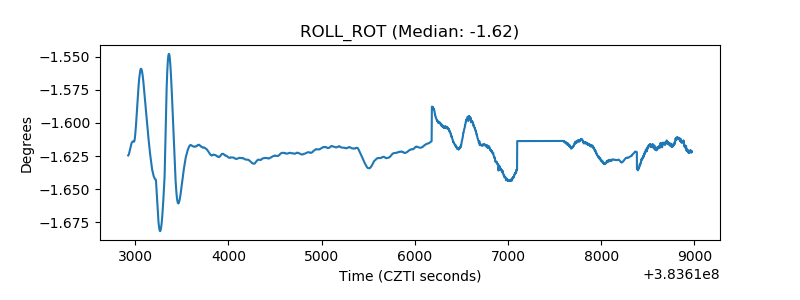 |
| _Roll_DEC | 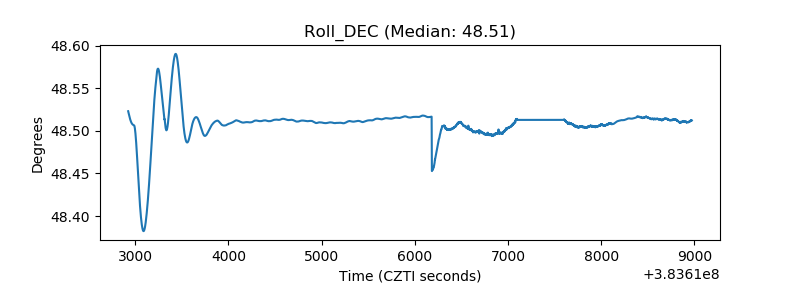 |
| _Roll_RA | 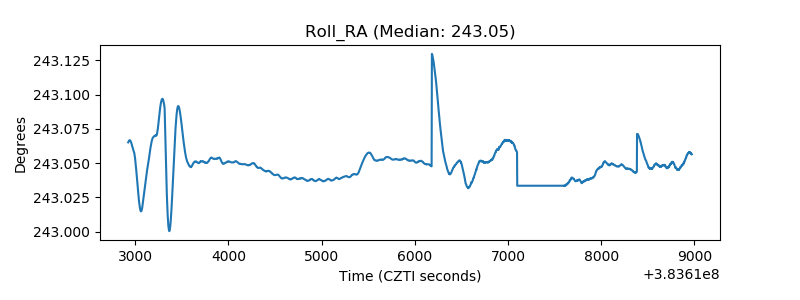 |
| Veto Counter | 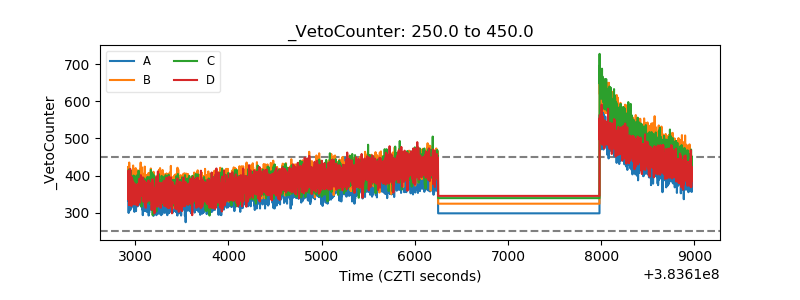 |