| Param | Original file | Final file |
|---|---|---|
| Filename | modeM0/AS1A07_093T16_9000004966cztM0_level2_bc.evt | modeM0/AS1A07_093T16_9000004966cztM0_level2_quad_clean.evt |
| Size (bytes) | 477,506,880 | 137,450,880 |
| Size | 455.4 MB | 131.1 MB |
| Events in quadrant A | 1,915,859 | 929,684 |
| Events in quadrant B | 3,393,021 | 898,420 |
| Events in quadrant C | 2,105,518 | 918,514 |
| Events in quadrant D | 6,458,418 | 821,988 |
| Mode M0 | |||
|---|---|---|---|
| Quadrant | BADHDUFLAG | Total packets | Discarded packets |
| A | 0 | 17808 | 0 |
| B | 0 | 24223 | 0 |
| C | 0 | 17618 | 0 |
| D | 0 | 33083 | 0 |
| Mode M9 | |||
|---|---|---|---|
| Quadrant | BADHDUFLAG | Total packets | Discarded packets |
| A | 0 | 26 | 0 |
| B | 0 | 26 | 0 |
| C | 0 | 26 | 0 |
| D | 0 | 26 | 0 |
| Mode SS | |||
|---|---|---|---|
| Quadrant | BADHDUFLAG | Total packets | Discarded packets |
| A | 0 | 174 | 0 |
| B | 0 | 174 | 0 |
| C | 0 | 174 | 0 |
| D | 0 | 174 | 0 |
| Quadrant | Total seconds | Saturated seconds | Saturation percentage |
|---|---|---|---|
| A | 8557 | 24 | 0.280472% |
| B | 8557 | 711 | 8.308987% |
| C | 8557 | 26 | 0.303845% |
| D | 8557 | 1002 | 11.709711% |
Noise dominated data is calculated using 1-second bins in cleaned event files. If a bin has >2000 counts, and if more than 50% of those come from <1% of pixels, then it is considered to be noise-dominated and hence unusable.
| Quadrant | # 1 sec bins | Bins with >0 counts | Bins with >2000 counts | High rate bins dominated by noise | Noise dominated (total time) | Noise dominated (detector-on time) | Marked lightcurve |
|---|---|---|---|---|---|---|---|
| A | 11151 | 8559 | 2 | 2 | 0.02% | 0.02% | 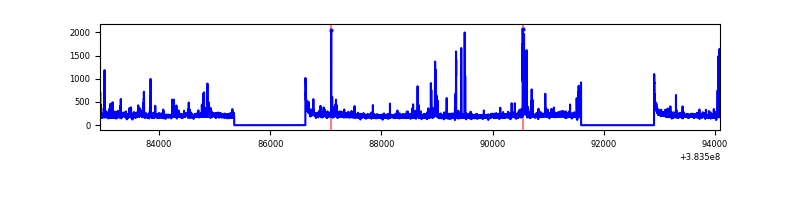 |
| B | 11151 | 8555 | 28 | 28 | 0.25% | 0.33% | 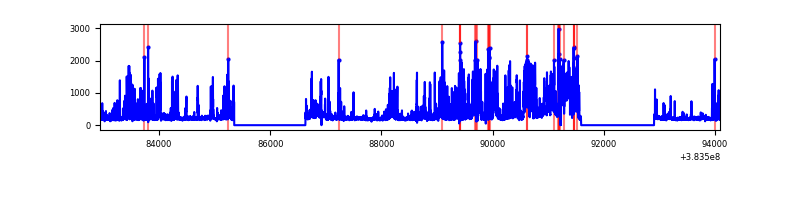 |
| C | 11151 | 8557 | 4 | 4 | 0.04% | 0.05% | 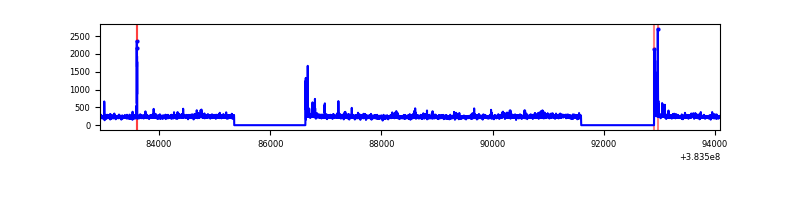 |
| D | 11151 | 8555 | 127 | 127 | 1.14% | 1.48% | 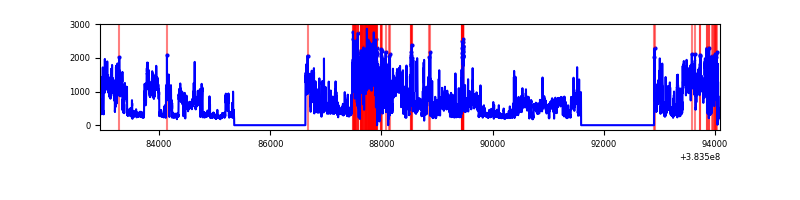 |
Top three noisy pixels from each quadrant. If the there are fewer than three noisy pixels in the level2.evt file, extra rows are filled as -1
| Pixel properties | Quadrant properties | ||||||
|---|---|---|---|---|---|---|---|
| Quadrant | DetID | PixID | Counts | Sigma | Mean | Median | Sigma |
| A | 15 | 174 | 94630 | 967.0 | 427 | 418 | 97.4 |
| A | 10 | 83 | 55053 | 560.78 | 427 | 418 | 97.4 |
| A | 9 | 143 | 37730 | 382.97 | 427 | 418 | 97.4 |
| B | 5 | 255 | 883604 | 10500.68 | 410 | 400 | 84.1 |
| B | 5 | 172 | 756952 | 8994.88 | 410 | 400 | 84.1 |
| B | 0 | 190 | 61537 | 726.88 | 410 | 400 | 84.1 |
| C | 15 | 214 | 344124 | 3482.05 | 416 | 410 | 98.7 |
| C | 0 | 10 | 50167 | 504.07 | 416 | 410 | 98.7 |
| C | 14 | 67 | 46494 | 466.86 | 416 | 410 | 98.7 |
| D | 8 | 195 | 3023507 | 29932.64 | 399 | 386 | 101.0 |
| D | 7 | 38 | 1053662 | 10428.74 | 399 | 386 | 101.0 |
| D | 2 | 250 | 265161 | 2621.6 | 399 | 386 | 101.0 |
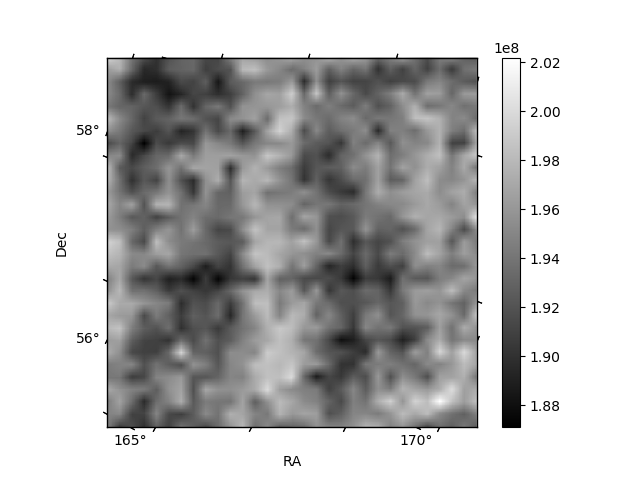
Histogram calculated using DETX and DETY for each event in the final _common_clean file
| Quadrant A |  |
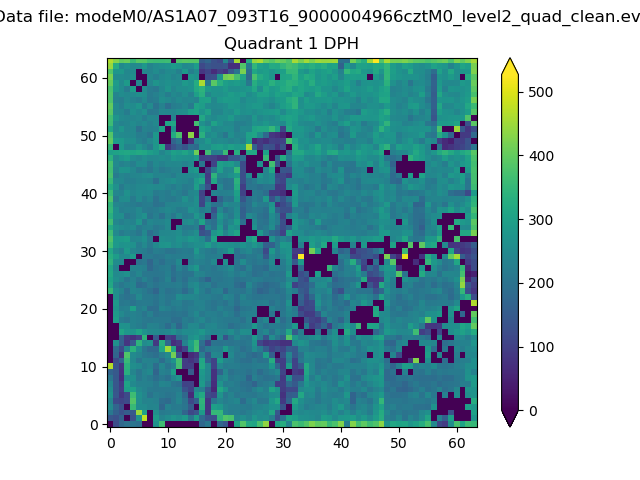 |
Quadrant B |
|---|---|---|---|
| Quadrant D | 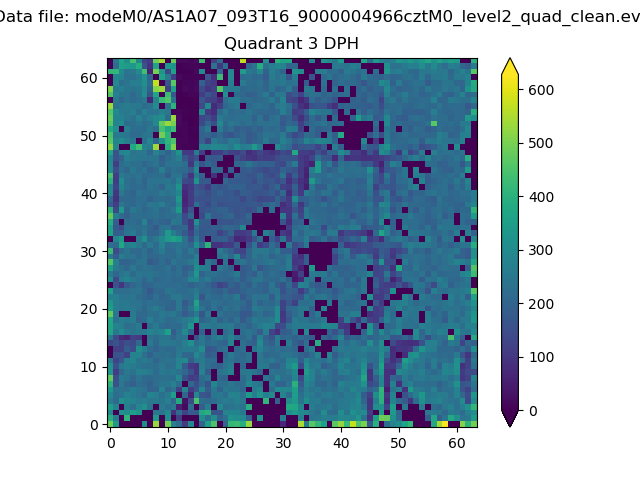 |
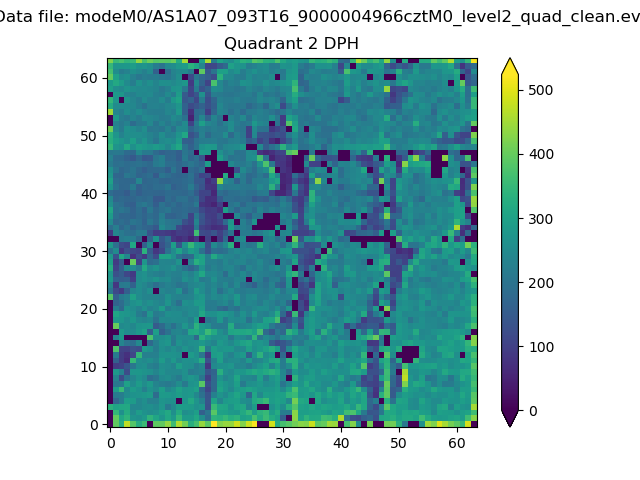 |
Quadrant C |
| Plot type | Count rate plots | Images |
|---|---|---|
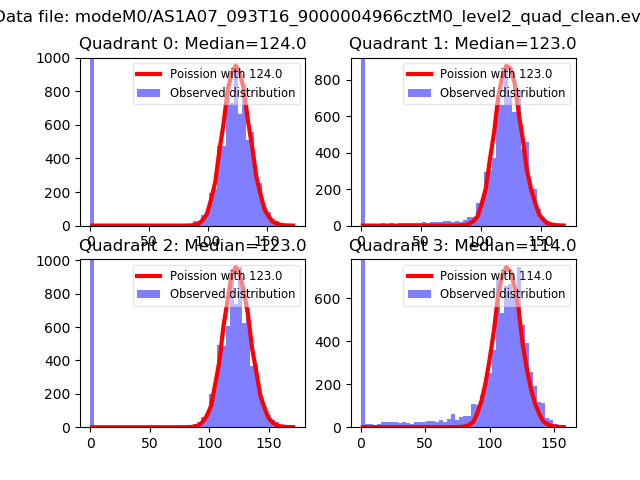
| Comparison with Poisson distribution Blue bars denote a histogram of data divided into 1 sec bins. Red curve is a Poisson curve with rate = median count rate of data. |
 |
 |
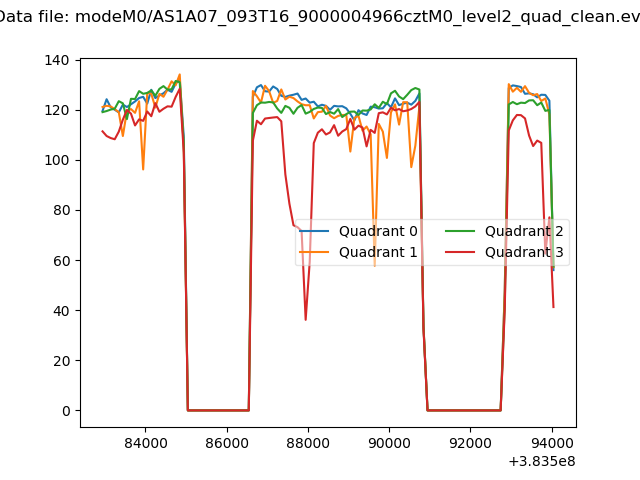
| Quadrant-wise count rates Data is divided into 100 sec bins |
 |
|
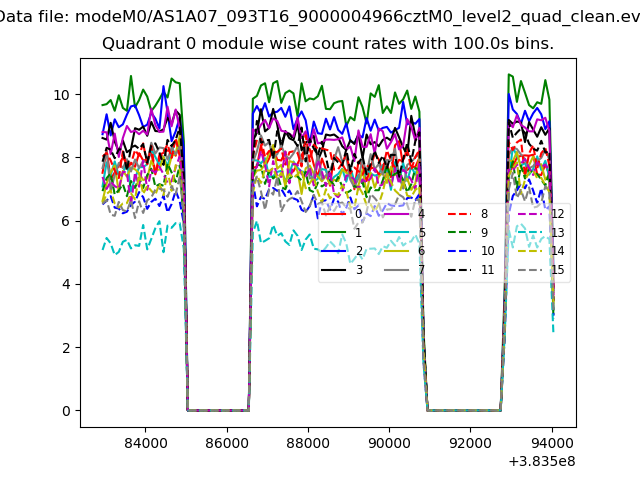
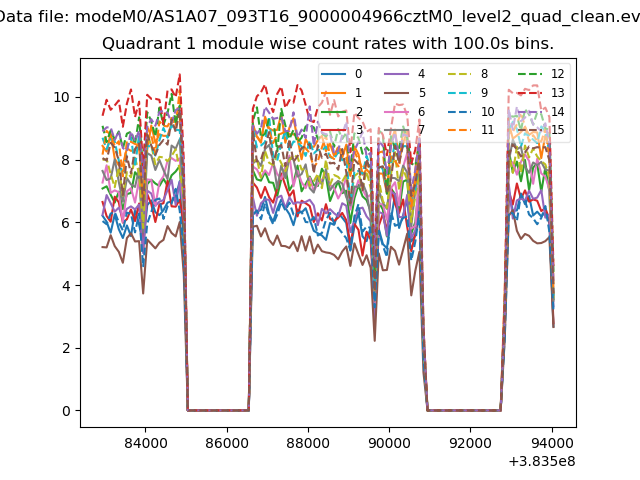
| Module-wise count rates for Quadrant A Data is divided into 100 sec bins |
 |
 |
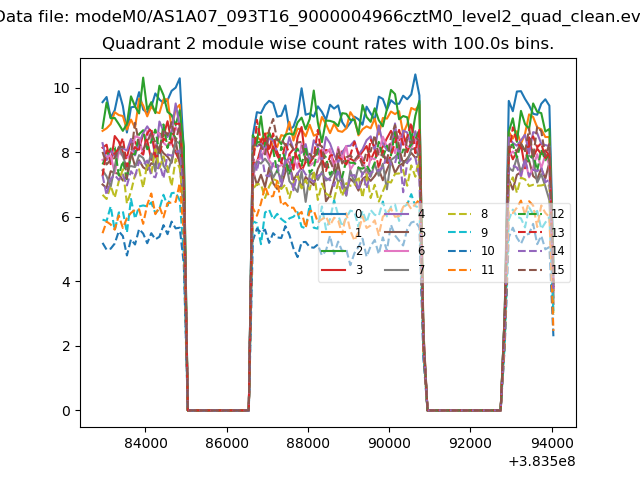
| Module-wise count rates for Quadrant B Data is divided into 100 sec bins |
 |
 |
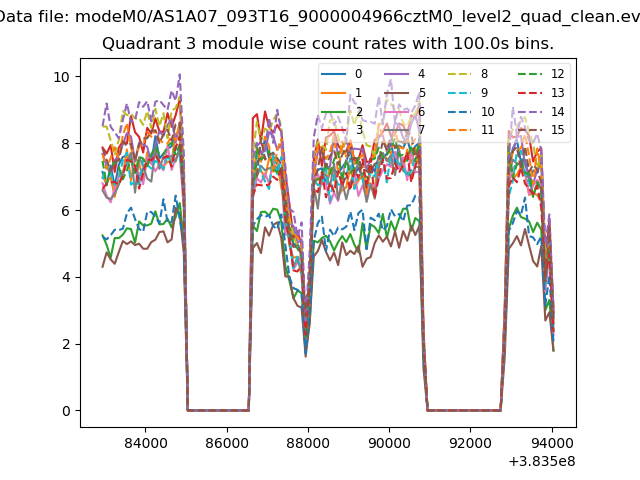
| Module-wise count rates for Quadrant C Data is divided into 100 sec bins |
 |
 |
| Module-wise count rates for Quadrant D Data is divided into 100 sec bins |
 |
 |
| Parameter | Plot |
|---|---|
| CZT HV Monitor | 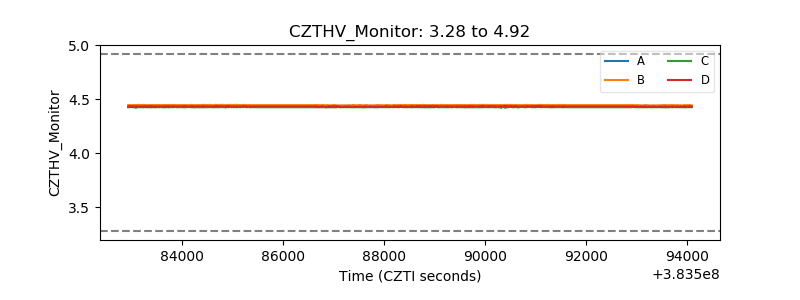 |
| D_VDD | 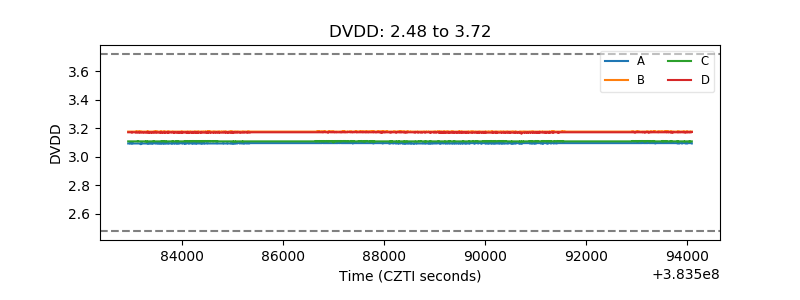 |
| Temperature 1 | 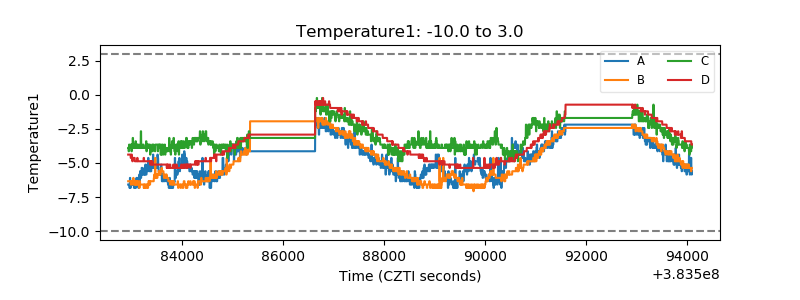 |
| Veto HV Monitor | 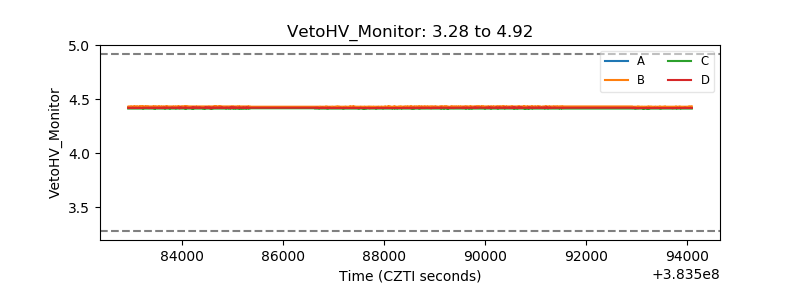 |
| Veto LLD | 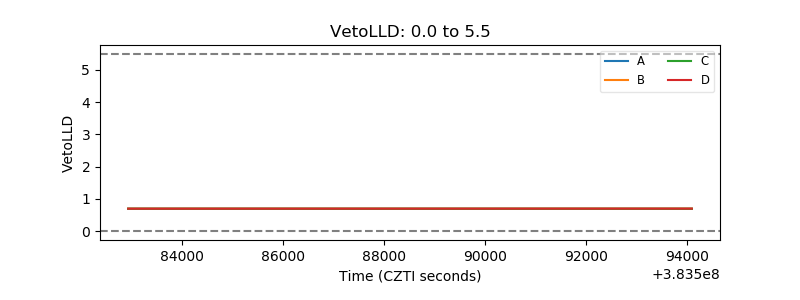 |
| Alpha Counter | 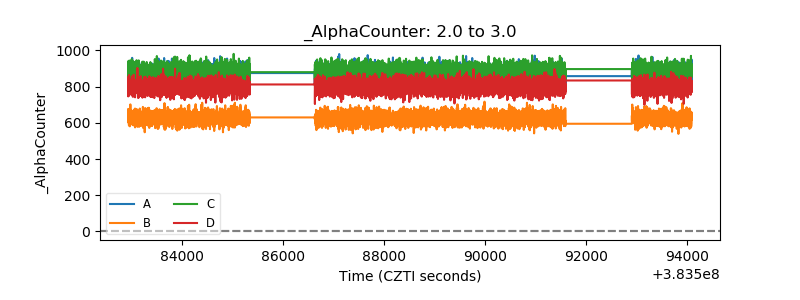 |
| _CPM_Rate | 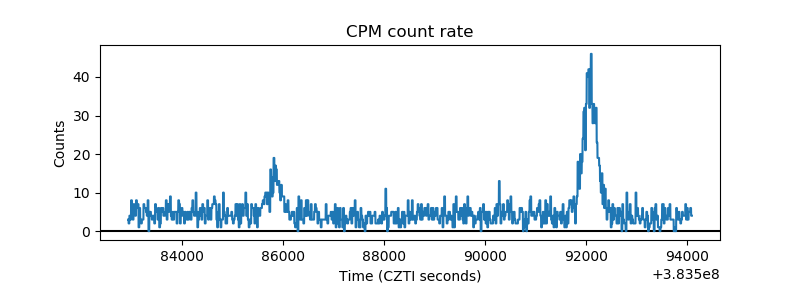 |
| CZT Counter | 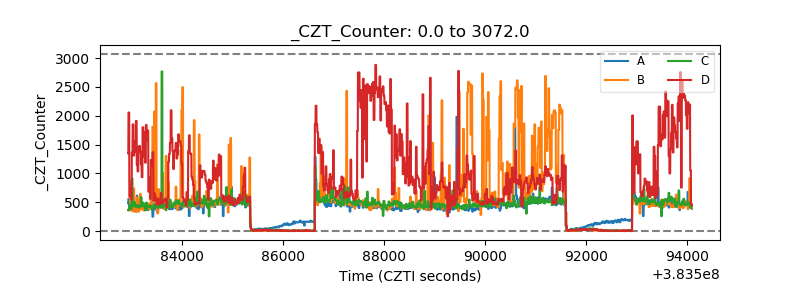 |
| +2.5 Volts monitor | 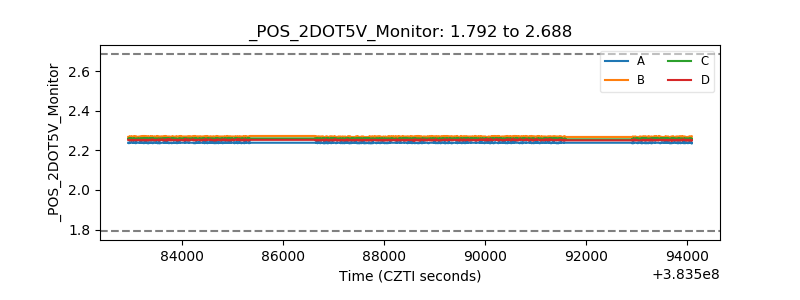 |
| +5 Volts monitor | 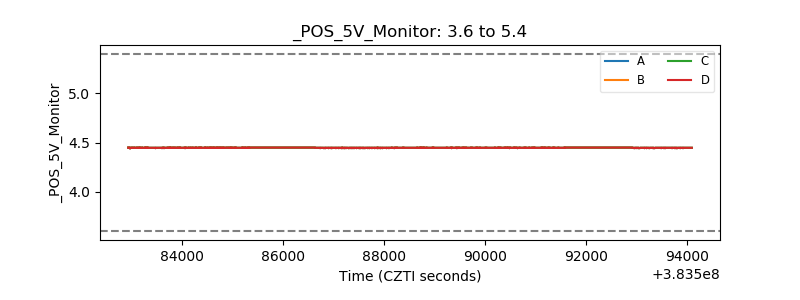 |
| _ROLL_ROT | 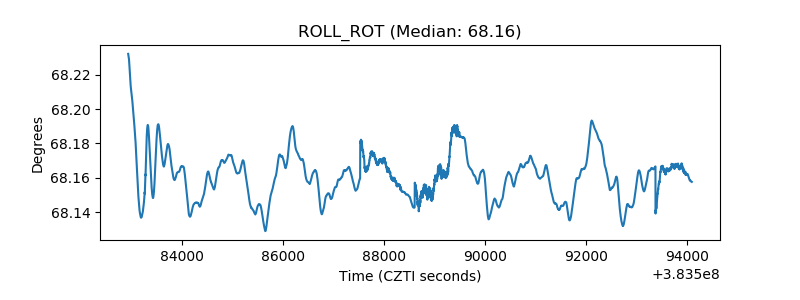 |
| _Roll_DEC | 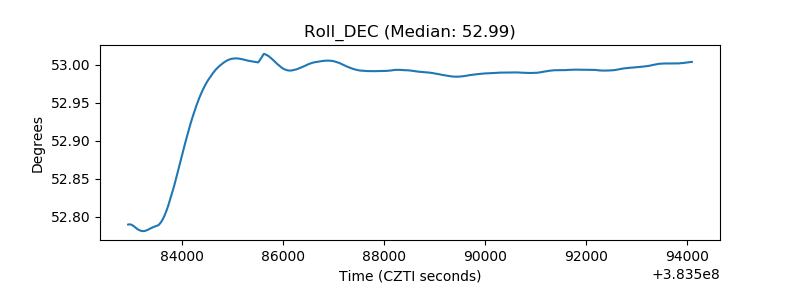 |
| _Roll_RA | 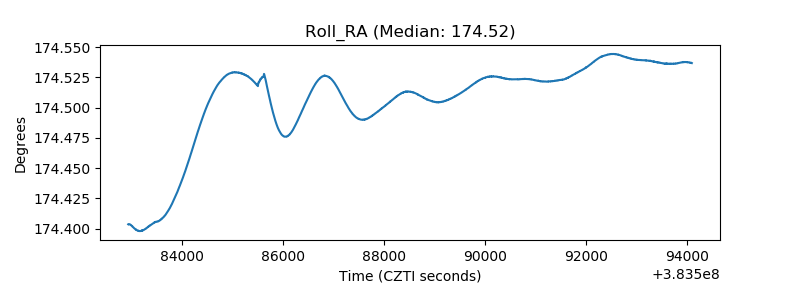 |
| Veto Counter | 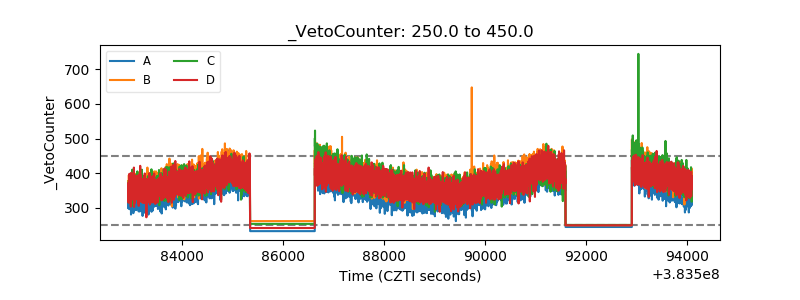 |