| Param | Original file | Final file |
|---|---|---|
| Filename | modeM0/AS1T04_078T01_9000004962_34681cztM0_level2.evt | modeM0/AS1T04_078T01_9000004962_34681cztM0_level2_quad_clean.evt |
| Size (bytes) | 886,285,440 | 109,126,080 |
| Size | 845.2 MB | 104.1 MB |
| Events in quadrant A | 5,044,601 | 678,757 |
| Events in quadrant B | 6,974,942 | 672,274 |
| Events in quadrant C | 4,974,483 | 677,032 |
| Events in quadrant D | 9,218,241 | 629,574 |
| Mode M0 | |||
|---|---|---|---|
| Quadrant | BADHDUFLAG | Total packets | Discarded packets |
| A | 0 | 20880 | 3 |
| B | 0 | 26521 | 2 |
| C | 0 | 20132 | 2 |
| D | 0 | 33818 | 2 |
| Mode M9 | |||
|---|---|---|---|
| Quadrant | BADHDUFLAG | Total packets | Discarded packets |
| A | 0 | 37 | 0 |
| B | 0 | 37 | 0 |
| C | 0 | 37 | 0 |
| D | 0 | 37 | 0 |
| Mode SS | |||
|---|---|---|---|
| Quadrant | BADHDUFLAG | Total packets | Discarded packets |
| A | 0 | 192 | 0 |
| B | 0 | 192 | 0 |
| C | 0 | 192 | 0 |
| D | 0 | 192 | 0 |
| Quadrant | Total seconds | Saturated seconds | Saturation percentage |
|---|---|---|---|
| A | 9323 | 69 | 0.740105% |
| B | 9323 | 750 | 8.044621% |
| C | 9323 | 38 | 0.407594% |
| D | 9323 | 462 | 4.955486% |
Noise dominated data is calculated using 1-second bins in cleaned event files. If a bin has >2000 counts, and if more than 50% of those come from <1% of pixels, then it is considered to be noise-dominated and hence unusable.
| Quadrant | # 1 sec bins | Bins with >0 counts | Bins with >2000 counts | High rate bins dominated by noise | Noise dominated (total time) | Noise dominated (detector-on time) | Marked lightcurve |
|---|---|---|---|---|---|---|---|
| A | 13087 | 9325 | 45 | 45 | 0.34% | 0.48% | 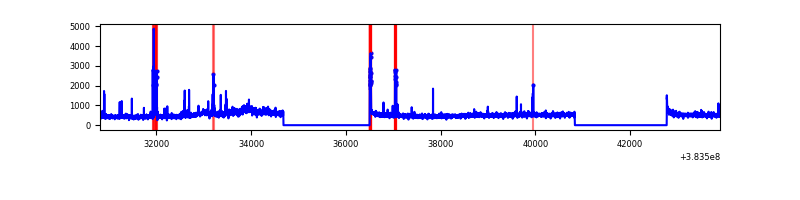 |
| B | 13087 | 9325 | 565 | 565 | 4.32% | 6.06% | 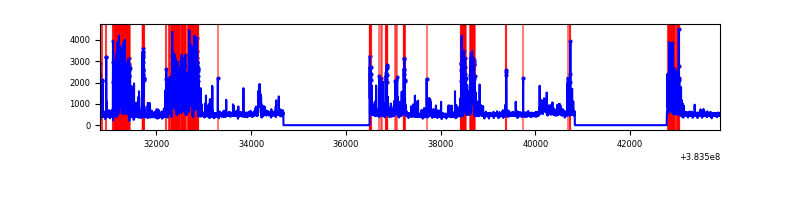 |
| C | 13087 | 9325 | 26 | 26 | 0.20% | 0.28% | 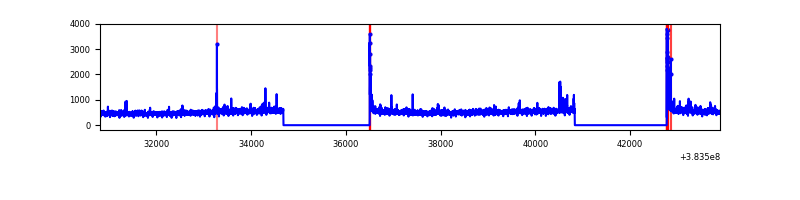 |
| D | 13087 | 9325 | 319 | 319 | 2.44% | 3.42% | 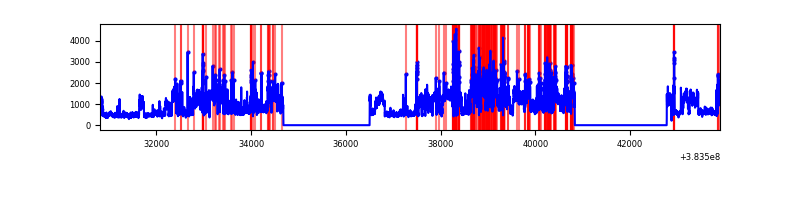 |
Top three noisy pixels from each quadrant. If the there are fewer than three noisy pixels in the level2.evt file, extra rows are filled as -1
| Pixel properties | Quadrant properties | ||||||
|---|---|---|---|---|---|---|---|
| Quadrant | DetID | PixID | Counts | Sigma | Mean | Median | Sigma |
| A | 15 | 169 | 404702 | 1796.5 | 1137 | 1116 | 224.7 |
| A | 15 | 174 | 92038 | 404.73 | 1137 | 1116 | 224.7 |
| A | 10 | 83 | 55446 | 241.84 | 1137 | 1116 | 224.7 |
| B | 5 | 172 | 1953872 | 9464.73 | 1093 | 1067 | 206.3 |
| B | 5 | 255 | 372720 | 1801.3 | 1093 | 1067 | 206.3 |
| B | 0 | 190 | 200465 | 966.43 | 1093 | 1067 | 206.3 |
| C | 15 | 214 | 389022 | 1543.68 | 1090 | 1098 | 251.3 |
| C | 0 | 10 | 120516 | 475.2 | 1090 | 1098 | 251.3 |
| C | 14 | 67 | 112477 | 443.21 | 1090 | 1098 | 251.3 |
| D | 8 | 195 | 3770968 | 14532.53 | 1078 | 1052 | 259.4 |
| D | 2 | 249 | 557051 | 2143.3 | 1078 | 1052 | 259.4 |
| D | 12 | 233 | 184461 | 707.02 | 1078 | 1052 | 259.4 |
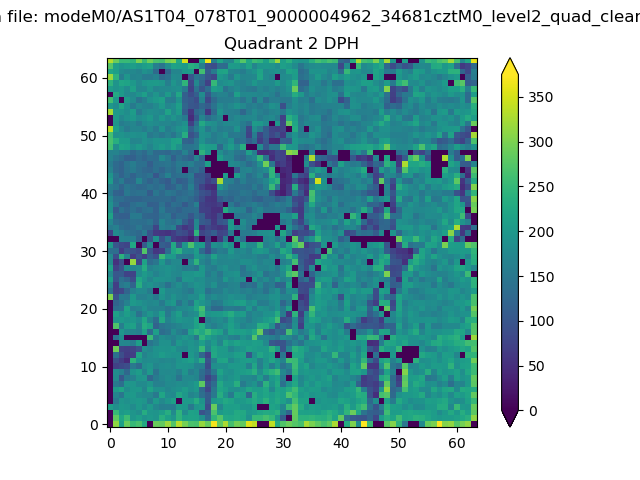
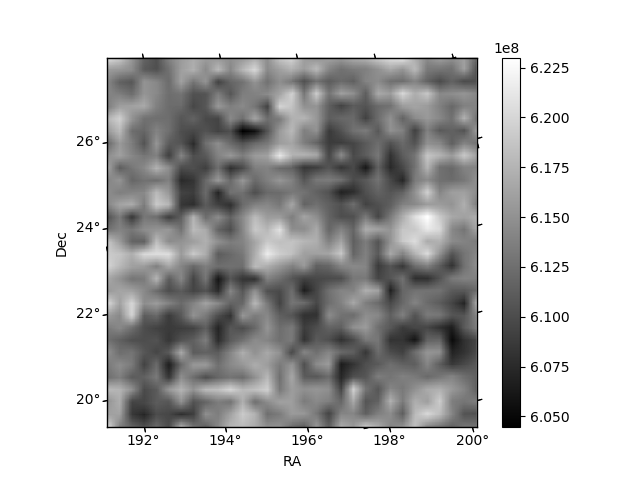
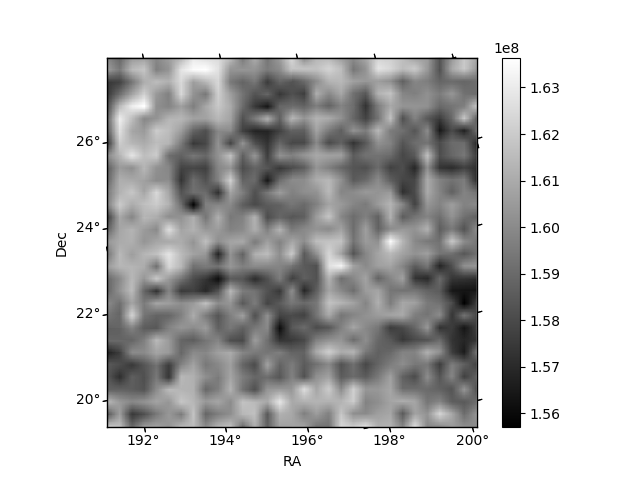
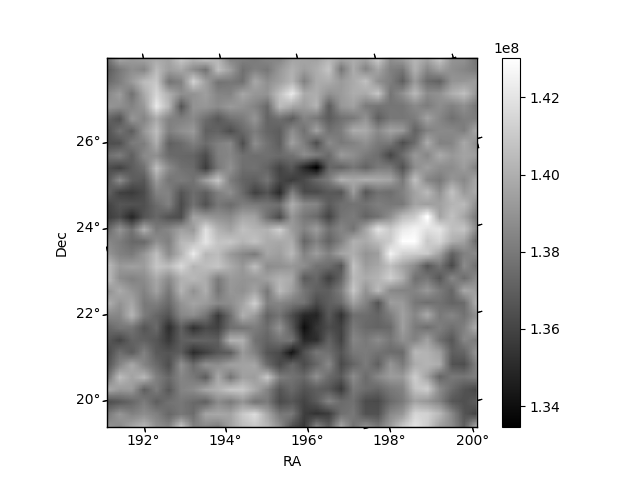
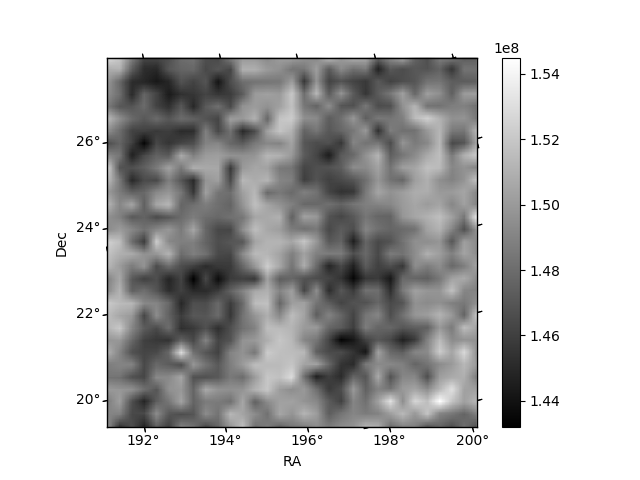
Histogram calculated using DETX and DETY for each event in the final _common_clean file
| Quadrant A | 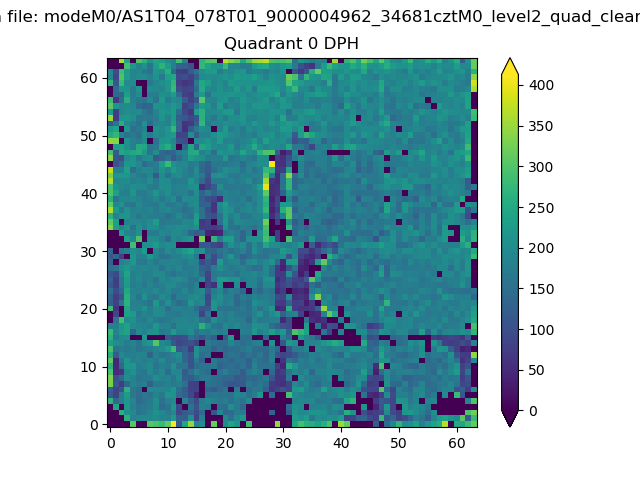 |
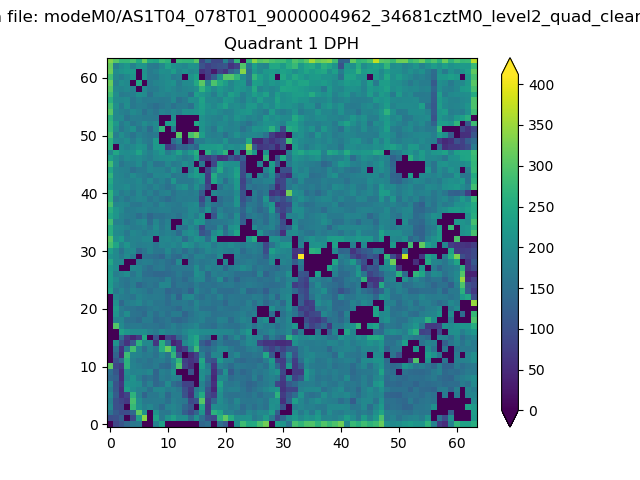 |
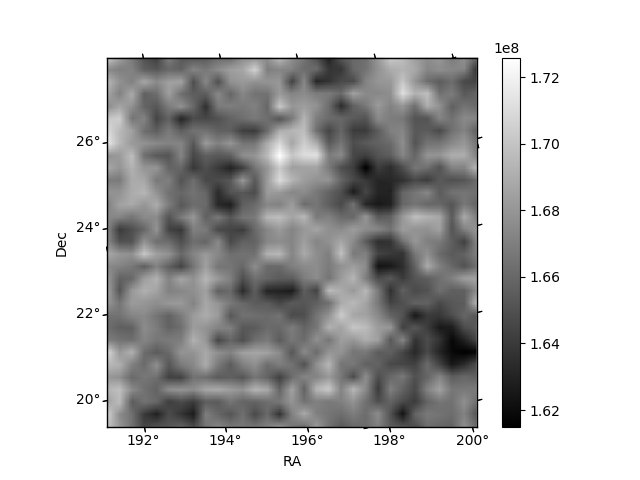
Quadrant B |
|---|---|---|---|
| Quadrant D | 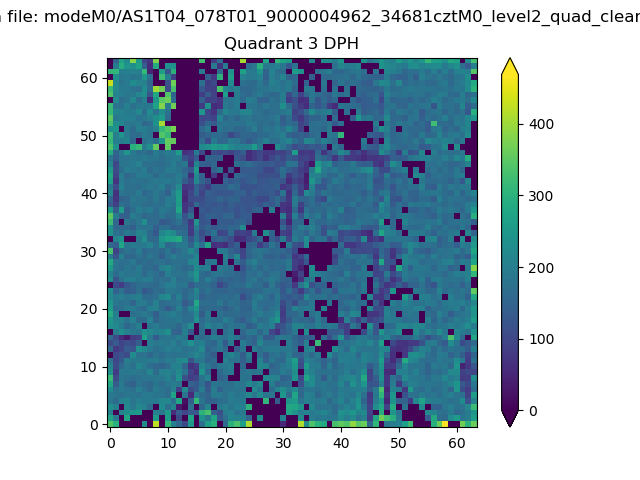 |
 |
Quadrant C |
| Plot type | Count rate plots | Images |
|---|---|---|
| Comparison with Poisson distribution Blue bars denote a histogram of data divided into 1 sec bins. Red curve is a Poisson curve with rate = median count rate of data. |
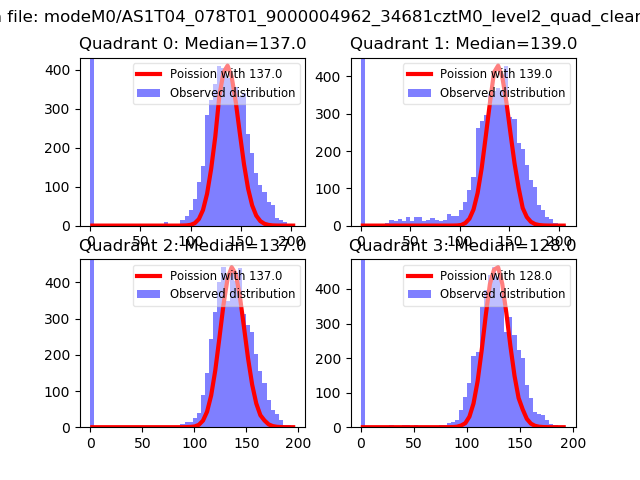 |
 |
| Quadrant-wise count rates Data is divided into 100 sec bins |
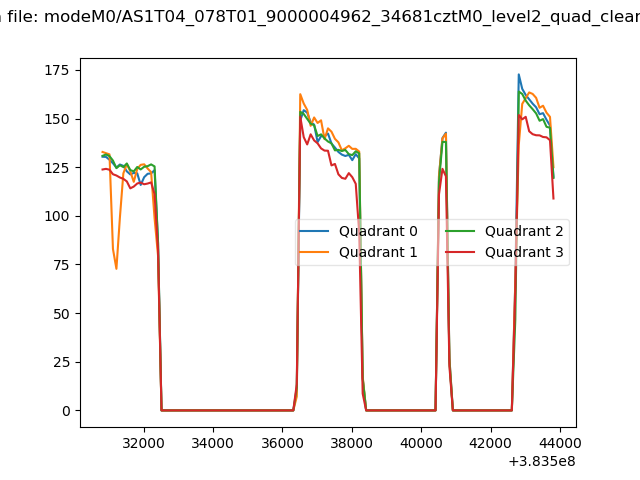 |
|
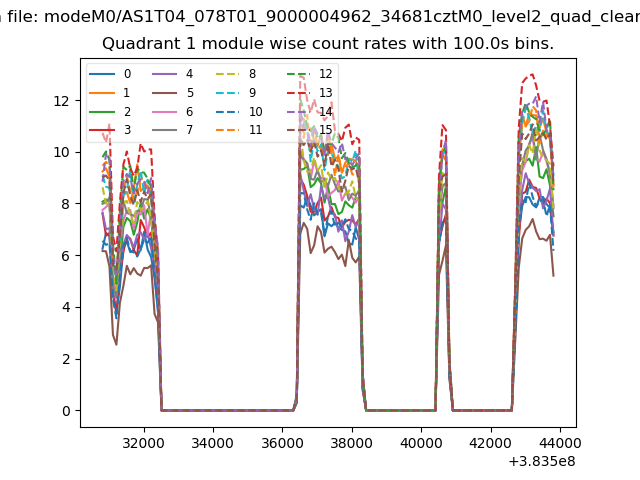
| Module-wise count rates for Quadrant A Data is divided into 100 sec bins |
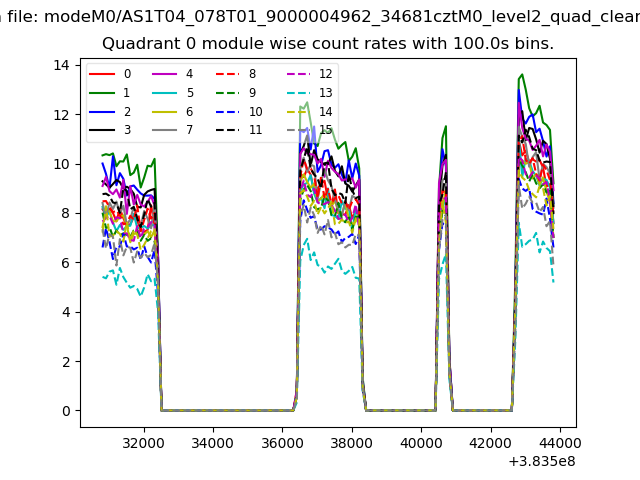 |
 |
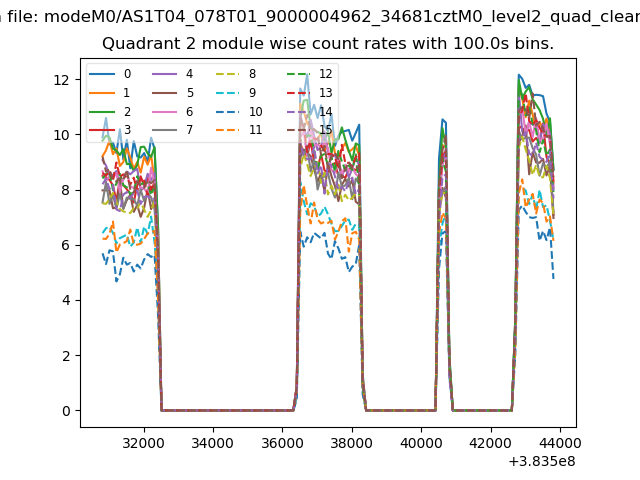
| Module-wise count rates for Quadrant B Data is divided into 100 sec bins |
 |
 |
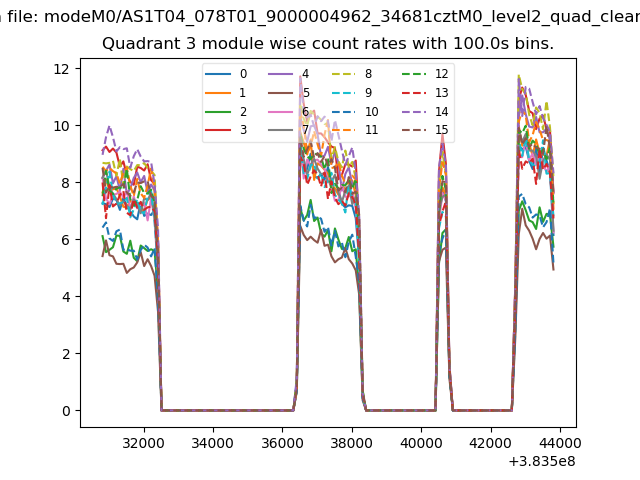
| Module-wise count rates for Quadrant C Data is divided into 100 sec bins |
 |
 |
| Module-wise count rates for Quadrant D Data is divided into 100 sec bins |
 |
 |
| Parameter | Plot |
|---|---|
| CZT HV Monitor | 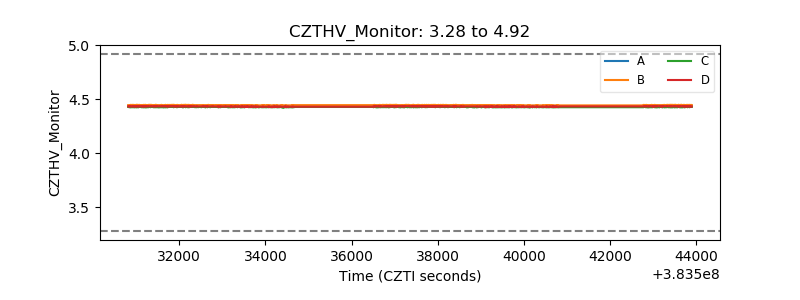 |
| D_VDD |  |
| Temperature 1 | 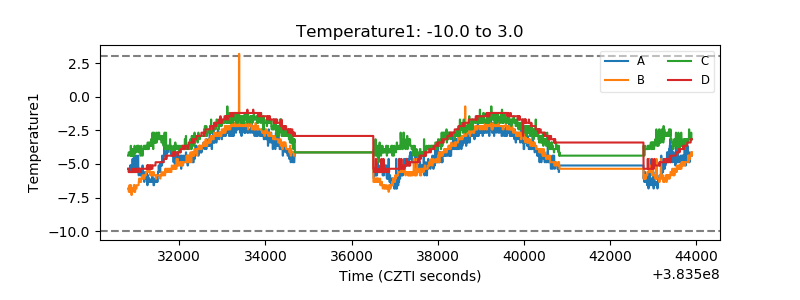 |
| Veto HV Monitor | 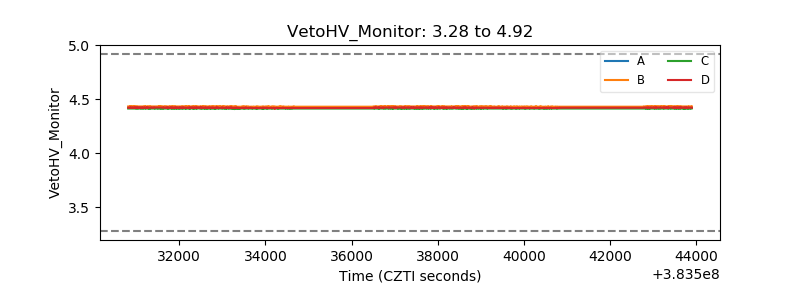 |
| Veto LLD | 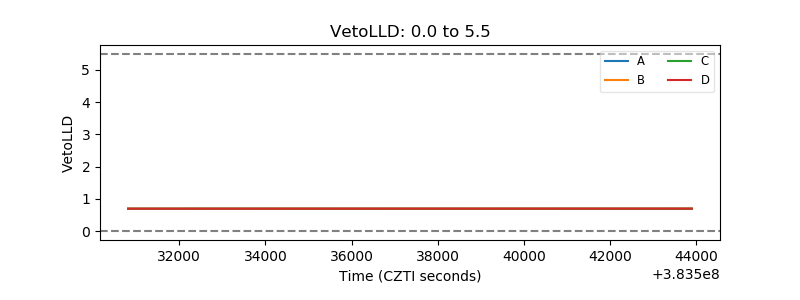 |
| Alpha Counter | 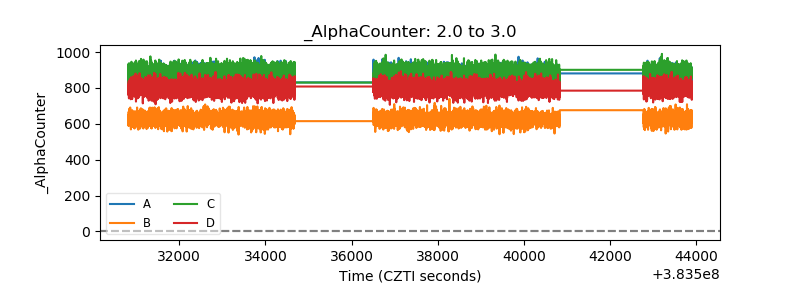 |
| _CPM_Rate | 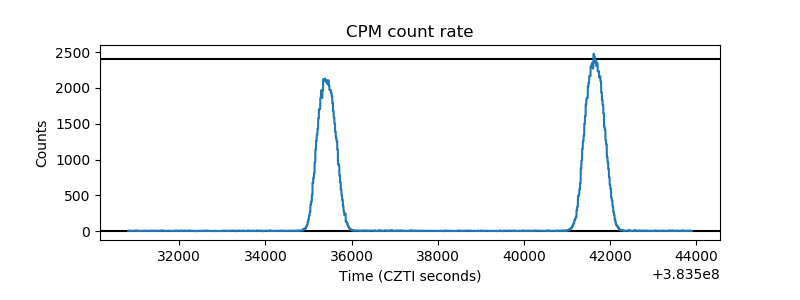 |
| CZT Counter | 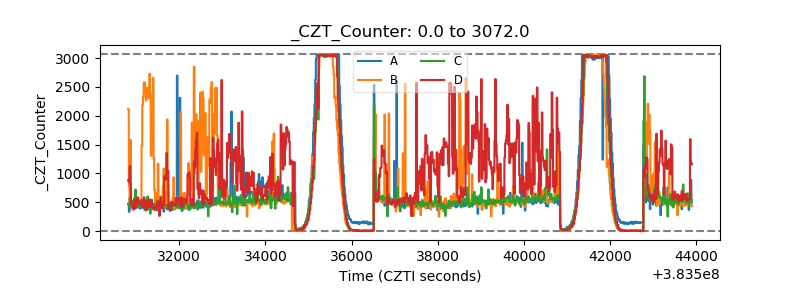 |
| +2.5 Volts monitor | 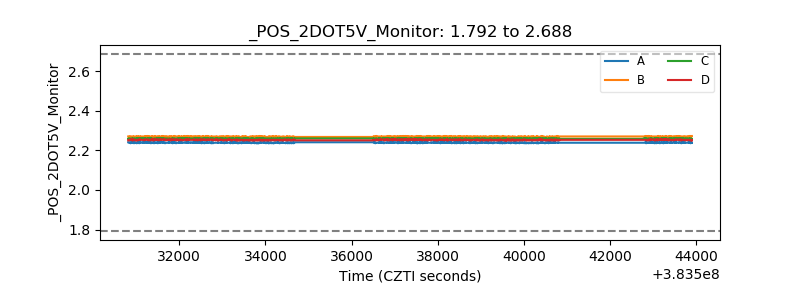 |
| +5 Volts monitor | 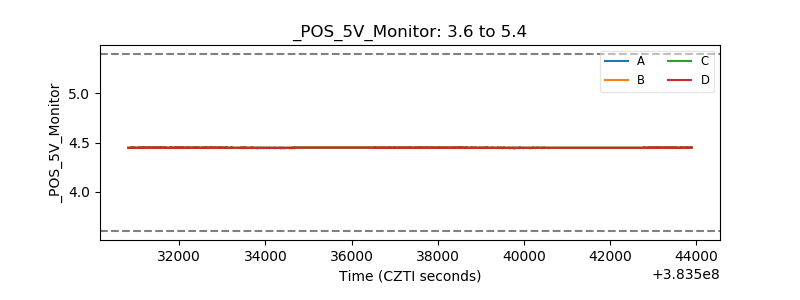 |
| _ROLL_ROT | 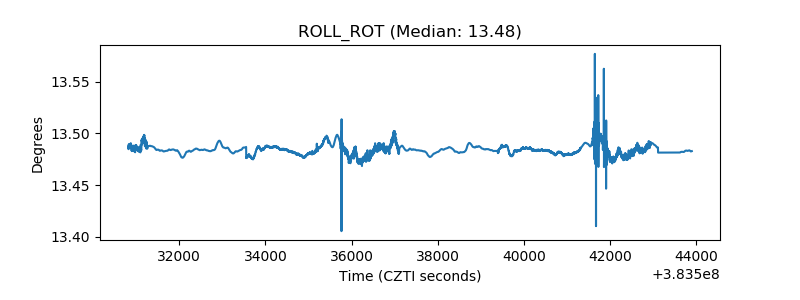 |
| _Roll_DEC | 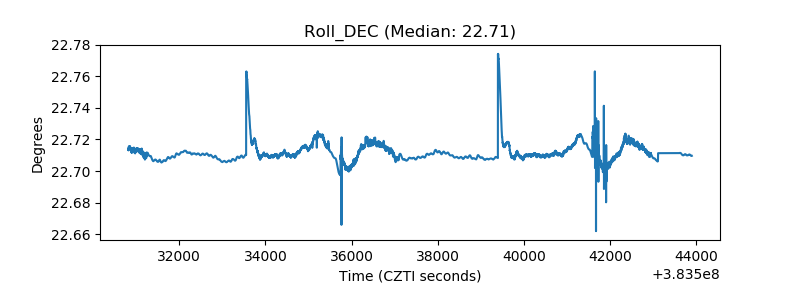 |
| _Roll_RA | 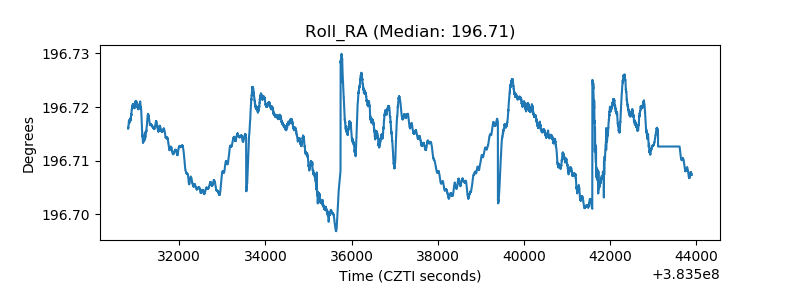 |
| Veto Counter | 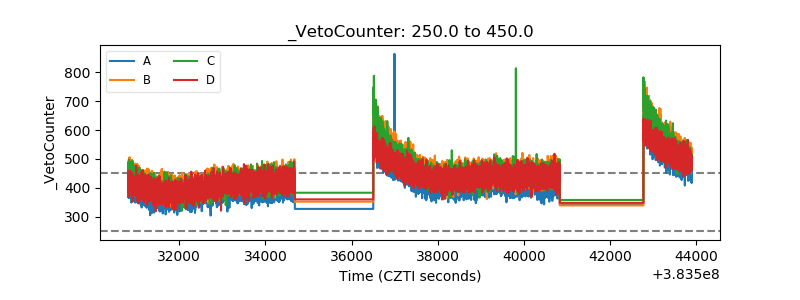 |