| Param | Original file | Final file |
|---|---|---|
| Filename | modeM0/AS1A11_065T13_9000004960_34676cztM0_level2.evt | modeM0/AS1A11_065T13_9000004960_34676cztM0_level2_quad_clean.evt |
| Size (bytes) | 567,262,080 | 74,376,000 |
| Size | 541.0 MB | 70.9 MB |
| Events in quadrant A | 3,334,936 | 477,240 |
| Events in quadrant B | 4,102,188 | 476,663 |
| Events in quadrant C | 3,053,419 | 467,948 |
| Events in quadrant D | 6,292,092 | 420,138 |
| Mode M9 | |||
|---|---|---|---|
| Quadrant | BADHDUFLAG | Total packets | Discarded packets |
| A | 0 | 20 | 0 |
| B | 0 | 20 | 0 |
| C | 0 | 20 | 0 |
| D | 0 | 21 | 0 |
| Mode M0 | |||
|---|---|---|---|
| Quadrant | BADHDUFLAG | Total packets | Discarded packets |
| A | 0 | 13754 | 2 |
| B | 0 | 16014 | 2 |
| C | 0 | 12544 | 2 |
| D | 0 | 22837 | 2 |
| Mode SS | |||
|---|---|---|---|
| Quadrant | BADHDUFLAG | Total packets | Discarded packets |
| A | 0 | 118 | 0 |
| B | 0 | 118 | 0 |
| C | 0 | 118 | 0 |
| D | 0 | 118 | 0 |
| Quadrant | Total seconds | Saturated seconds | Saturation percentage |
|---|---|---|---|
| A | 5869 | 139 | 2.368376% |
| B | 5869 | 319 | 5.435338% |
| C | 5869 | 64 | 1.090475% |
| D | 5869 | 558 | 9.507582% |
Noise dominated data is calculated using 1-second bins in cleaned event files. If a bin has >2000 counts, and if more than 50% of those come from <1% of pixels, then it is considered to be noise-dominated and hence unusable.
| Quadrant | # 1 sec bins | Bins with >0 counts | Bins with >2000 counts | High rate bins dominated by noise | Noise dominated (total time) | Noise dominated (detector-on time) | Marked lightcurve |
|---|---|---|---|---|---|---|---|
| A | 7212 | 5870 | 98 | 98 | 1.36% | 1.67% | 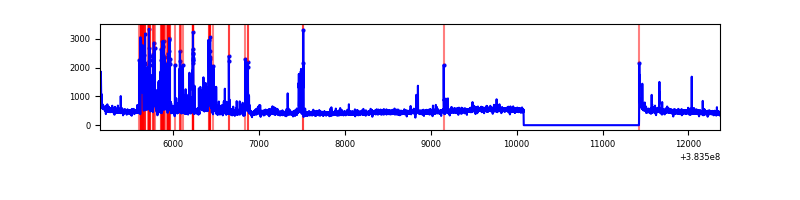 |
| B | 7212 | 5870 | 208 | 208 | 2.88% | 3.54% | 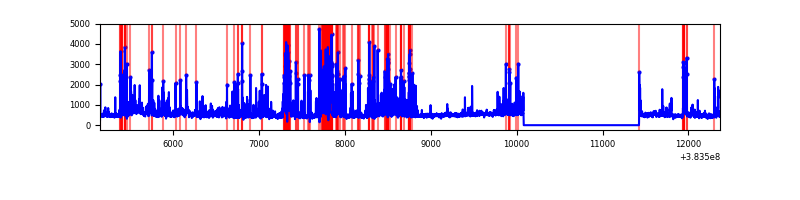 |
| C | 7212 | 5870 | 37 | 37 | 0.51% | 0.63% | 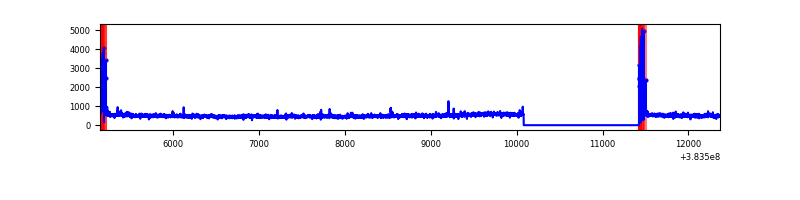 |
| D | 7212 | 5870 | 458 | 458 | 6.35% | 7.80% | 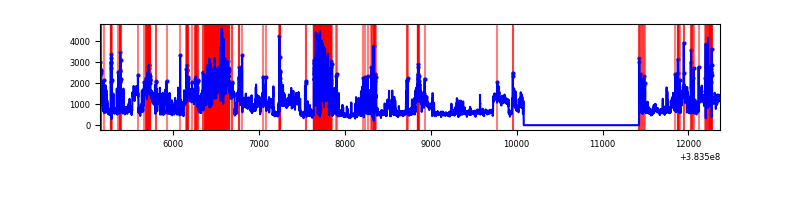 |
Top three noisy pixels from each quadrant. If the there are fewer than three noisy pixels in the level2.evt file, extra rows are filled as -1
| Pixel properties | Quadrant properties | ||||||
|---|---|---|---|---|---|---|---|
| Quadrant | DetID | PixID | Counts | Sigma | Mean | Median | Sigma |
| A | 15 | 169 | 612366 | 4540.56 | 669 | 654 | 134.7 |
| A | 10 | 83 | 51463 | 377.14 | 669 | 654 | 134.7 |
| A | 13 | 6 | 25891 | 187.33 | 669 | 654 | 134.7 |
| B | 5 | 172 | 1032148 | 8067.25 | 659 | 642 | 127.9 |
| B | 5 | 255 | 219106 | 1708.57 | 659 | 642 | 127.9 |
| B | 0 | 190 | 125717 | 978.19 | 659 | 642 | 127.9 |
| C | 15 | 214 | 252710 | 1657.01 | 653 | 658 | 152.1 |
| C | 0 | 10 | 163025 | 1067.41 | 653 | 658 | 152.1 |
| C | 14 | 67 | 65119 | 423.77 | 653 | 658 | 152.1 |
| D | 8 | 195 | 2021639 | 12547.27 | 629 | 613 | 161.1 |
| D | 7 | 38 | 643865 | 3993.54 | 629 | 613 | 161.1 |
| D | 2 | 249 | 595899 | 3695.75 | 629 | 613 | 161.1 |
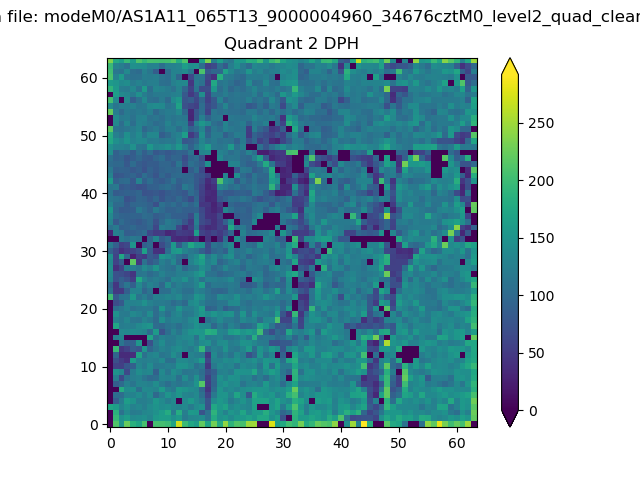
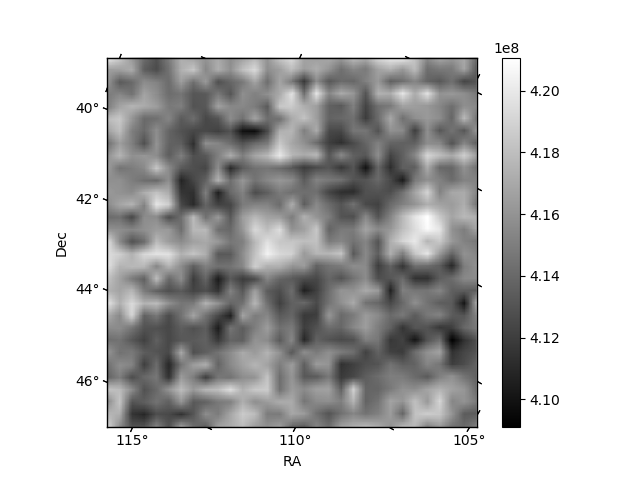
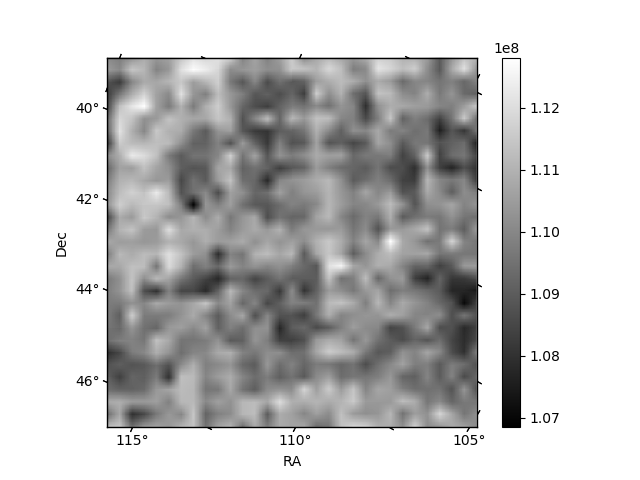
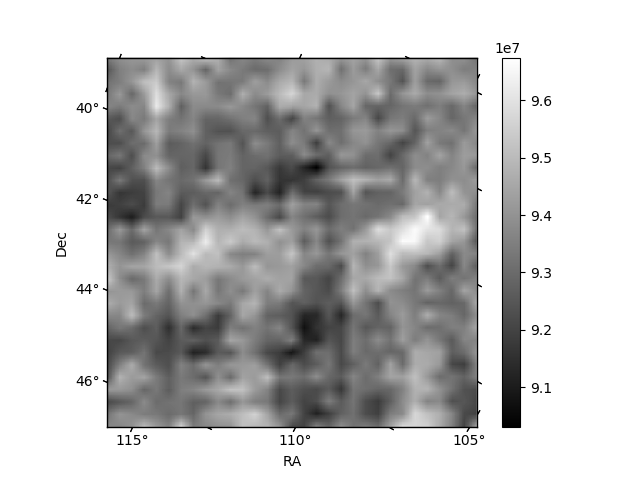
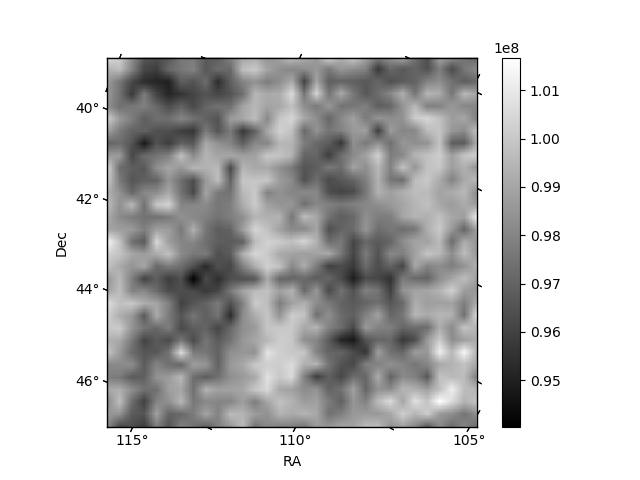
Histogram calculated using DETX and DETY for each event in the final _common_clean file
| Quadrant A | 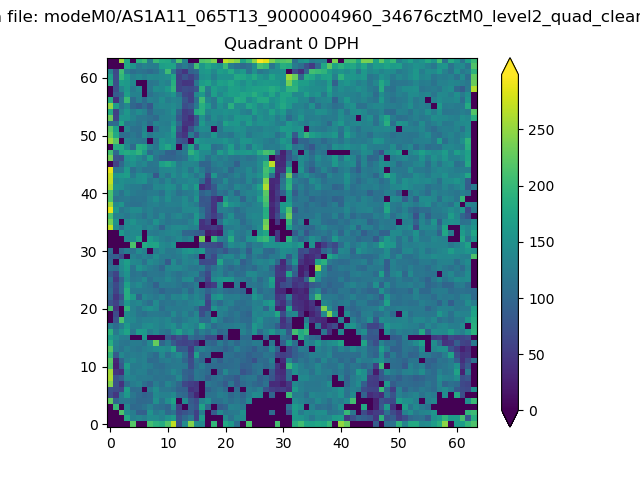 |
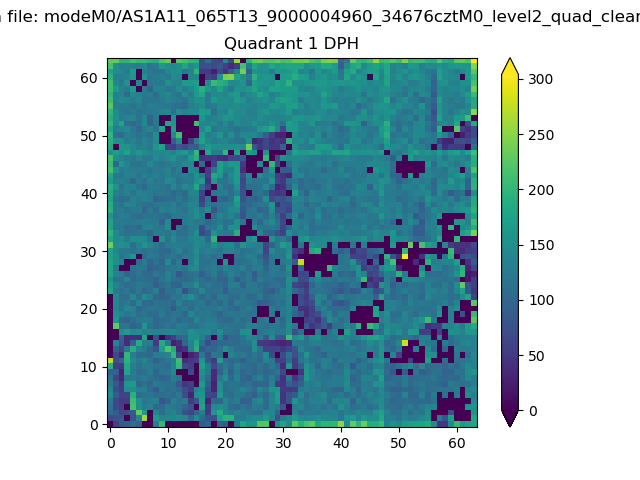 |
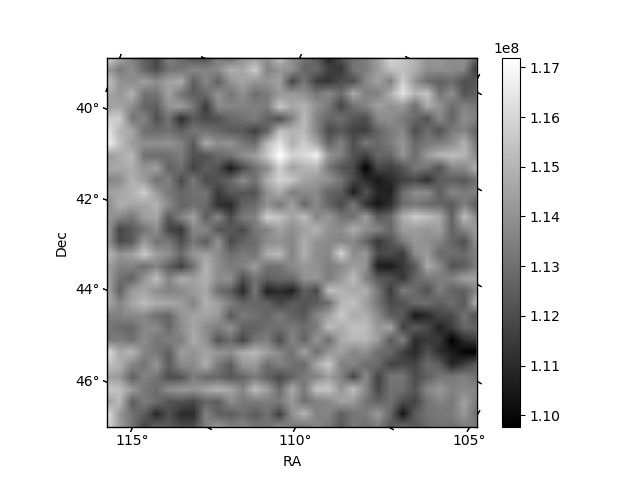
Quadrant B |
|---|---|---|---|
| Quadrant D | 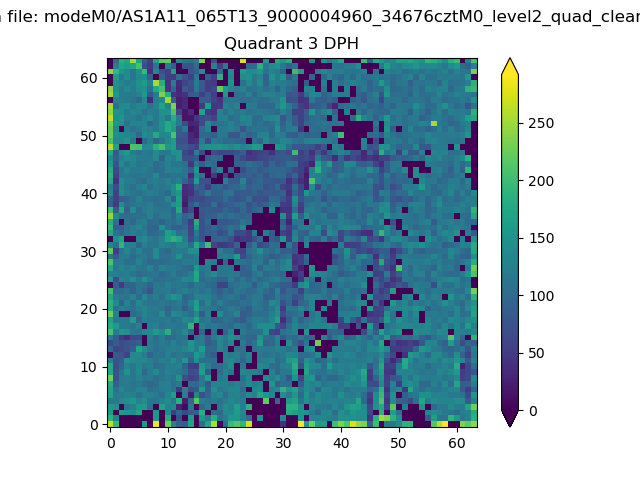 |
 |
Quadrant C |
| Plot type | Count rate plots | Images |
|---|---|---|
| Comparison with Poisson distribution Blue bars denote a histogram of data divided into 1 sec bins. Red curve is a Poisson curve with rate = median count rate of data. |
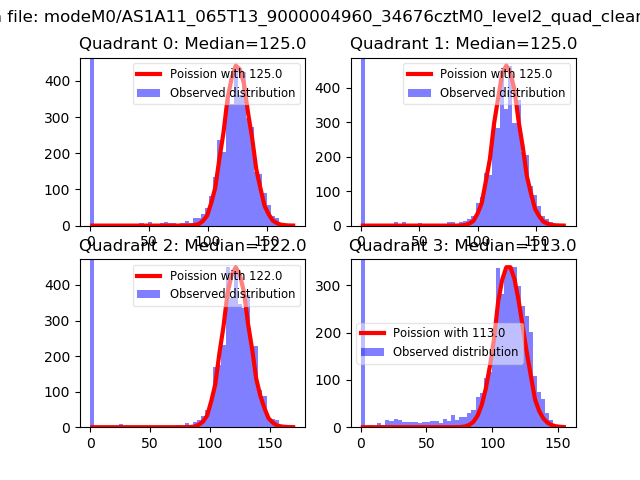 |
 |
| Quadrant-wise count rates Data is divided into 100 sec bins |
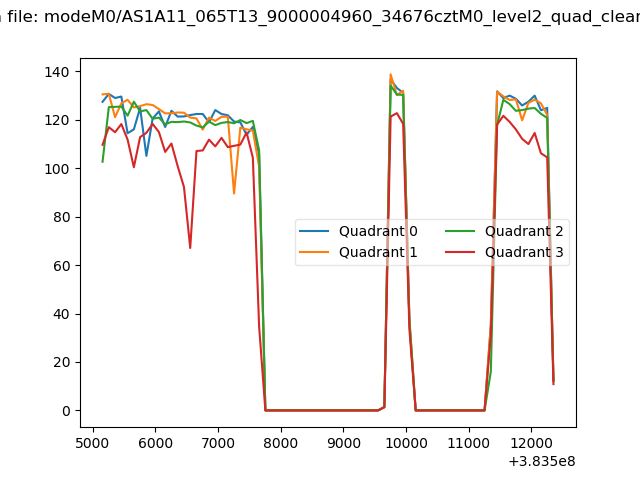 |
|
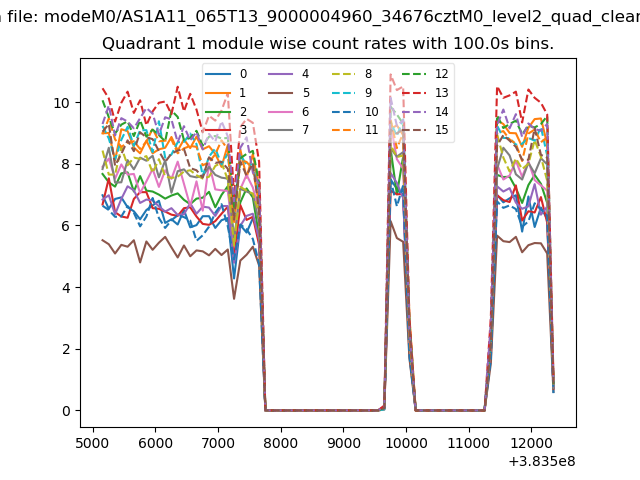
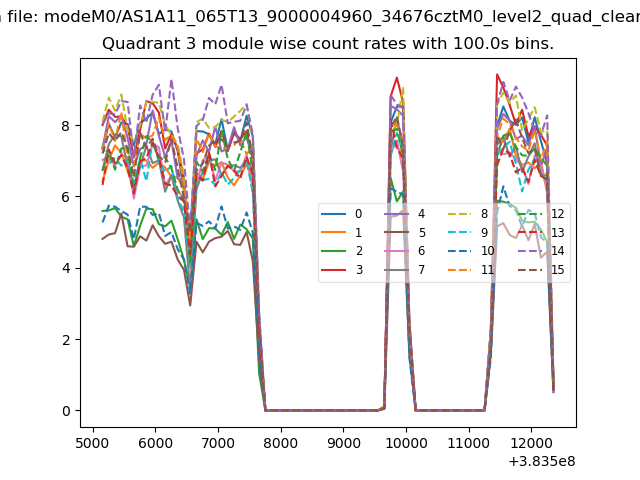
| Module-wise count rates for Quadrant A Data is divided into 100 sec bins |
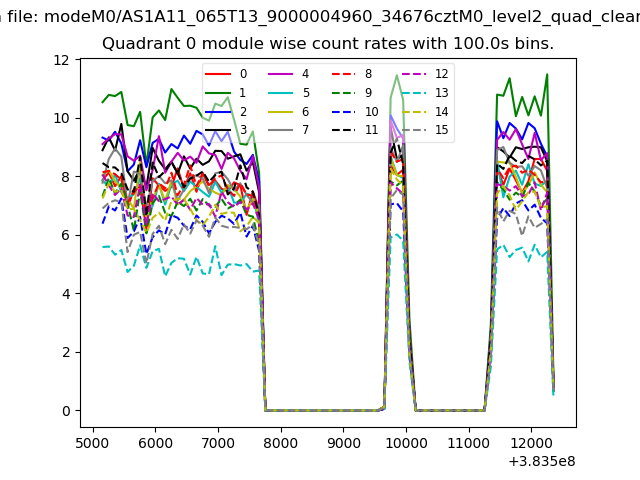 |
 |
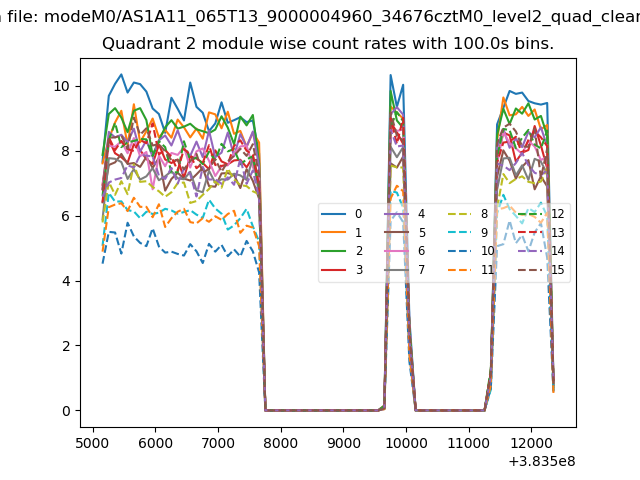
| Module-wise count rates for Quadrant B Data is divided into 100 sec bins |
 |
 |
| Module-wise count rates for Quadrant C Data is divided into 100 sec bins |
 |
 |
| Module-wise count rates for Quadrant D Data is divided into 100 sec bins |
 |
 |
| Parameter | Plot |
|---|---|
| CZT HV Monitor | 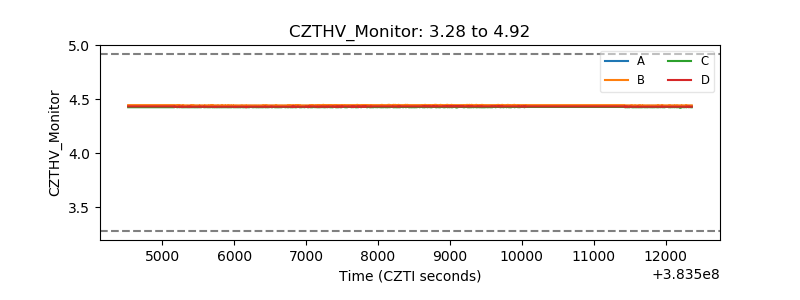 |
| D_VDD | 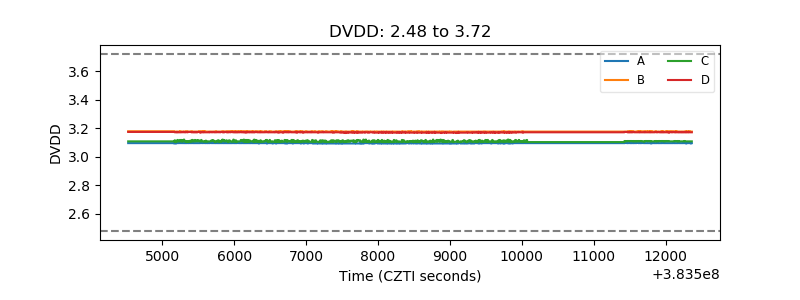 |
| Temperature 1 |  |
| Veto HV Monitor | 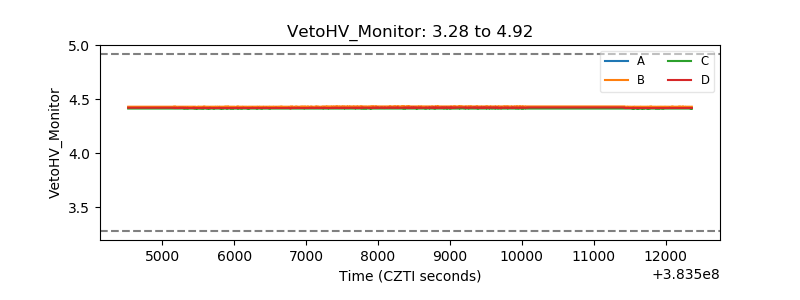 |
| Veto LLD | 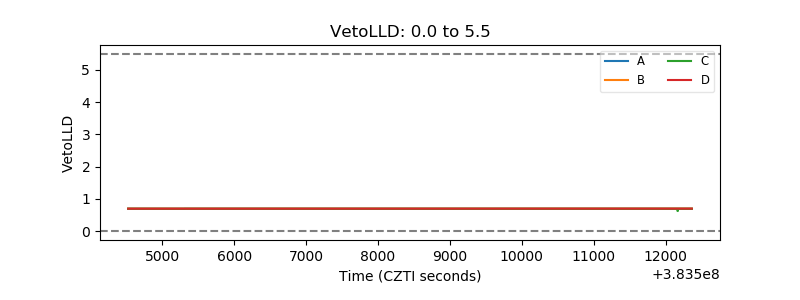 |
| Alpha Counter | 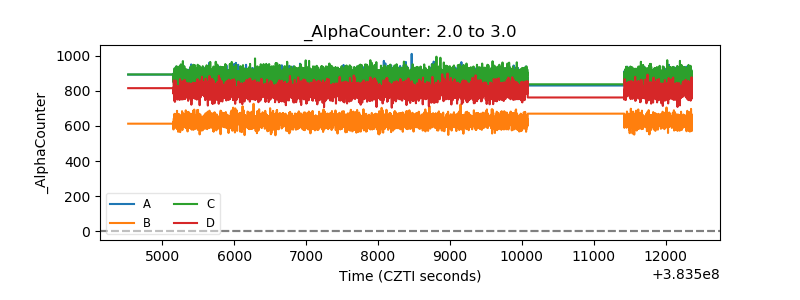 |
| _CPM_Rate | 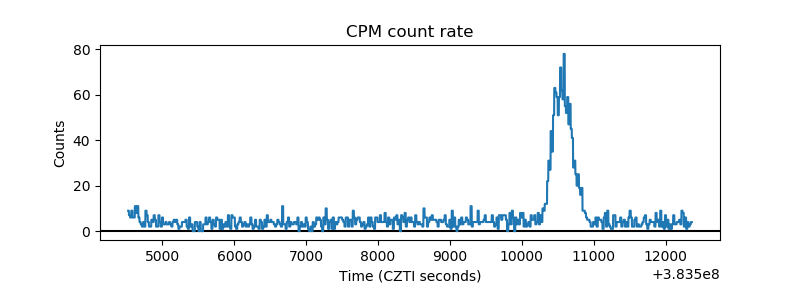 |
| CZT Counter | 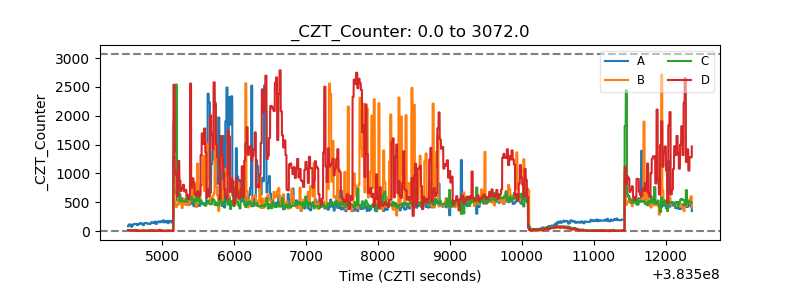 |
| +2.5 Volts monitor | 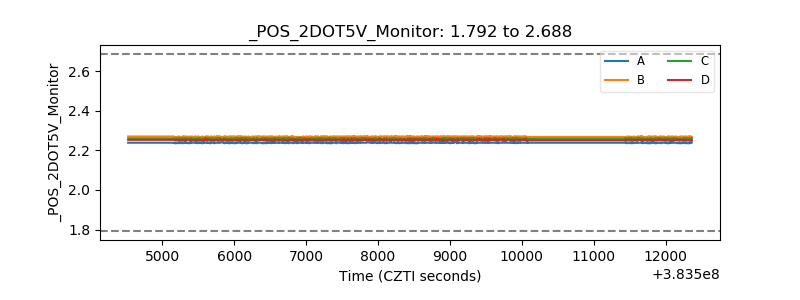 |
| +5 Volts monitor | 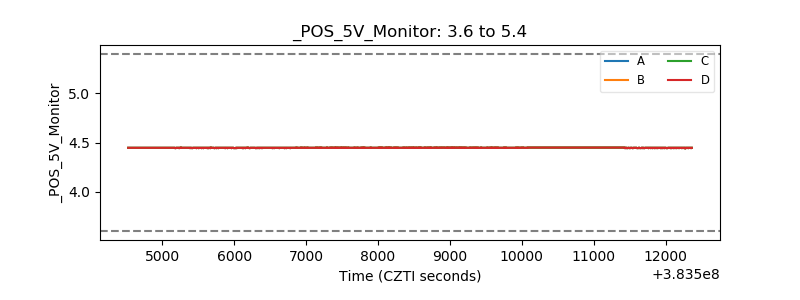 |
| _ROLL_ROT | 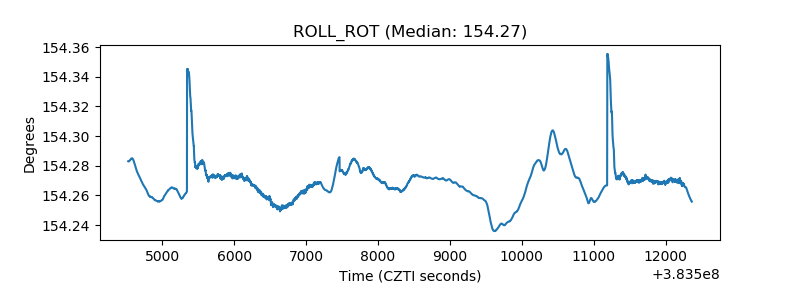 |
| _Roll_DEC | 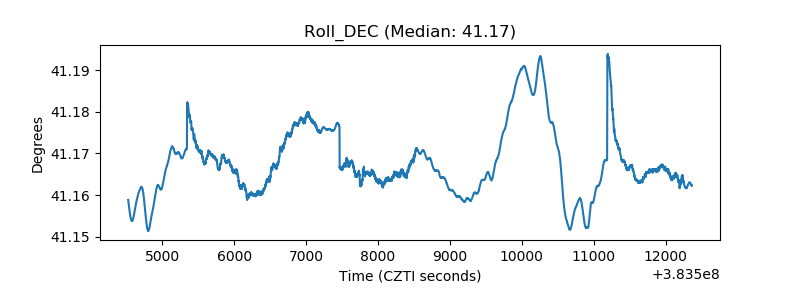 |
| _Roll_RA | 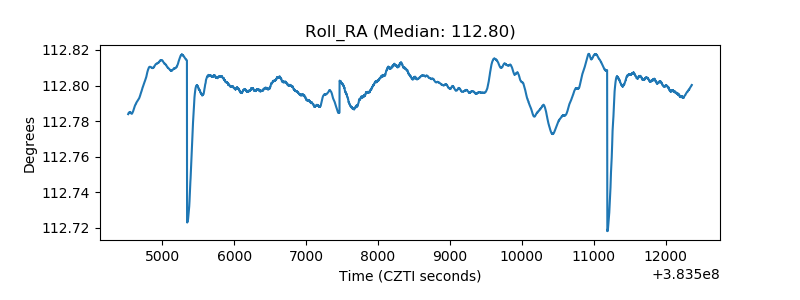 |
| Veto Counter | 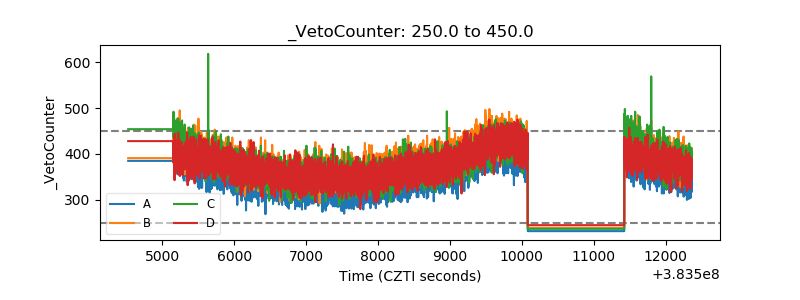 |