| Param | Original file | Final file |
|---|---|---|
| Filename | modeM0/AS1A11_065T13_9000004960cztM0_level2_bc.evt | modeM0/AS1A11_065T13_9000004960cztM0_level2_quad_clean.evt |
| Size (bytes) | 963,241,920 | 203,192,640 |
| Size | 918.6 MB | 193.8 MB |
| Events in quadrant A | 4,393,450 | 1,311,537 |
| Events in quadrant B | 6,363,411 | 1,302,523 |
| Events in quadrant C | 4,503,927 | 1,279,521 |
| Events in quadrant D | 12,765,309 | 1,102,370 |
| Mode M9 | |||
|---|---|---|---|
| Quadrant | BADHDUFLAG | Total packets | Discarded packets |
| A | 0 | 55 | 0 |
| B | 0 | 55 | 0 |
| C | 0 | 55 | 0 |
| D | 0 | 55 | 0 |
| Mode M0 | |||
|---|---|---|---|
| Quadrant | BADHDUFLAG | Total packets | Discarded packets |
| A | 0 | 37531 | 0 |
| B | 0 | 45736 | 0 |
| C | 0 | 35864 | 0 |
| D | 0 | 67530 | 0 |
| Mode SS | |||
|---|---|---|---|
| Quadrant | BADHDUFLAG | Total packets | Discarded packets |
| A | 0 | 346 | 0 |
| B | 0 | 346 | 0 |
| C | 0 | 346 | 0 |
| D | 0 | 346 | 0 |
| Quadrant | Total seconds | Saturated seconds | Saturation percentage |
|---|---|---|---|
| A | 16770 | 245 | 1.460942% |
| B | 16770 | 1031 | 6.147883% |
| C | 16770 | 122 | 0.727490% |
| D | 16770 | 2121 | 12.647585% |
Noise dominated data is calculated using 1-second bins in cleaned event files. If a bin has >2000 counts, and if more than 50% of those come from <1% of pixels, then it is considered to be noise-dominated and hence unusable.
| Quadrant | # 1 sec bins | Bins with >0 counts | Bins with >2000 counts | High rate bins dominated by noise | Noise dominated (total time) | Noise dominated (detector-on time) | Marked lightcurve |
|---|---|---|---|---|---|---|---|
| A | 22351 | 16774 | 5 | 5 | 0.02% | 0.03% | 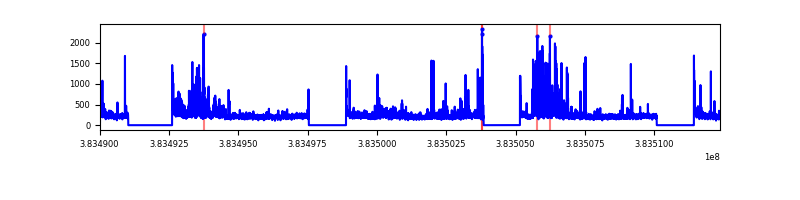 |
| B | 22351 | 16770 | 66 | 66 | 0.30% | 0.39% | 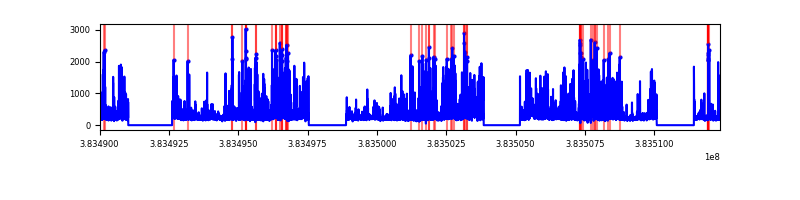 |
| C | 22351 | 16771 | 16 | 16 | 0.07% | 0.10% | 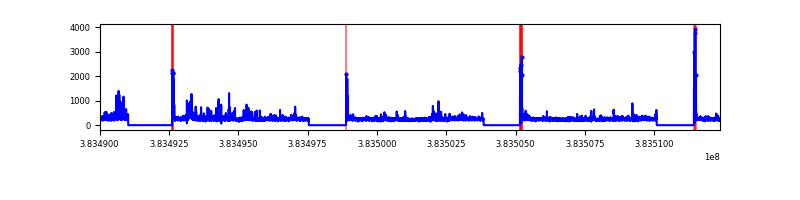 |
| D | 22351 | 16769 | 384 | 384 | 1.72% | 2.29% | 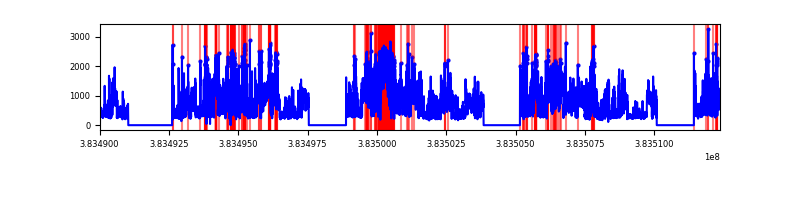 |
Top three noisy pixels from each quadrant. If the there are fewer than three noisy pixels in the level2.evt file, extra rows are filled as -1
| Pixel properties | Quadrant properties | ||||||
|---|---|---|---|---|---|---|---|
| Quadrant | DetID | PixID | Counts | Sigma | Mean | Median | Sigma |
| A | 15 | 169 | 814553 | 4264.93 | 843 | 827 | 190.8 |
| A | 10 | 83 | 108362 | 563.62 | 843 | 827 | 190.8 |
| A | 7 | 48 | 58031 | 299.82 | 843 | 827 | 190.8 |
| B | 5 | 172 | 2030860 | 12045.22 | 830 | 810 | 168.5 |
| B | 5 | 255 | 685946 | 4065.23 | 830 | 810 | 168.5 |
| B | 0 | 190 | 202182 | 1194.83 | 830 | 810 | 168.5 |
| C | 15 | 214 | 682537 | 3542.57 | 821 | 814 | 192.4 |
| C | 14 | 67 | 344739 | 1787.2 | 821 | 814 | 192.4 |
| C | 0 | 10 | 203763 | 1054.62 | 821 | 814 | 192.4 |
| D | 8 | 195 | 5424621 | 26833.38 | 772 | 752 | 202.1 |
| D | 7 | 38 | 2147716 | 10621.62 | 772 | 752 | 202.1 |
| D | 2 | 249 | 673398 | 3327.77 | 772 | 752 | 202.1 |
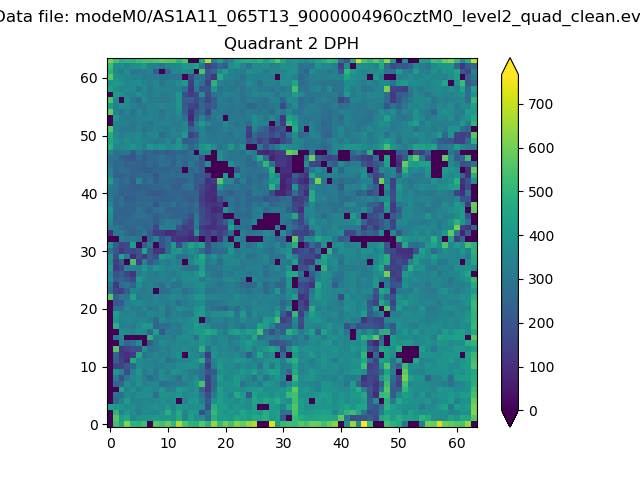
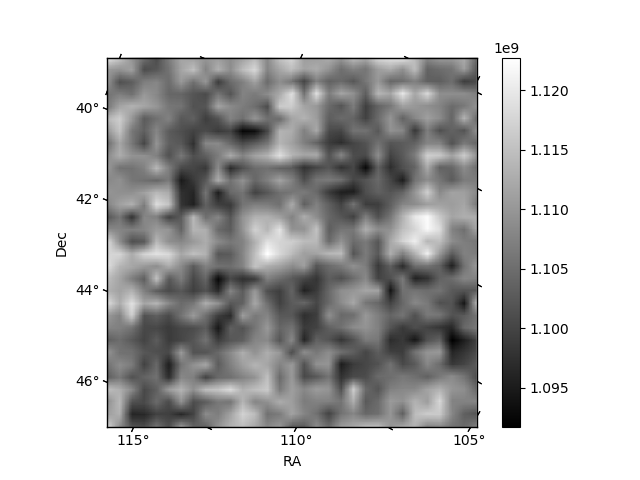
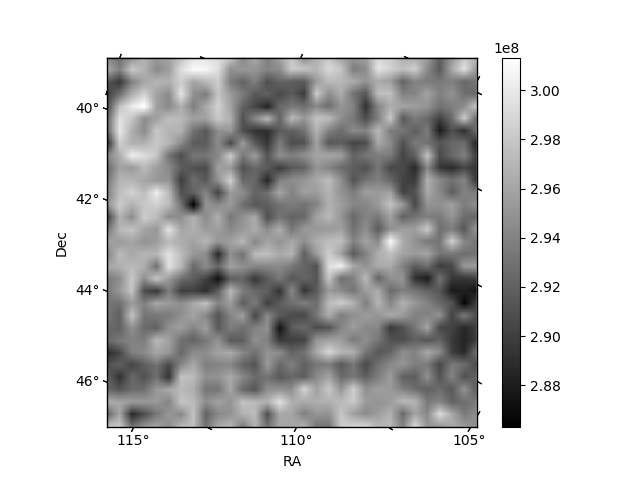
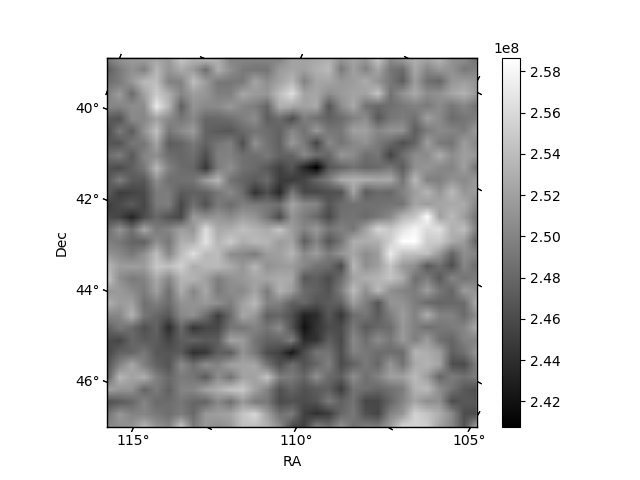
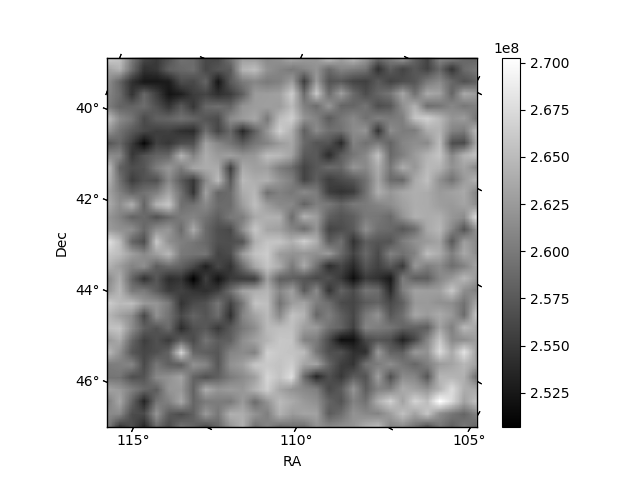
Histogram calculated using DETX and DETY for each event in the final _common_clean file
| Quadrant A | 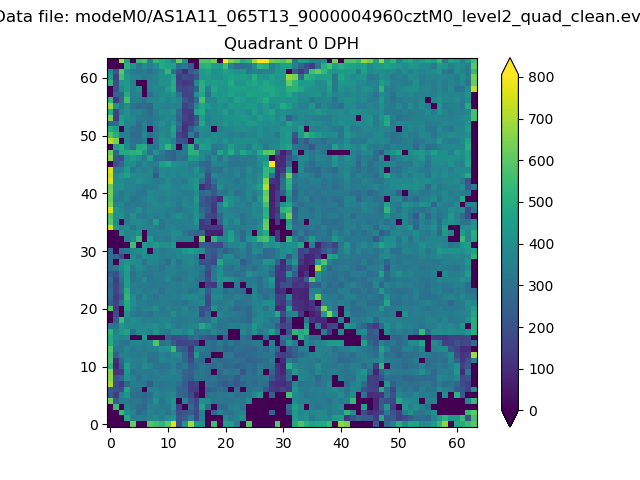 |
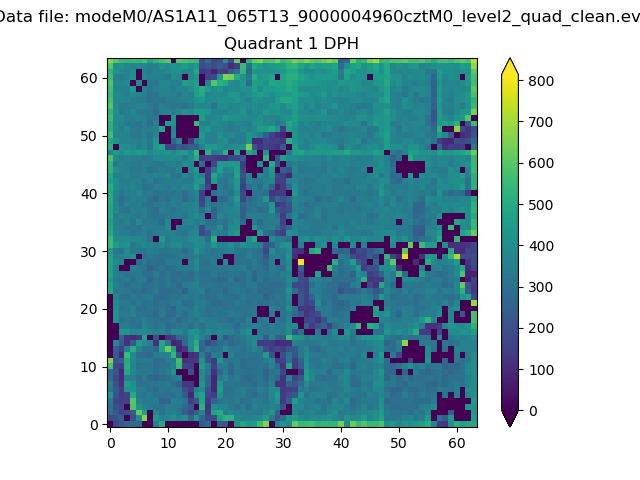 |
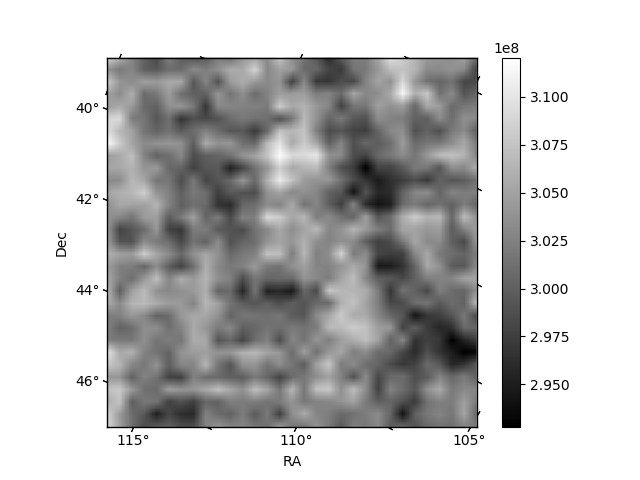
Quadrant B |
|---|---|---|---|
| Quadrant D | 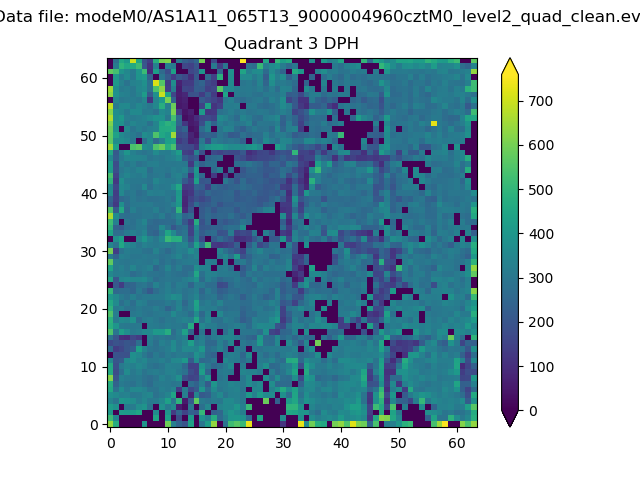 |
 |
Quadrant C |
| Plot type | Count rate plots | Images |
|---|---|---|
| Comparison with Poisson distribution Blue bars denote a histogram of data divided into 1 sec bins. Red curve is a Poisson curve with rate = median count rate of data. |
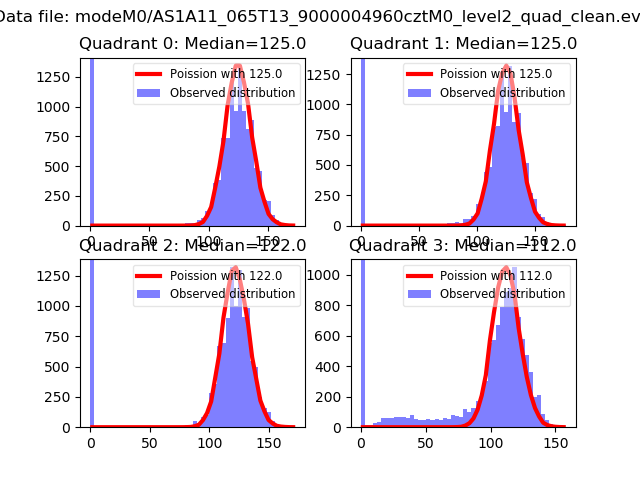 |
 |
| Quadrant-wise count rates Data is divided into 100 sec bins |
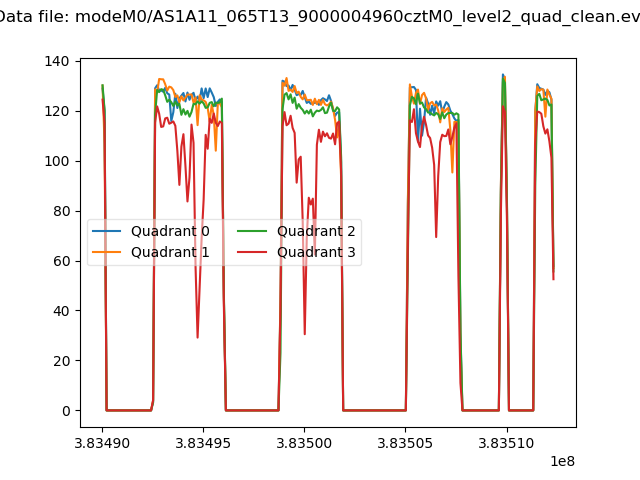 |
|
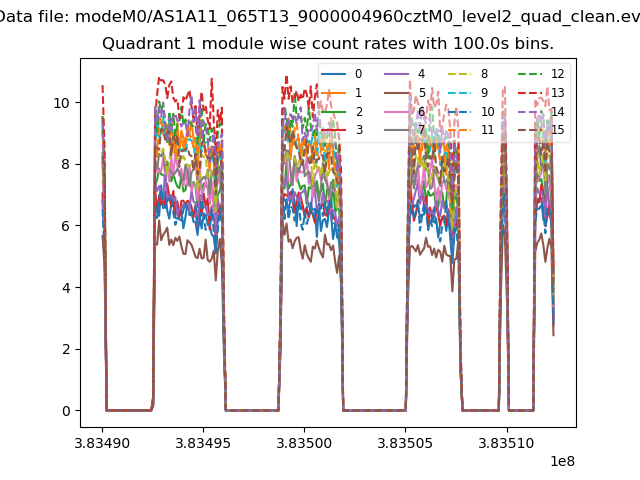
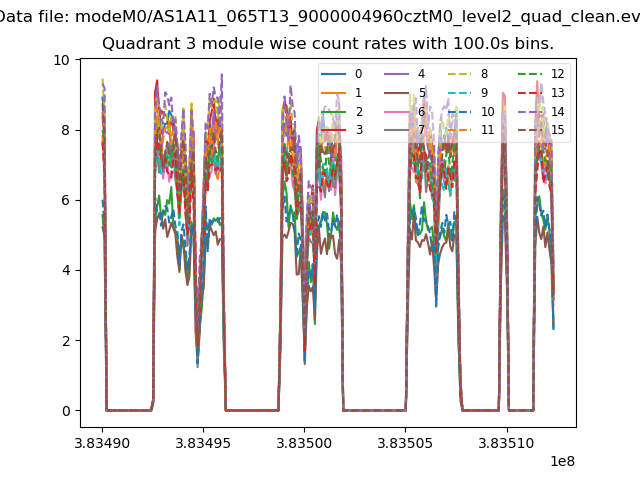
| Module-wise count rates for Quadrant A Data is divided into 100 sec bins |
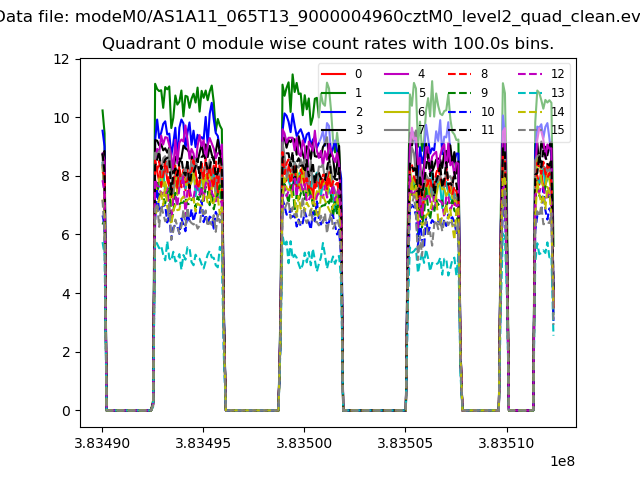 |
 |
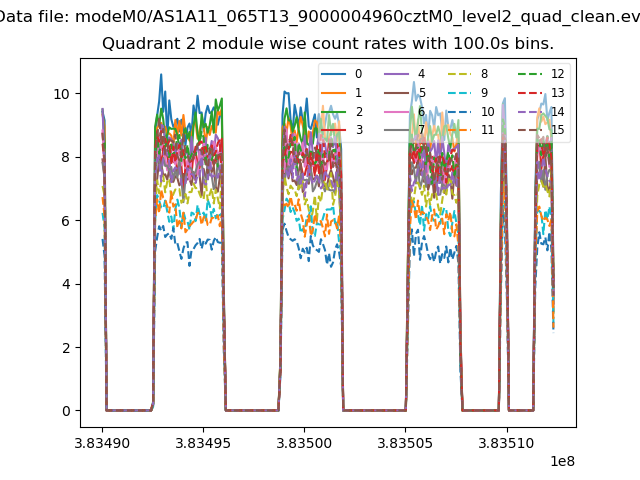
| Module-wise count rates for Quadrant B Data is divided into 100 sec bins |
 |
 |
| Module-wise count rates for Quadrant C Data is divided into 100 sec bins |
 |
 |
| Module-wise count rates for Quadrant D Data is divided into 100 sec bins |
 |
 |
| Parameter | Plot |
|---|---|
| CZT HV Monitor | 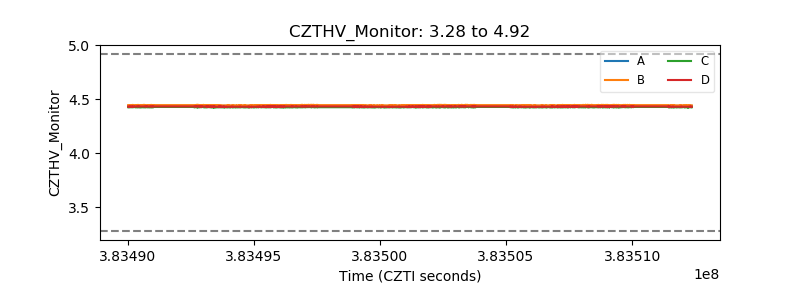 |
| D_VDD | 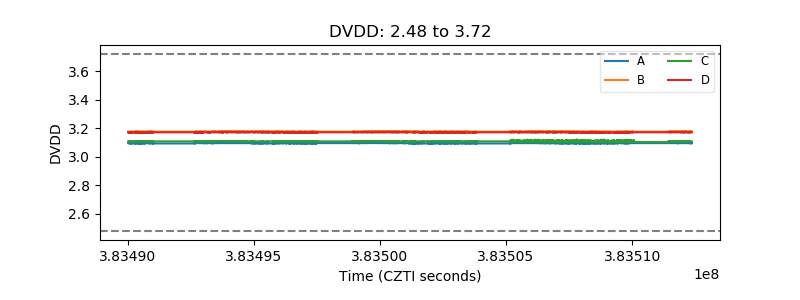 |
| Temperature 1 | 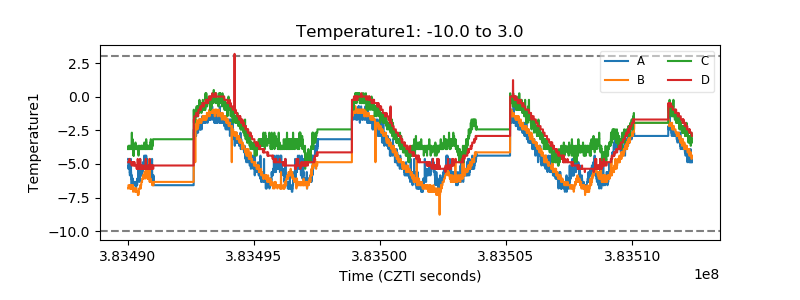 |
| Veto HV Monitor | 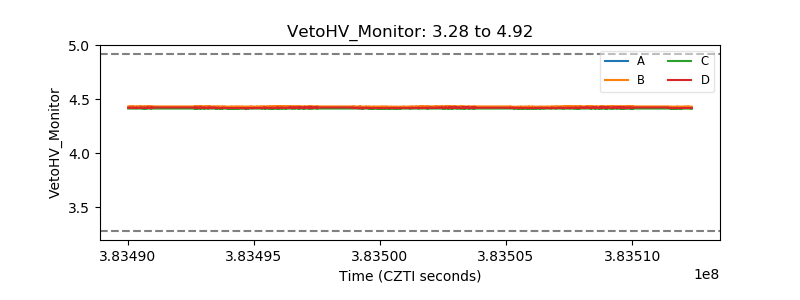 |
| Veto LLD | 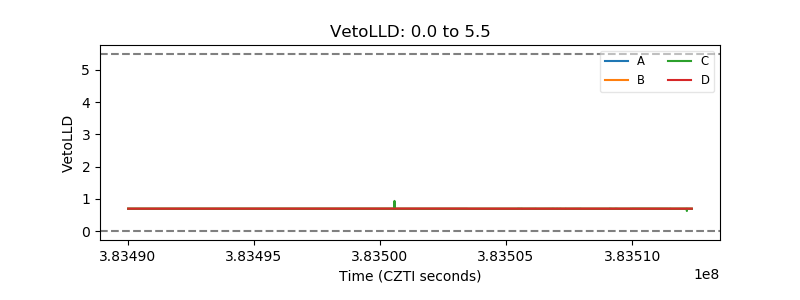 |
| Alpha Counter | 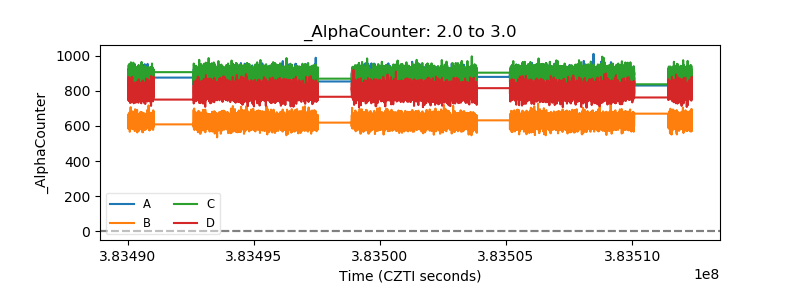 |
| _CPM_Rate | 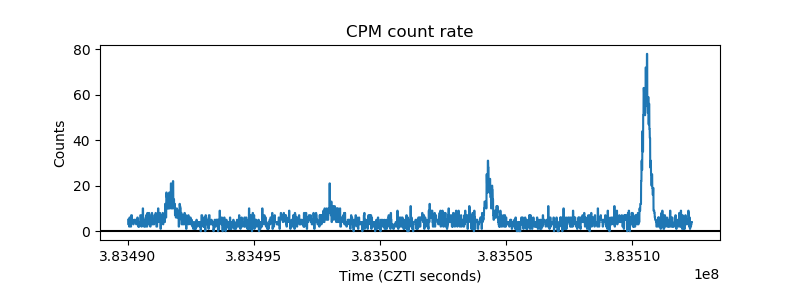 |
| CZT Counter | 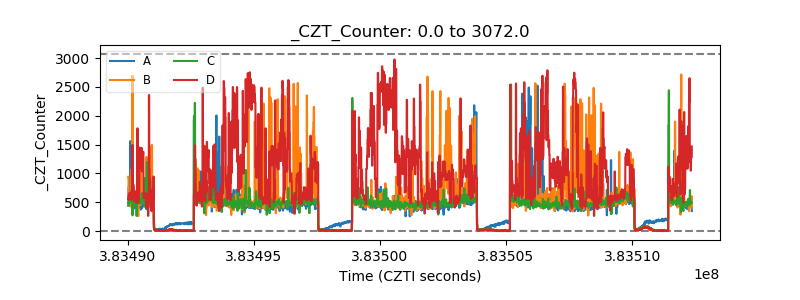 |
| +2.5 Volts monitor | 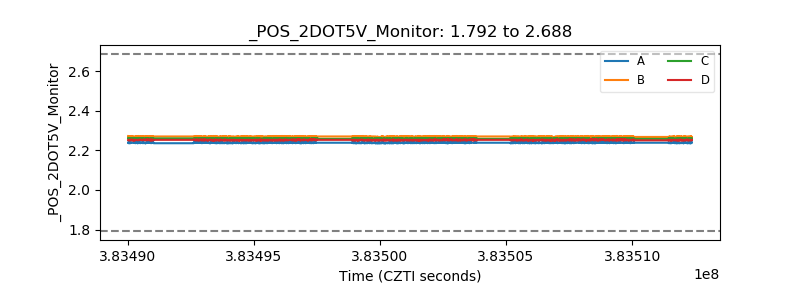 |
| +5 Volts monitor | 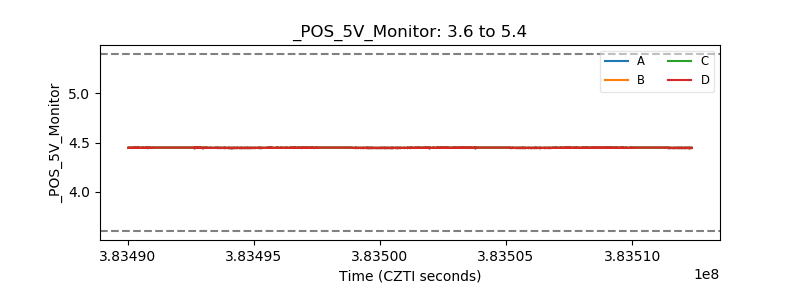 |
| _ROLL_ROT | 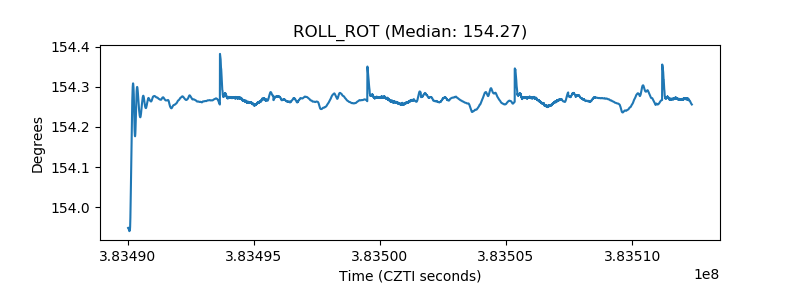 |
| _Roll_DEC | 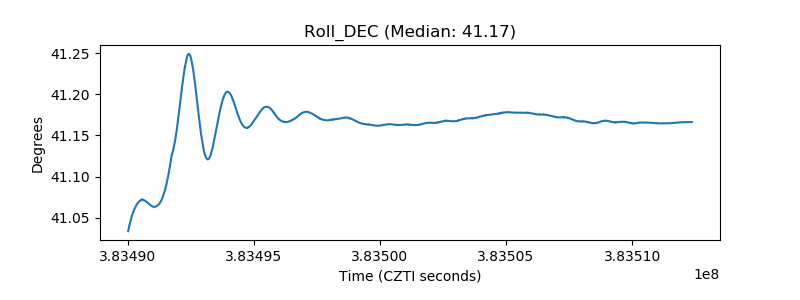 |
| _Roll_RA | 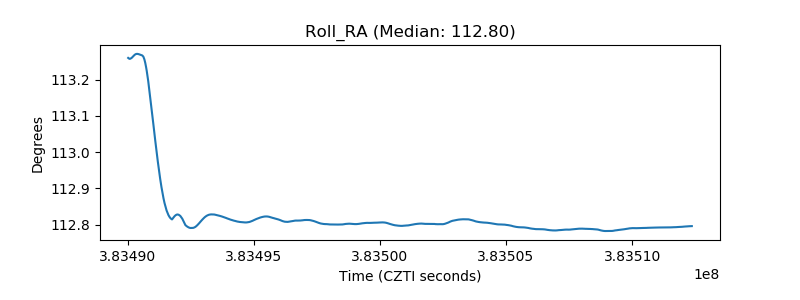 |
| Veto Counter | 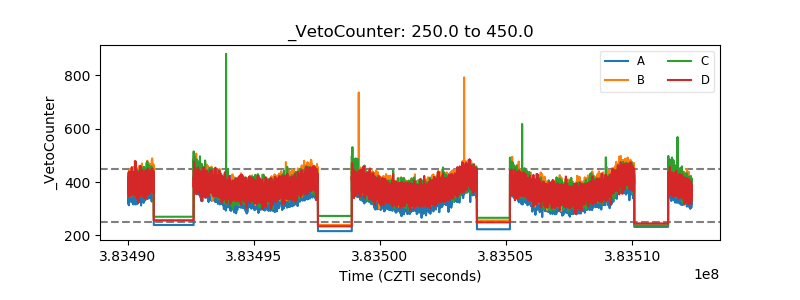 |