| Param | Original file | Final file |
|---|---|---|
| Filename | modeM0/AS1A11_065T06_9000004958_34667cztM0_level2.evt | modeM0/AS1A11_065T06_9000004958_34667cztM0_level2_quad_clean.evt |
| Size (bytes) | 524,597,760 | 50,909,760 |
| Size | 500.3 MB | 48.6 MB |
| Events in quadrant A | 2,756,338 | 301,732 |
| Events in quadrant B | 4,093,431 | 306,188 |
| Events in quadrant C | 3,122,147 | 297,635 |
| Events in quadrant D | 5,551,784 | 259,124 |
| Mode M0 | |||
|---|---|---|---|
| Quadrant | BADHDUFLAG | Total packets | Discarded packets |
| A | 0 | 11203 | 3 |
| B | 0 | 15448 | 2 |
| C | 0 | 12242 | 2 |
| D | 0 | 20335 | 2 |
| Mode SS | |||
|---|---|---|---|
| Quadrant | BADHDUFLAG | Total packets | Discarded packets |
| A | 0 | 110 | 0 |
| B | 0 | 110 | 0 |
| C | 0 | 110 | 0 |
| D | 0 | 110 | 0 |
| Mode M9 | |||
|---|---|---|---|
| Quadrant | BADHDUFLAG | Total packets | Discarded packets |
| A | 0 | 28 | 0 |
| B | 0 | 28 | 0 |
| C | 0 | 28 | 0 |
| D | 0 | 29 | 0 |
| Quadrant | Total seconds | Saturated seconds | Saturation percentage |
|---|---|---|---|
| A | 5371 | 11 | 0.204804% |
| B | 5371 | 402 | 7.484640% |
| C | 5371 | 74 | 1.377770% |
| D | 5371 | 350 | 6.516477% |
Noise dominated data is calculated using 1-second bins in cleaned event files. If a bin has >2000 counts, and if more than 50% of those come from <1% of pixels, then it is considered to be noise-dominated and hence unusable.
| Quadrant | # 1 sec bins | Bins with >0 counts | Bins with >2000 counts | High rate bins dominated by noise | Noise dominated (total time) | Noise dominated (detector-on time) | Marked lightcurve |
|---|---|---|---|---|---|---|---|
| A | 7344 | 5372 | 5 | 5 | 0.07% | 0.09% | 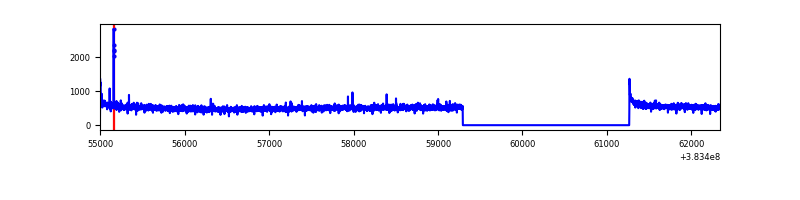 |
| B | 7344 | 5372 | 269 | 269 | 3.66% | 5.01% | 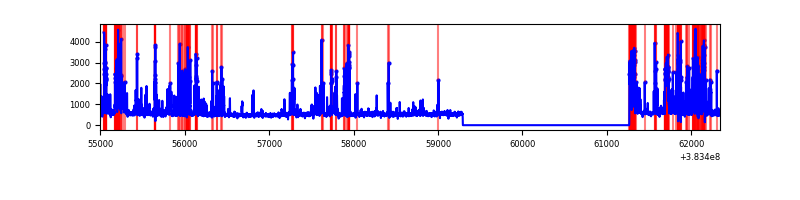 |
| C | 7344 | 5371 | 53 | 53 | 0.72% | 0.99% | 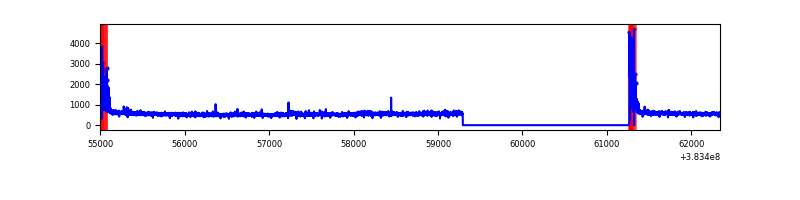 |
| D | 7344 | 5371 | 278 | 278 | 3.79% | 5.18% | 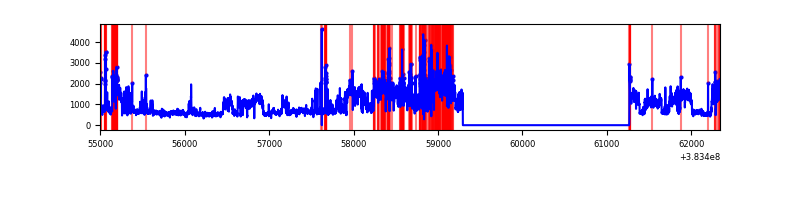 |
Top three noisy pixels from each quadrant. If the there are fewer than three noisy pixels in the level2.evt file, extra rows are filled as -1
| Pixel properties | Quadrant properties | ||||||
|---|---|---|---|---|---|---|---|
| Quadrant | DetID | PixID | Counts | Sigma | Mean | Median | Sigma |
| A | 10 | 83 | 46039 | 326.42 | 695 | 684 | 138.9 |
| A | 15 | 174 | 15035 | 103.28 | 695 | 684 | 138.9 |
| A | 13 | 254 | 9761 | 65.33 | 695 | 684 | 138.9 |
| B | 5 | 172 | 999045 | 7902.79 | 674 | 660 | 126.3 |
| B | 5 | 255 | 224589 | 1772.53 | 674 | 660 | 126.3 |
| B | 5 | 200 | 109920 | 864.86 | 674 | 660 | 126.3 |
| C | 15 | 214 | 231494 | 1514.5 | 664 | 671 | 152.4 |
| C | 0 | 10 | 217690 | 1423.92 | 664 | 671 | 152.4 |
| C | 14 | 67 | 67204 | 436.54 | 664 | 671 | 152.4 |
| D | 8 | 195 | 2011133 | 12845.89 | 647 | 629 | 156.5 |
| D | 12 | 235 | 414706 | 2645.7 | 647 | 629 | 156.5 |
| D | 12 | 233 | 215021 | 1369.83 | 647 | 629 | 156.5 |
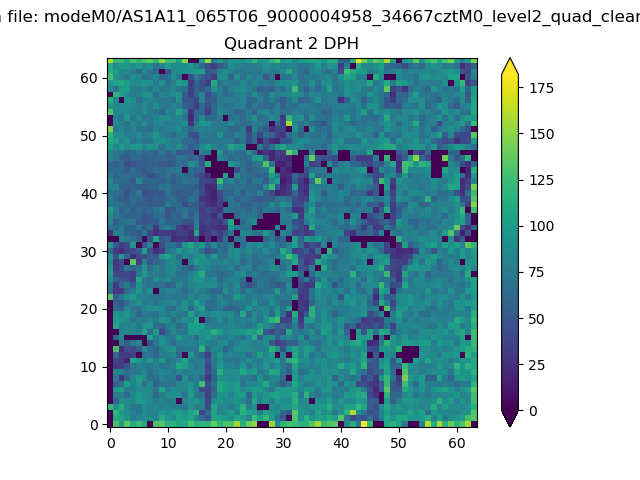
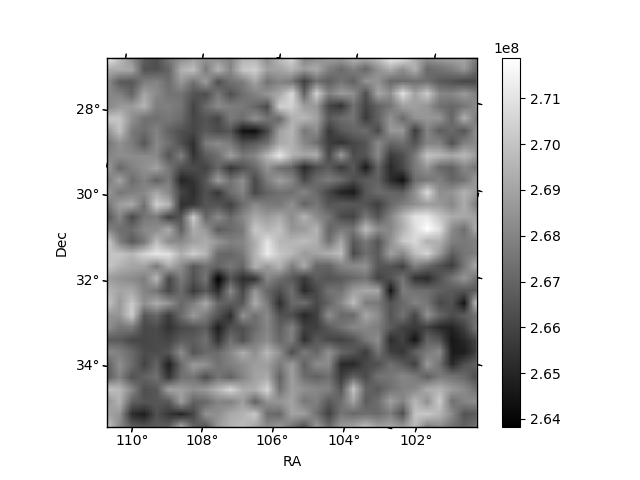
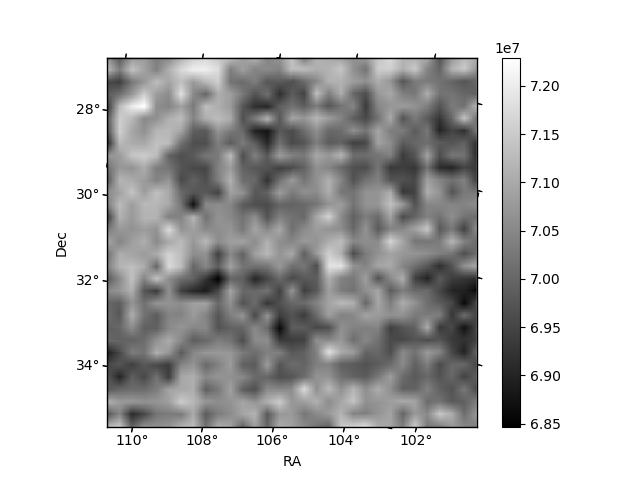
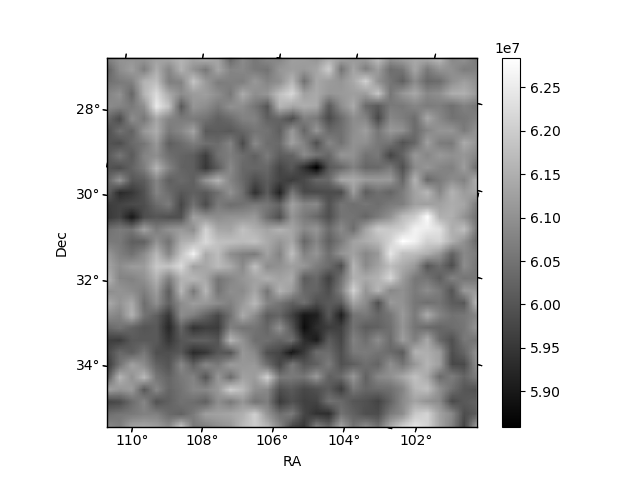
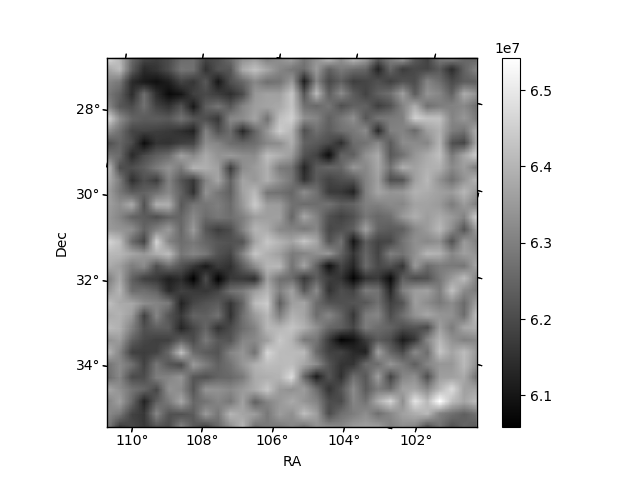
Histogram calculated using DETX and DETY for each event in the final _common_clean file
| Quadrant A | 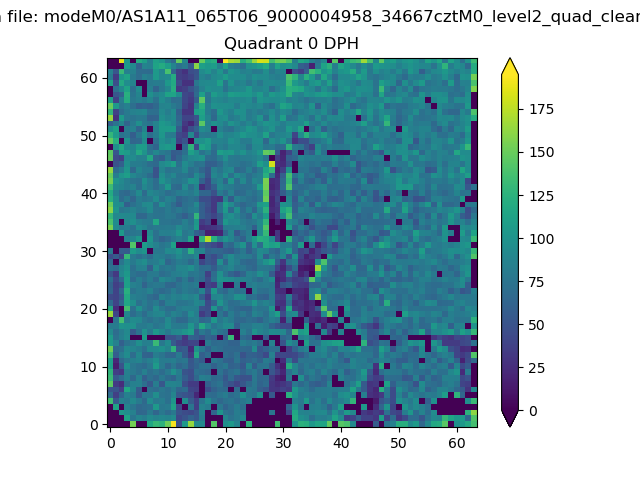 |
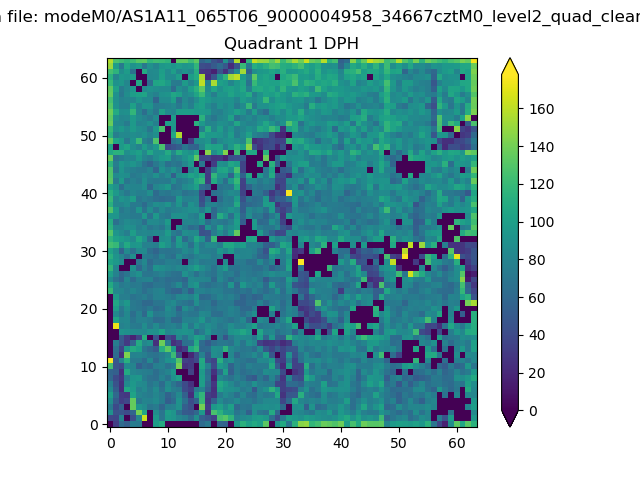 |
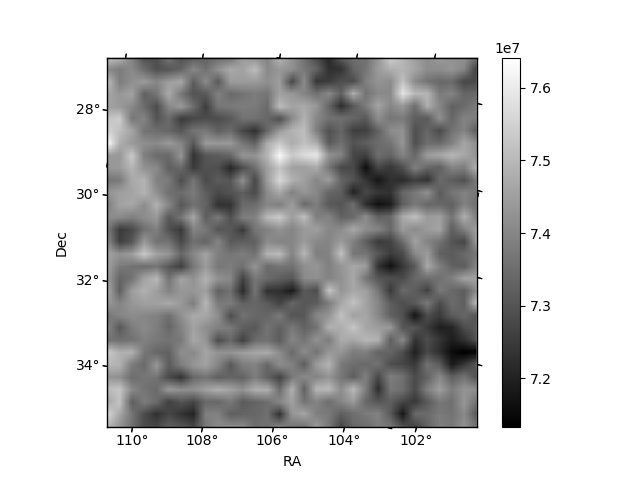
Quadrant B |
|---|---|---|---|
| Quadrant D | 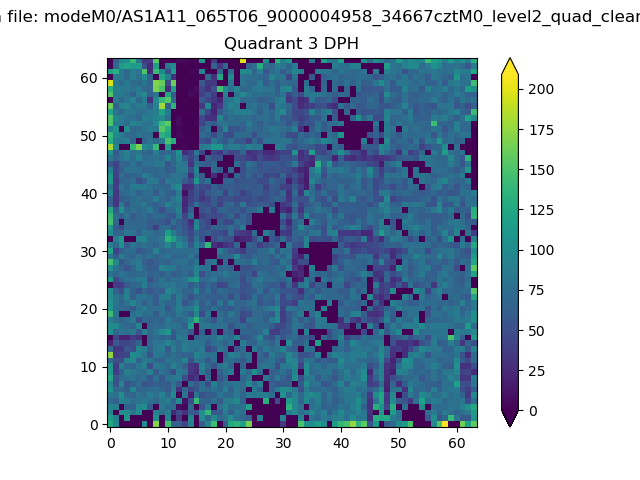 |
 |
Quadrant C |
| Plot type | Count rate plots | Images |
|---|---|---|
| Comparison with Poisson distribution Blue bars denote a histogram of data divided into 1 sec bins. Red curve is a Poisson curve with rate = median count rate of data. |
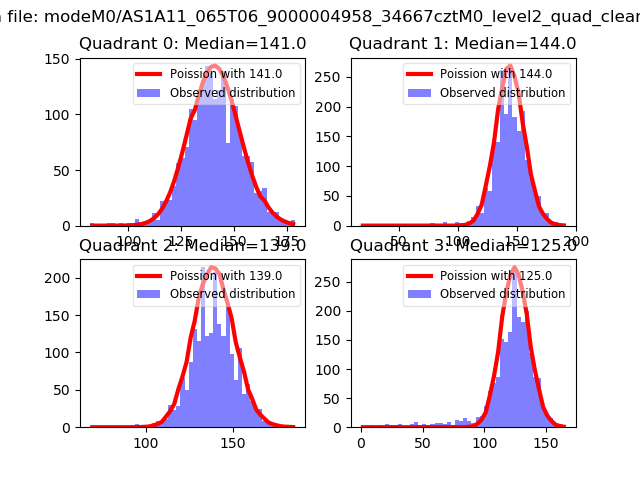 |
 |
| Quadrant-wise count rates Data is divided into 100 sec bins |
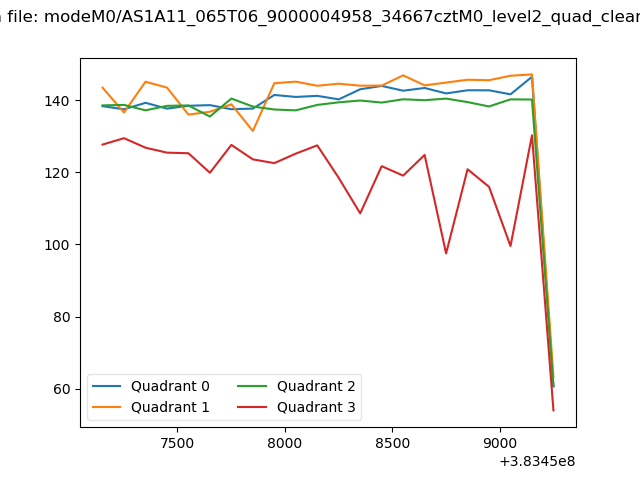 |
|
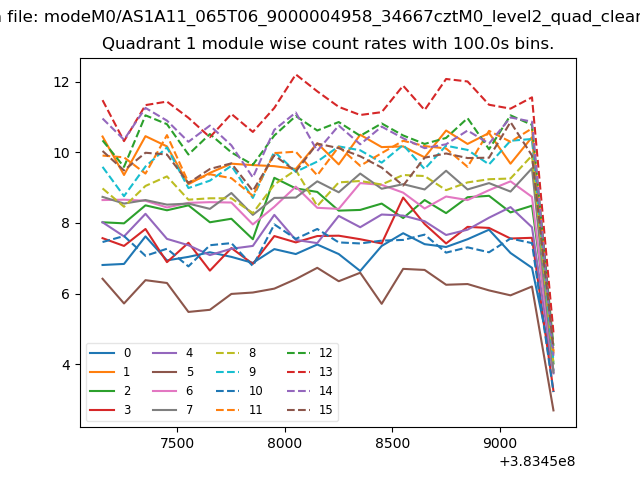
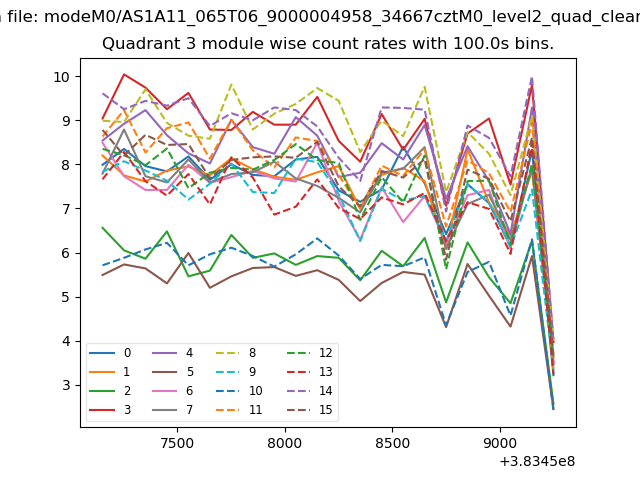
| Module-wise count rates for Quadrant A Data is divided into 100 sec bins |
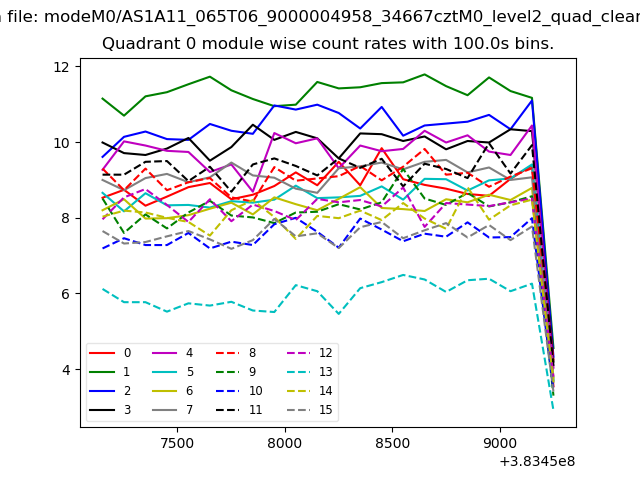 |
 |
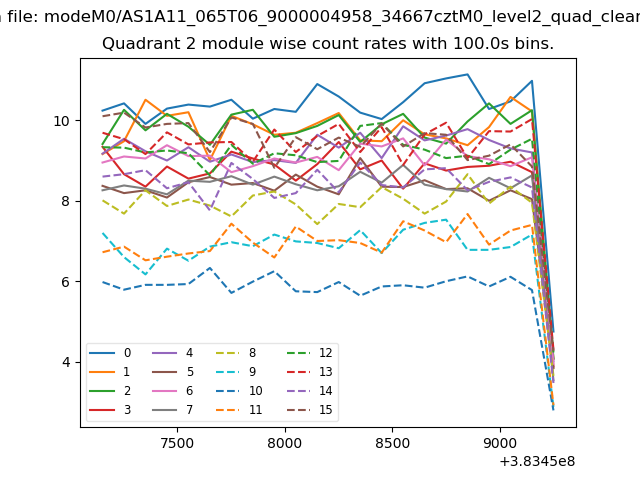
| Module-wise count rates for Quadrant B Data is divided into 100 sec bins |
 |
 |
| Module-wise count rates for Quadrant C Data is divided into 100 sec bins |
 |
 |
| Module-wise count rates for Quadrant D Data is divided into 100 sec bins |
 |
 |
| Parameter | Plot |
|---|---|
| CZT HV Monitor |  |
| D_VDD | 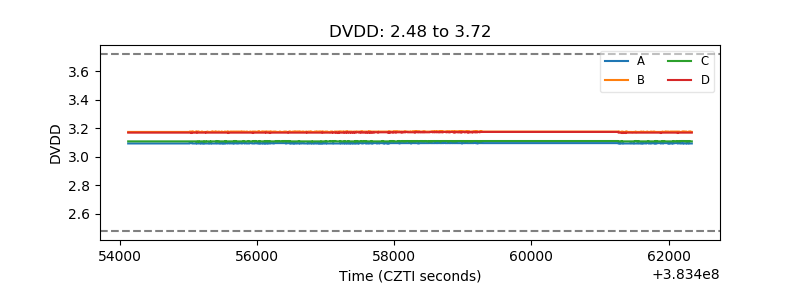 |
| Temperature 1 | 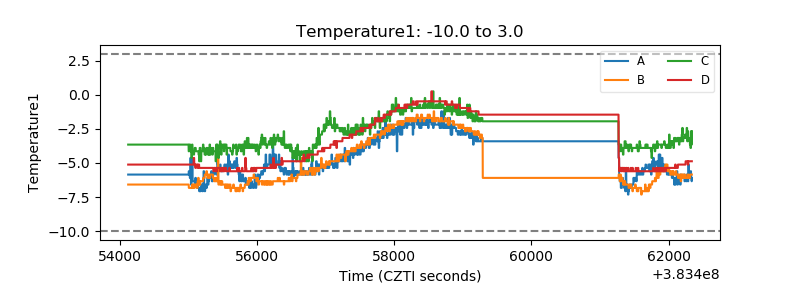 |
| Veto HV Monitor | 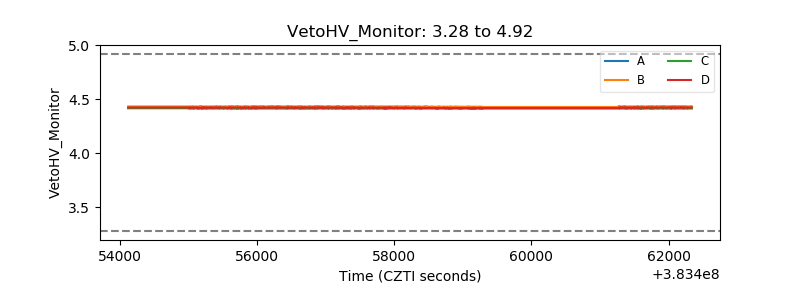 |
| Veto LLD | 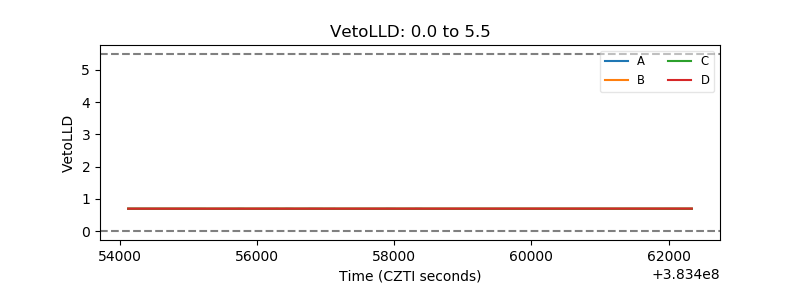 |
| Alpha Counter | 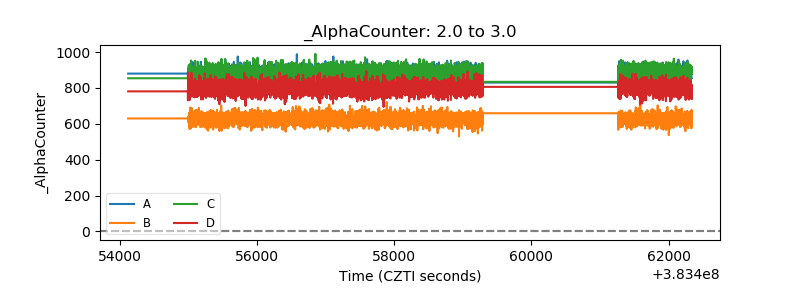 |
| _CPM_Rate | 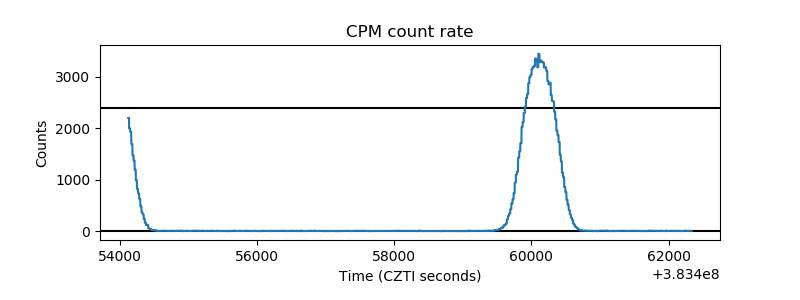 |
| CZT Counter | 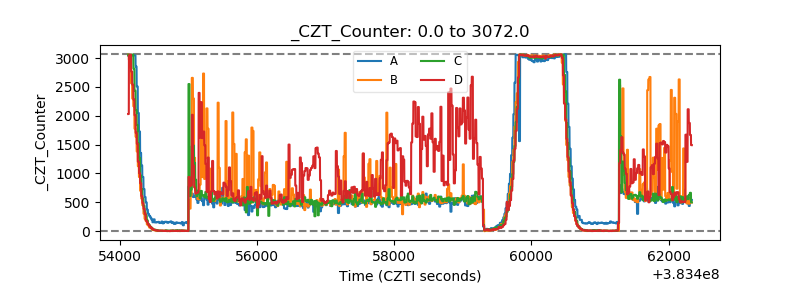 |
| +2.5 Volts monitor | 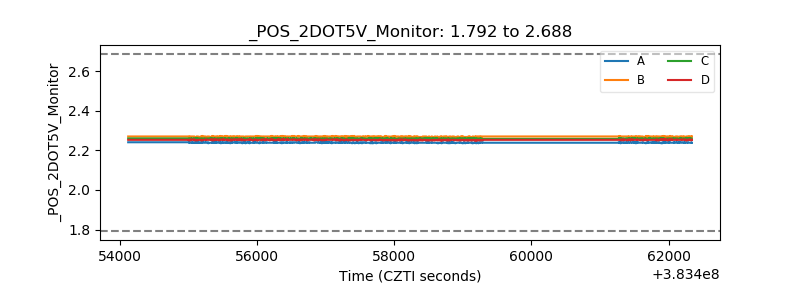 |
| +5 Volts monitor | 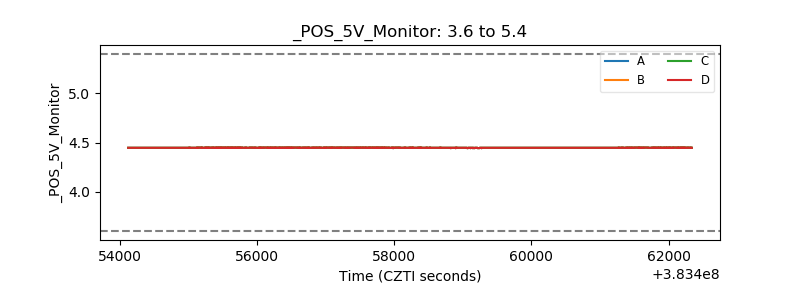 |
| _ROLL_ROT | 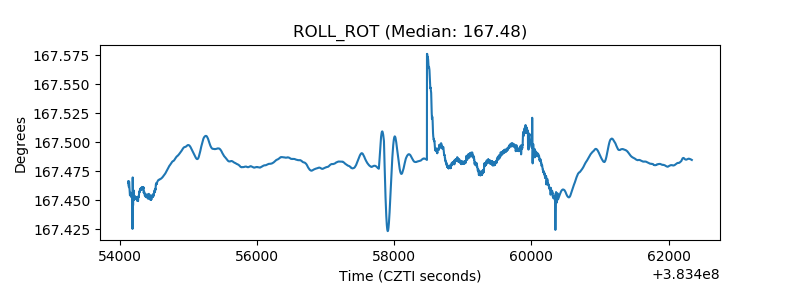 |
| _Roll_DEC | 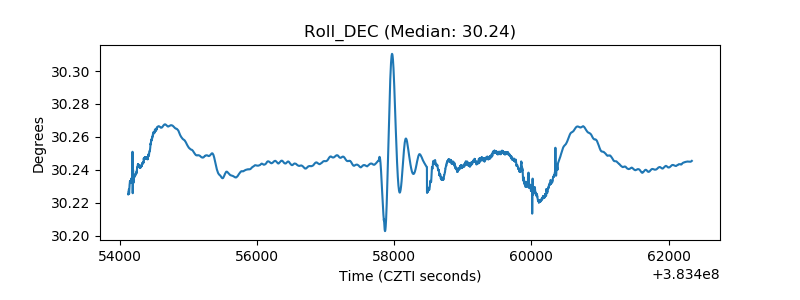 |
| _Roll_RA | 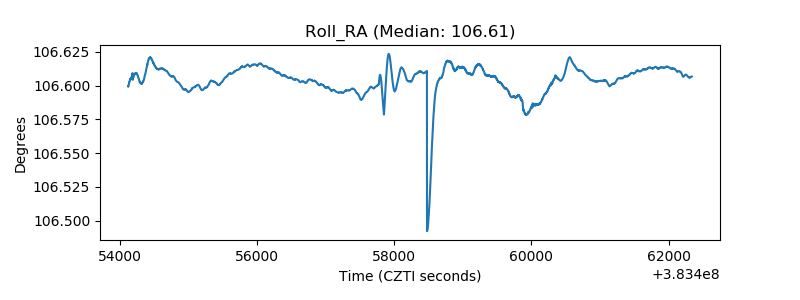 |
| Veto Counter | 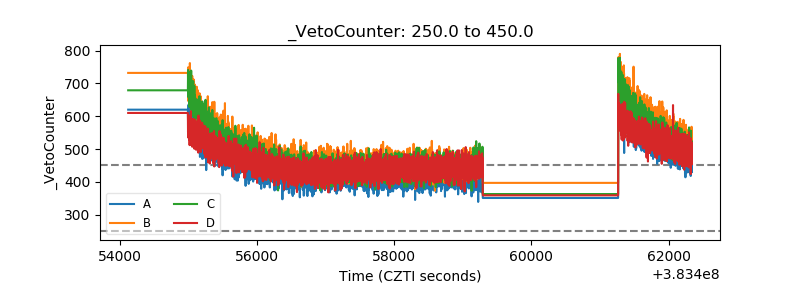 |