| Param | Original file | Final file |
|---|---|---|
| Filename | modeM0/AS1A11_065T06_9000004958_34666cztM0_level2.evt | modeM0/AS1A11_065T06_9000004958_34666cztM0_level2_quad_clean.evt |
| Size (bytes) | 473,492,160 | 51,292,800 |
| Size | 451.6 MB | 48.9 MB |
| Events in quadrant A | 2,548,009 | 310,951 |
| Events in quadrant B | 3,940,193 | 306,423 |
| Events in quadrant C | 2,876,246 | 305,329 |
| Events in quadrant D | 4,625,754 | 268,628 |
| Mode M0 | |||
|---|---|---|---|
| Quadrant | BADHDUFLAG | Total packets | Discarded packets |
| A | 0 | 10694 | 3 |
| B | 0 | 14919 | 2 |
| C | 0 | 11443 | 2 |
| D | 0 | 17236 | 2 |
| Mode SS | |||
|---|---|---|---|
| Quadrant | BADHDUFLAG | Total packets | Discarded packets |
| A | 0 | 106 | 0 |
| B | 0 | 106 | 0 |
| C | 0 | 106 | 0 |
| D | 0 | 106 | 0 |
| Mode M9 | |||
|---|---|---|---|
| Quadrant | BADHDUFLAG | Total packets | Discarded packets |
| A | 0 | 25 | 0 |
| B | 0 | 25 | 0 |
| C | 0 | 25 | 0 |
| D | 0 | 26 | 0 |
| Quadrant | Total seconds | Saturated seconds | Saturation percentage |
|---|---|---|---|
| A | 5150 | 18 | 0.349515% |
| B | 5150 | 457 | 8.873786% |
| C | 5150 | 77 | 1.495146% |
| D | 5150 | 451 | 8.757282% |
Noise dominated data is calculated using 1-second bins in cleaned event files. If a bin has >2000 counts, and if more than 50% of those come from <1% of pixels, then it is considered to be noise-dominated and hence unusable.
| Quadrant | # 1 sec bins | Bins with >0 counts | Bins with >2000 counts | High rate bins dominated by noise | Noise dominated (total time) | Noise dominated (detector-on time) | Marked lightcurve |
|---|---|---|---|---|---|---|---|
| A | 7003 | 5151 | 7 | 7 | 0.10% | 0.14% | 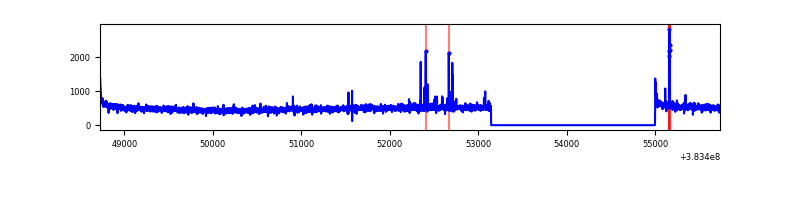 |
| B | 7003 | 5151 | 307 | 307 | 4.38% | 5.96% | 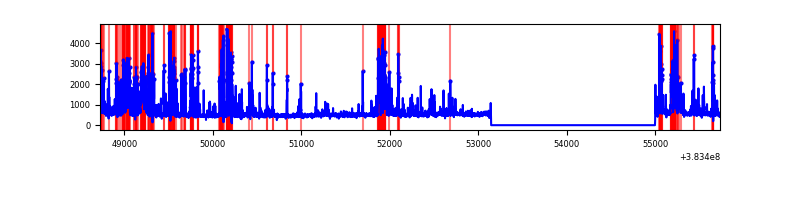 |
| C | 7003 | 5151 | 47 | 47 | 0.67% | 0.91% | 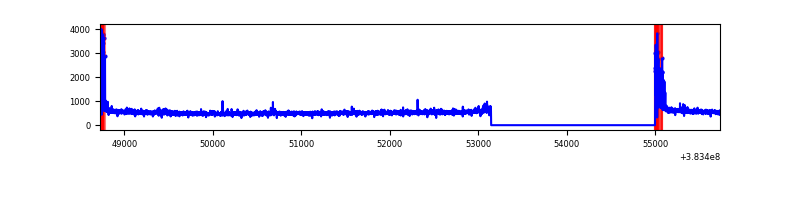 |
| D | 7003 | 5151 | 373 | 373 | 5.33% | 7.24% | 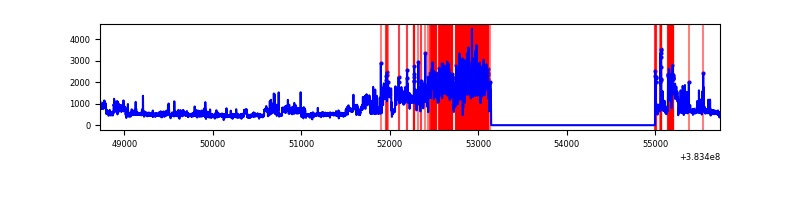 |
Top three noisy pixels from each quadrant. If the there are fewer than three noisy pixels in the level2.evt file, extra rows are filled as -1
| Pixel properties | Quadrant properties | ||||||
|---|---|---|---|---|---|---|---|
| Quadrant | DetID | PixID | Counts | Sigma | Mean | Median | Sigma |
| A | 10 | 83 | 45667 | 354.81 | 633 | 621 | 127.0 |
| A | 9 | 143 | 26769 | 205.96 | 633 | 621 | 127.0 |
| A | 15 | 174 | 16139 | 122.23 | 633 | 621 | 127.0 |
| B | 5 | 172 | 1294519 | 11022.52 | 613 | 598 | 117.4 |
| B | 5 | 255 | 115439 | 978.3 | 613 | 598 | 117.4 |
| B | 15 | 201 | 45081 | 378.94 | 613 | 598 | 117.4 |
| C | 15 | 214 | 223047 | 1565.94 | 610 | 615 | 142.0 |
| C | 0 | 10 | 195961 | 1375.25 | 610 | 615 | 142.0 |
| C | 14 | 67 | 55025 | 383.05 | 610 | 615 | 142.0 |
| D | 8 | 195 | 1397794 | 9525.49 | 595 | 577 | 146.7 |
| D | 12 | 233 | 499071 | 3398.47 | 595 | 577 | 146.7 |
| D | 12 | 235 | 177044 | 1203.06 | 595 | 577 | 146.7 |
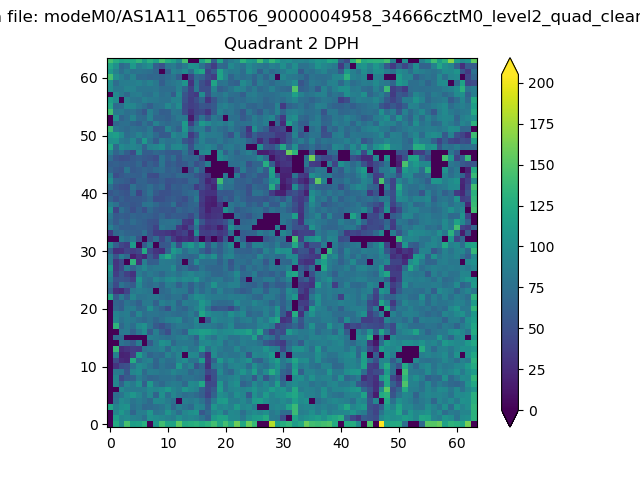
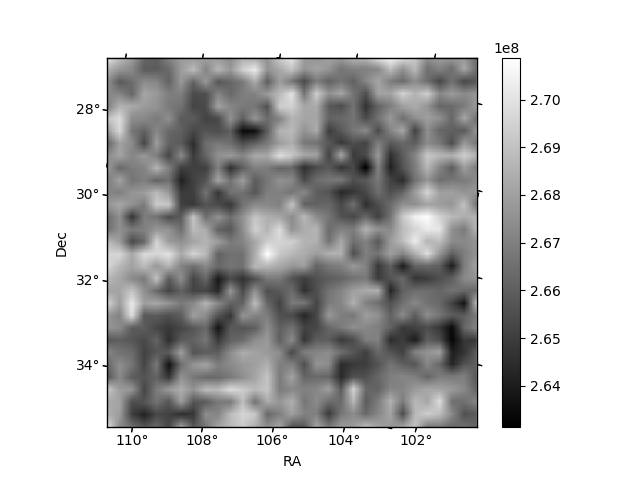
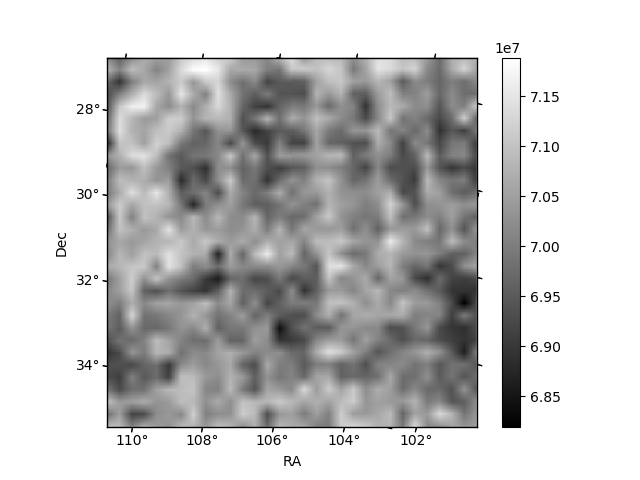
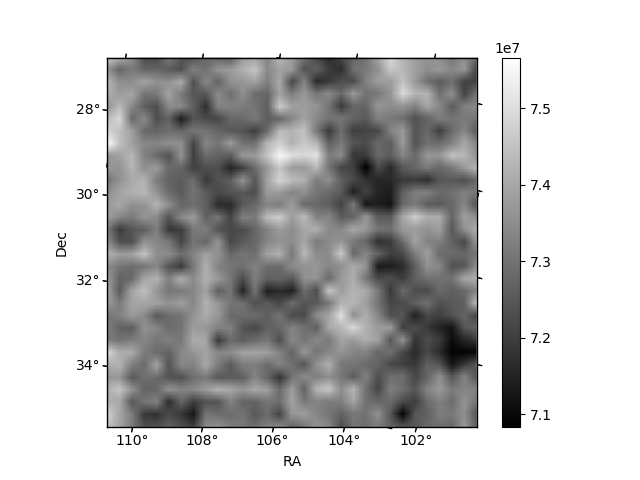
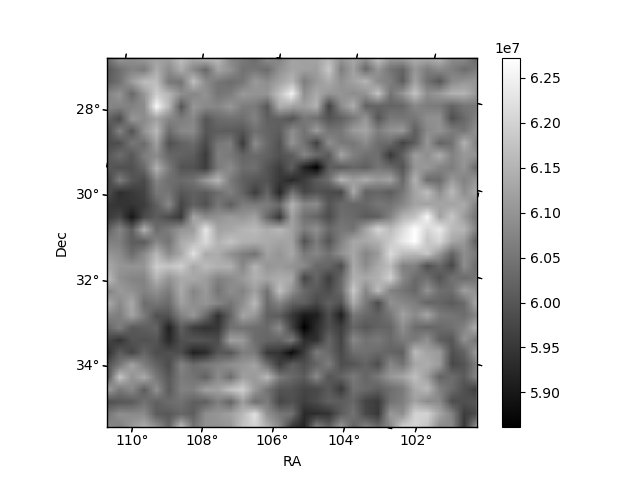
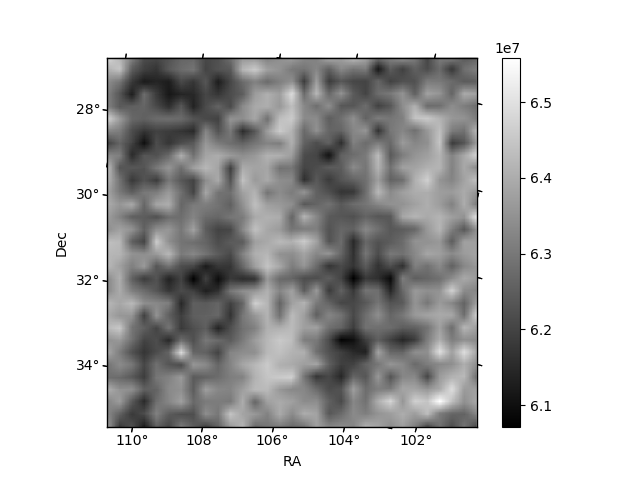
Histogram calculated using DETX and DETY for each event in the final _common_clean file
| Quadrant A | 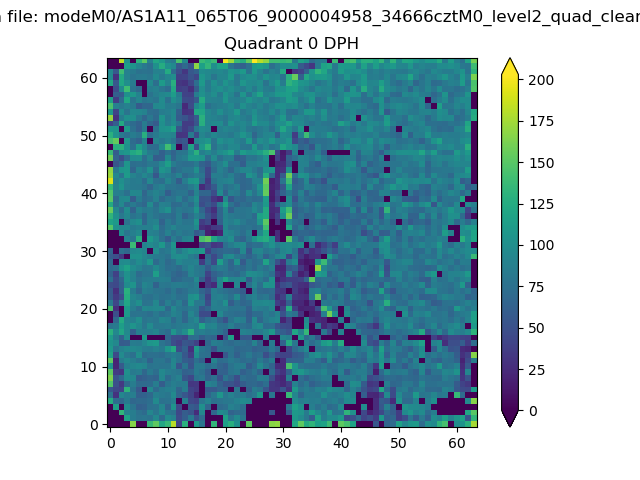 |
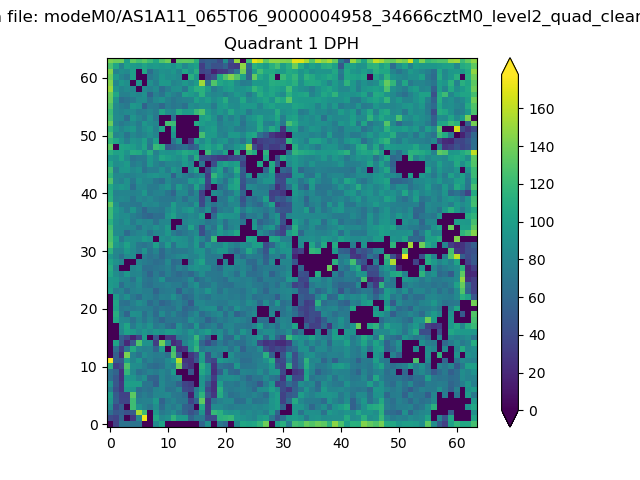 |
Quadrant B |
|---|---|---|---|
| Quadrant D | 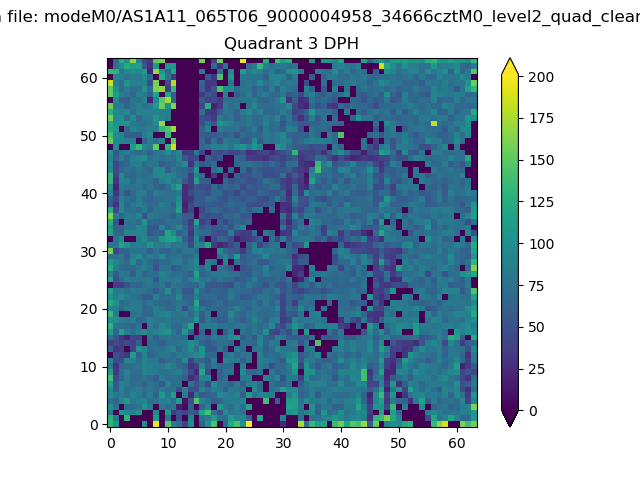 |
 |
Quadrant C |
| Plot type | Count rate plots | Images |
|---|---|---|
| Comparison with Poisson distribution Blue bars denote a histogram of data divided into 1 sec bins. Red curve is a Poisson curve with rate = median count rate of data. |
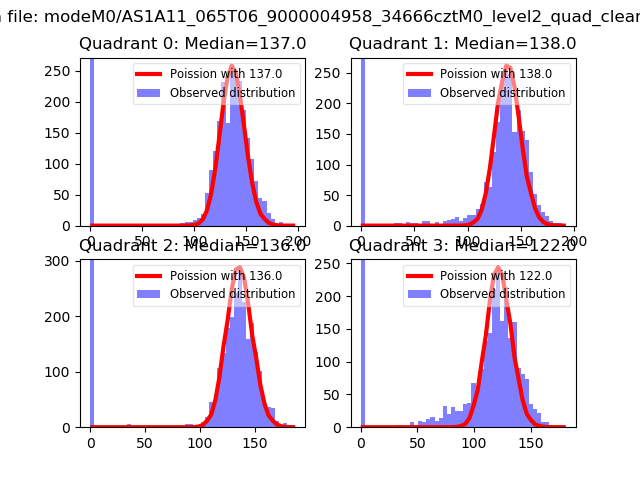 |
 |
| Quadrant-wise count rates Data is divided into 100 sec bins |
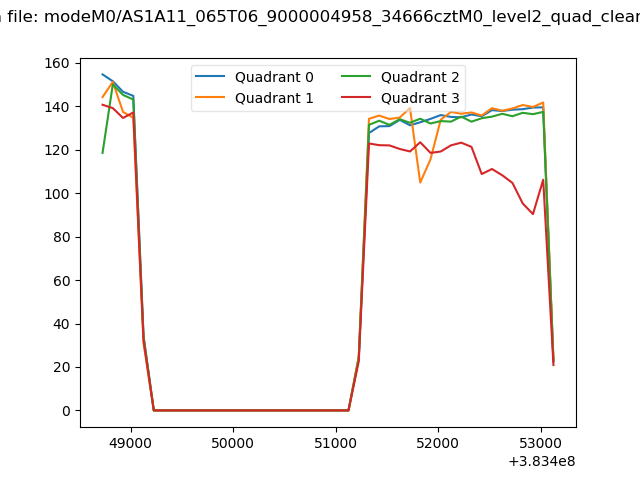 |
|
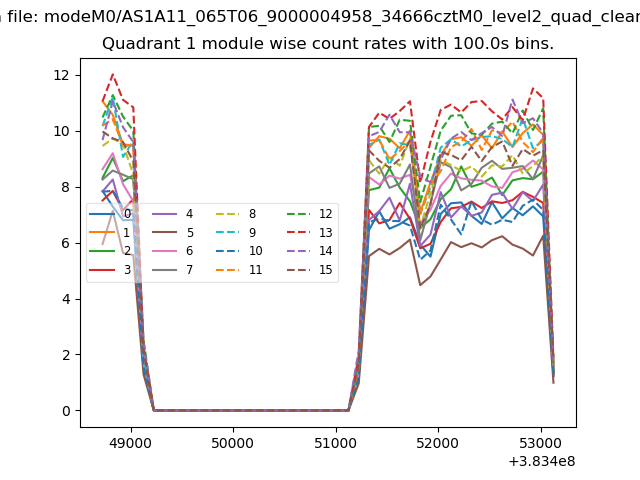
| Module-wise count rates for Quadrant A Data is divided into 100 sec bins |
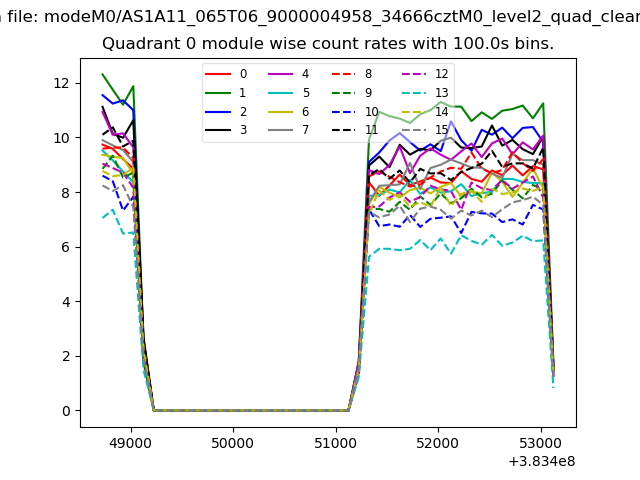 |
 |
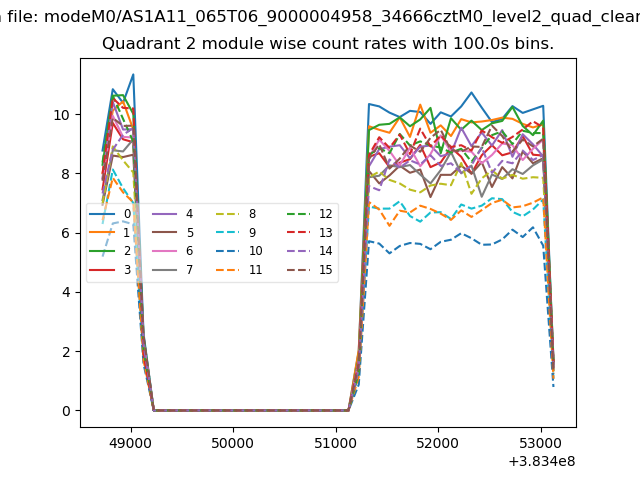
| Module-wise count rates for Quadrant B Data is divided into 100 sec bins |
 |
 |
| Module-wise count rates for Quadrant C Data is divided into 100 sec bins |
 |
 |
| Module-wise count rates for Quadrant D Data is divided into 100 sec bins |
 |
 |
| Parameter | Plot |
|---|---|
| CZT HV Monitor | 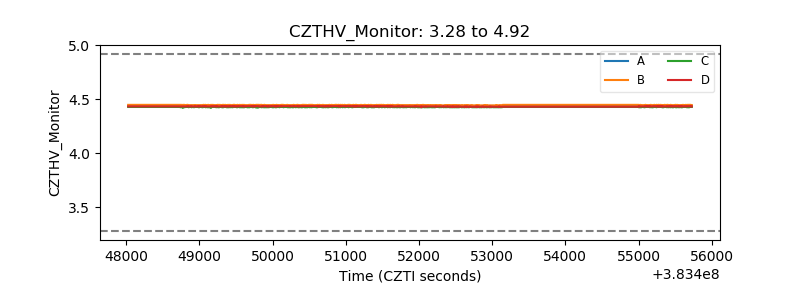 |
| D_VDD | 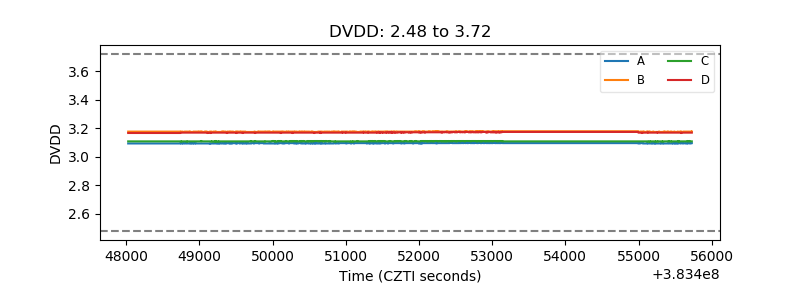 |
| Temperature 1 | 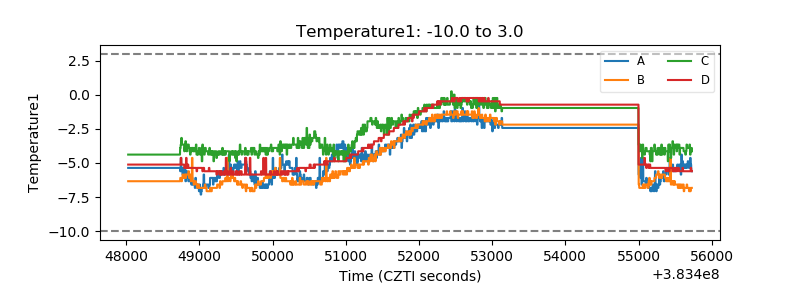 |
| Veto HV Monitor | 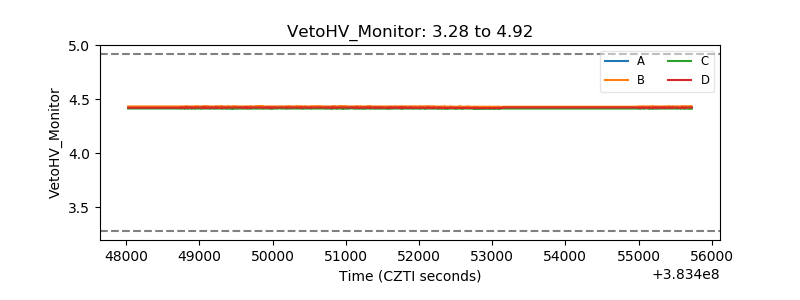 |
| Veto LLD | 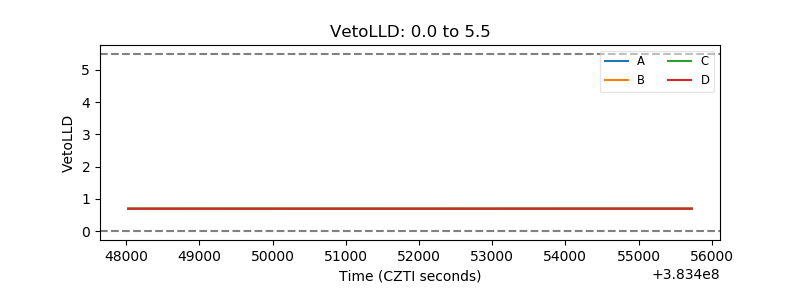 |
| Alpha Counter | 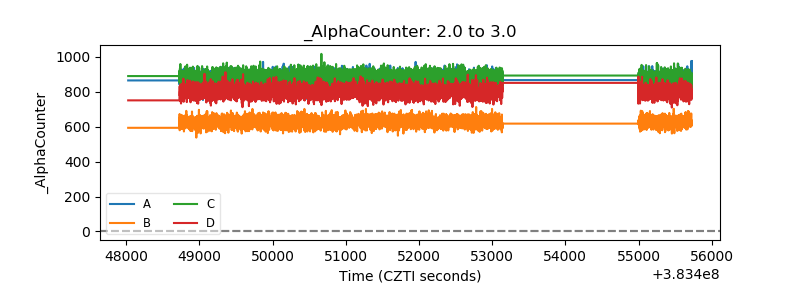 |
| _CPM_Rate | 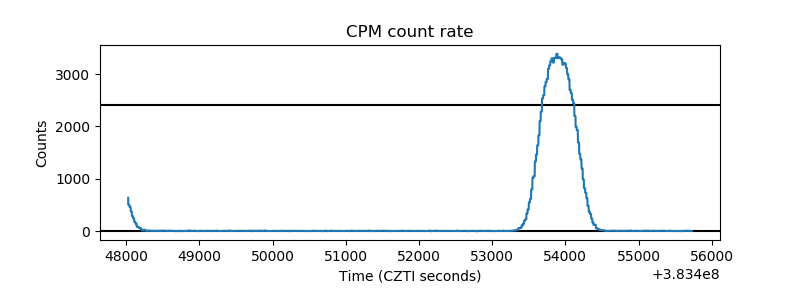 |
| CZT Counter | 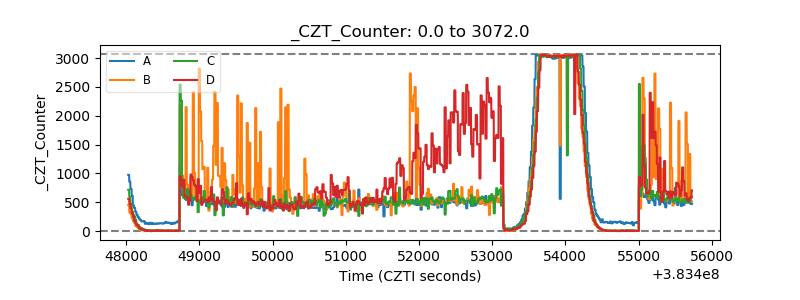 |
| +2.5 Volts monitor | 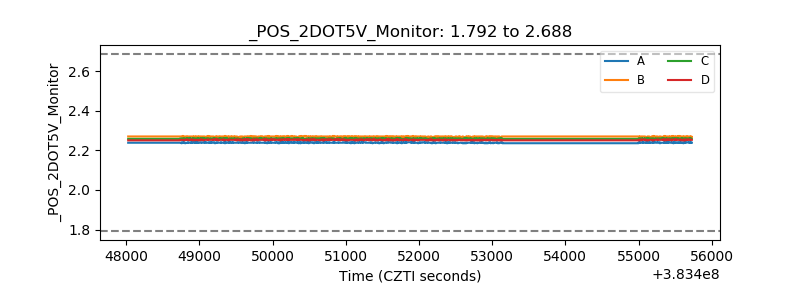 |
| +5 Volts monitor | 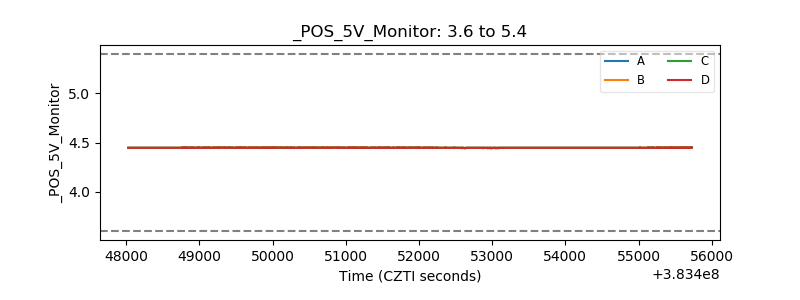 |
| _ROLL_ROT | 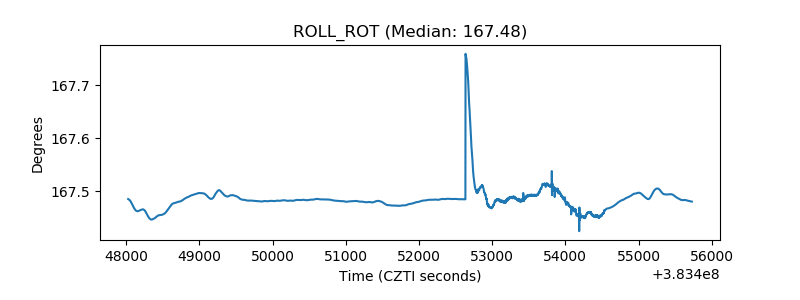 |
| _Roll_DEC | 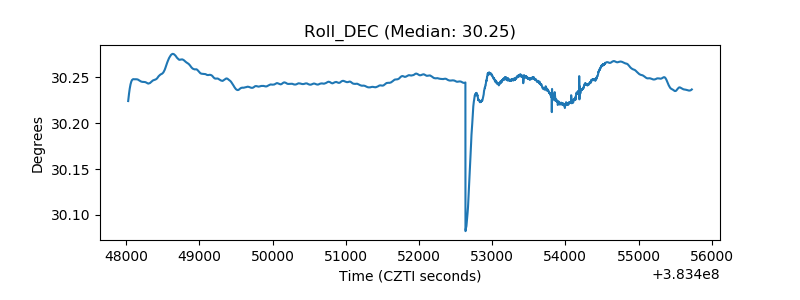 |
| _Roll_RA | 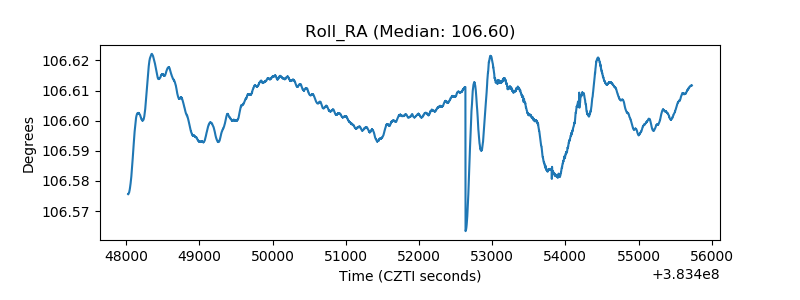 |
| Veto Counter | 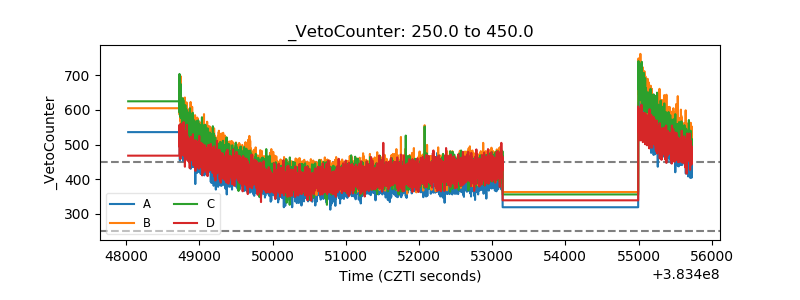 |