| Param | Original file | Final file |
|---|---|---|
| Filename | modeM0/AS1T05_008T01_9000004956_34659cztM0_level2.evt | modeM0/AS1T05_008T01_9000004956_34659cztM0_level2_quad_clean.evt |
| Size (bytes) | 599,492,160 | 79,436,160 |
| Size | 571.7 MB | 75.8 MB |
| Events in quadrant A | 2,782,205 | 515,302 |
| Events in quadrant B | 4,383,591 | 503,783 |
| Events in quadrant C | 3,065,826 | 512,360 |
| Events in quadrant D | 7,527,515 | 464,097 |
| Mode SS | |||
|---|---|---|---|
| Quadrant | BADHDUFLAG | Total packets | Discarded packets |
| A | 0 | 120 | 0 |
| B | 0 | 120 | 0 |
| C | 0 | 120 | 0 |
| D | 0 | 120 | 0 |
| Mode M9 | |||
|---|---|---|---|
| Quadrant | BADHDUFLAG | Total packets | Discarded packets |
| A | 0 | 23 | 0 |
| B | 0 | 23 | 0 |
| C | 0 | 23 | 0 |
| D | 0 | 24 | 0 |
| Mode M0 | |||
|---|---|---|---|
| Quadrant | BADHDUFLAG | Total packets | Discarded packets |
| A | 0 | 12139 | 3 |
| B | 0 | 16918 | 2 |
| C | 0 | 12593 | 2 |
| D | 0 | 26523 | 2 |
| Quadrant | Total seconds | Saturated seconds | Saturation percentage |
|---|---|---|---|
| A | 5860 | 30 | 0.511945% |
| B | 5860 | 537 | 9.163823% |
| C | 5860 | 58 | 0.989761% |
| D | 5860 | 930 | 15.870307% |
Noise dominated data is calculated using 1-second bins in cleaned event files. If a bin has >2000 counts, and if more than 50% of those come from <1% of pixels, then it is considered to be noise-dominated and hence unusable.
| Quadrant | # 1 sec bins | Bins with >0 counts | Bins with >2000 counts | High rate bins dominated by noise | Noise dominated (total time) | Noise dominated (detector-on time) | Marked lightcurve |
|---|---|---|---|---|---|---|---|
| A | 7173 | 5861 | 15 | 15 | 0.21% | 0.26% | 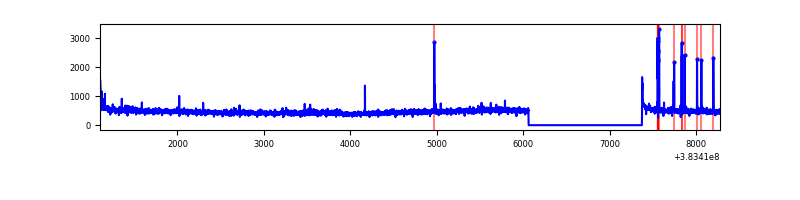 |
| B | 7173 | 5861 | 301 | 301 | 4.20% | 5.14% | 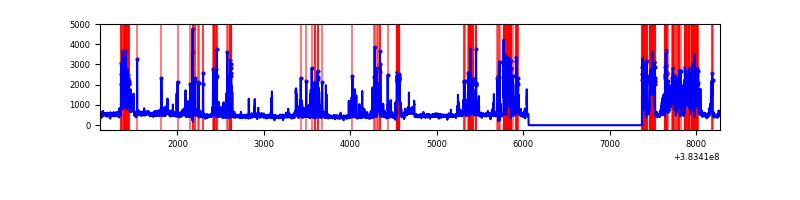 |
| C | 7173 | 5861 | 39 | 39 | 0.54% | 0.67% | 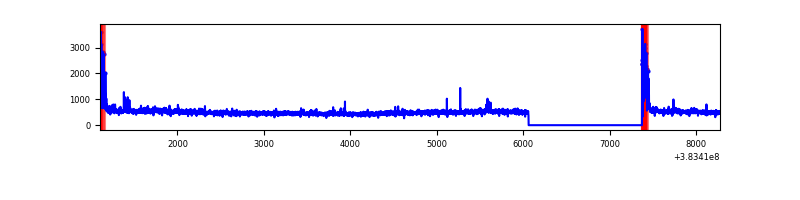 |
| D | 7173 | 5861 | 838 | 838 | 11.68% | 14.30% | 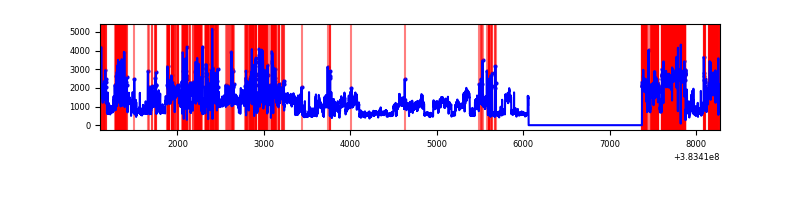 |
Top three noisy pixels from each quadrant. If the there are fewer than three noisy pixels in the level2.evt file, extra rows are filled as -1
| Pixel properties | Quadrant properties | ||||||
|---|---|---|---|---|---|---|---|
| Quadrant | DetID | PixID | Counts | Sigma | Mean | Median | Sigma |
| A | 9 | 143 | 70376 | 507.64 | 678 | 662 | 137.3 |
| A | 10 | 83 | 50146 | 360.33 | 678 | 662 | 137.3 |
| A | 7 | 191 | 16621 | 116.21 | 678 | 662 | 137.3 |
| B | 5 | 172 | 1444148 | 11449.3 | 653 | 634 | 126.1 |
| B | 5 | 255 | 85962 | 676.78 | 653 | 634 | 126.1 |
| B | 0 | 218 | 74877 | 588.86 | 653 | 634 | 126.1 |
| C | 15 | 214 | 248135 | 1605.0 | 657 | 661 | 154.2 |
| C | 0 | 10 | 182261 | 1177.77 | 657 | 661 | 154.2 |
| C | 14 | 67 | 51450 | 329.39 | 657 | 661 | 154.2 |
| D | 8 | 195 | 2928378 | 18881.71 | 619 | 600 | 155.1 |
| D | 13 | 249 | 652872 | 4206.61 | 619 | 600 | 155.1 |
| D | 3 | 13 | 542034 | 3491.8 | 619 | 600 | 155.1 |
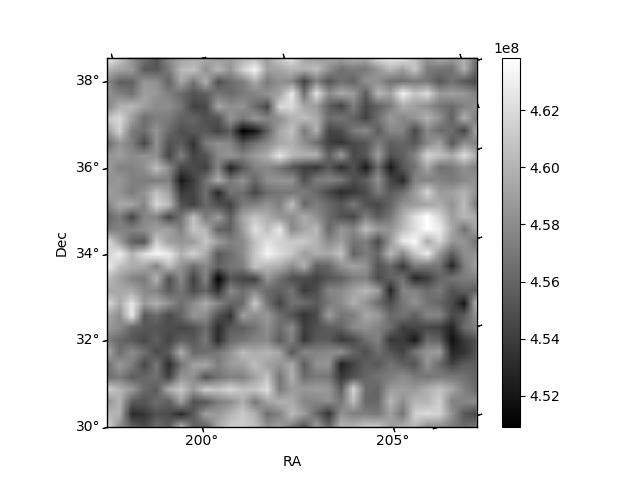
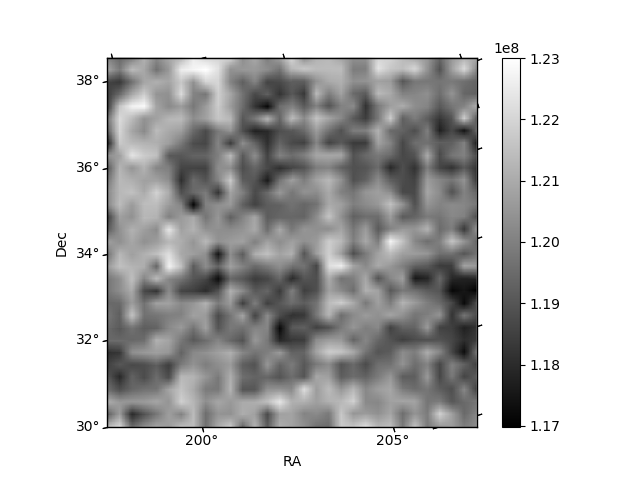
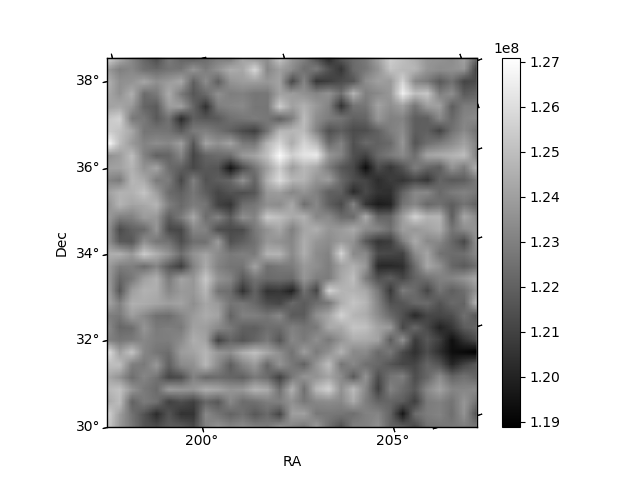
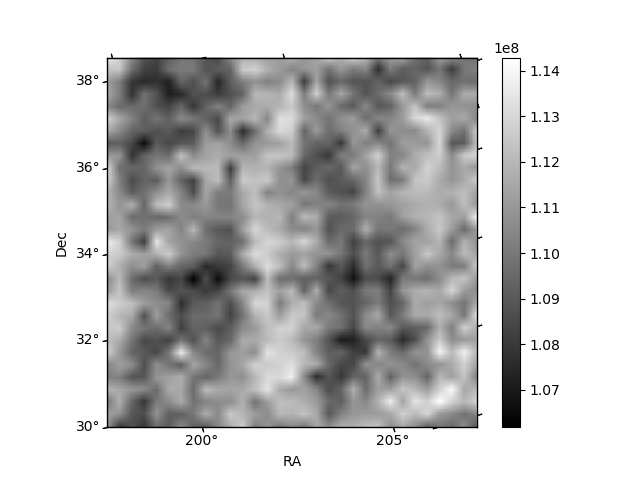
Histogram calculated using DETX and DETY for each event in the final _common_clean file
| Quadrant A | 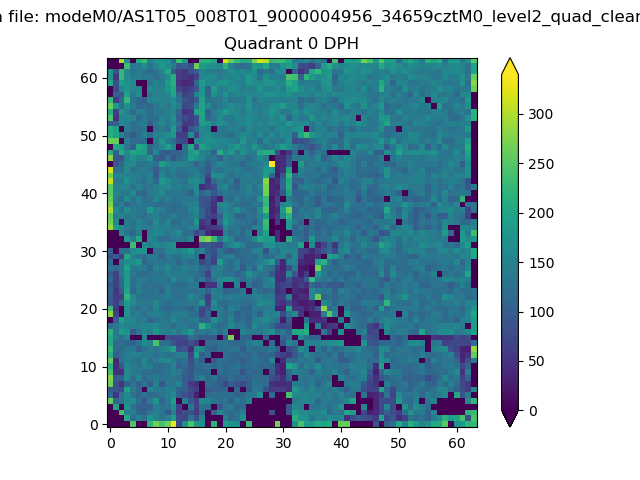 |
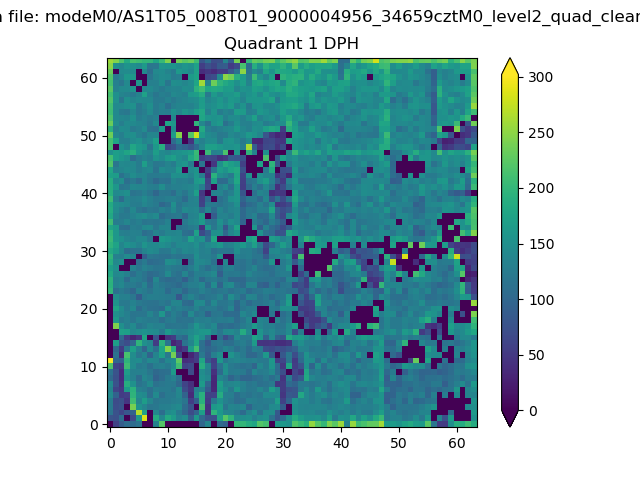 |
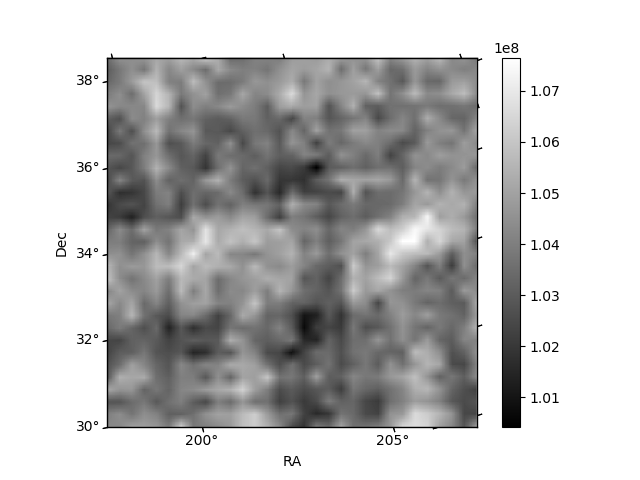
Quadrant B |
|---|---|---|---|
| Quadrant D |  |
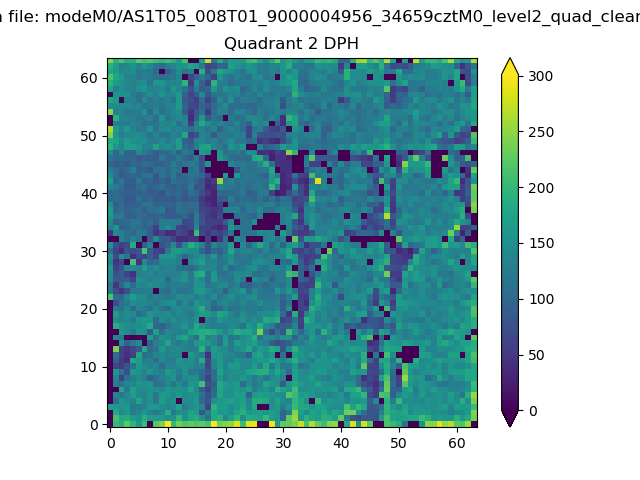 |
Quadrant C |
| Plot type | Count rate plots | Images |
|---|---|---|
| Comparison with Poisson distribution Blue bars denote a histogram of data divided into 1 sec bins. Red curve is a Poisson curve with rate = median count rate of data. |
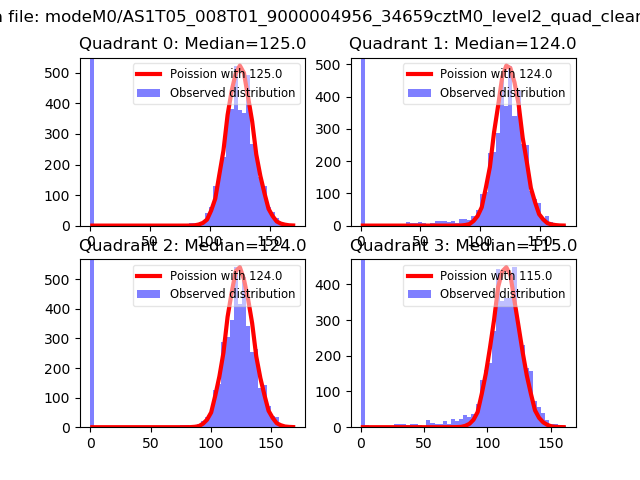 |
 |
| Quadrant-wise count rates Data is divided into 100 sec bins |
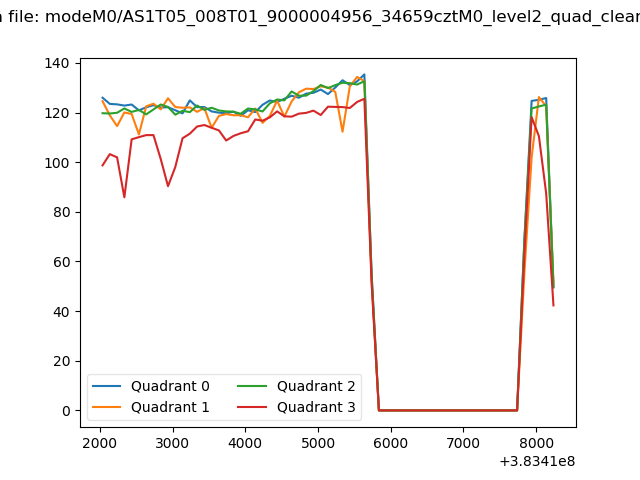 |
|
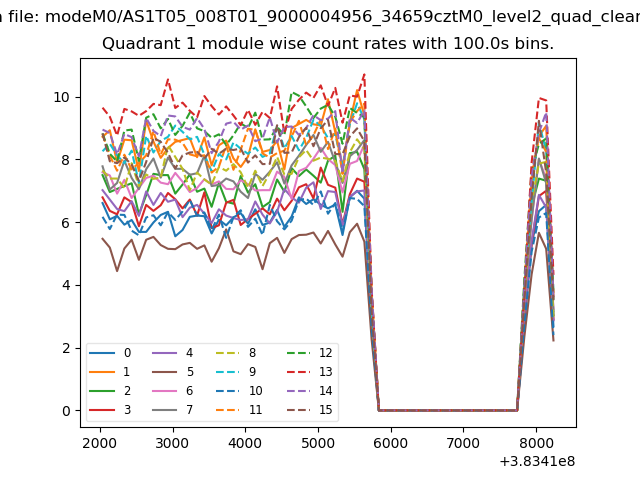
| Module-wise count rates for Quadrant A Data is divided into 100 sec bins |
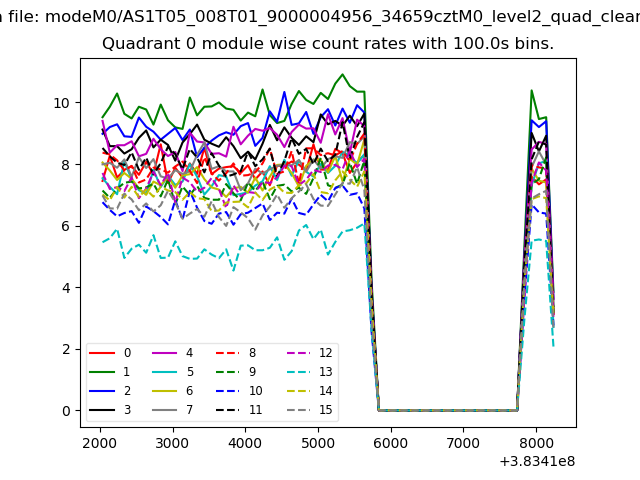 |
 |
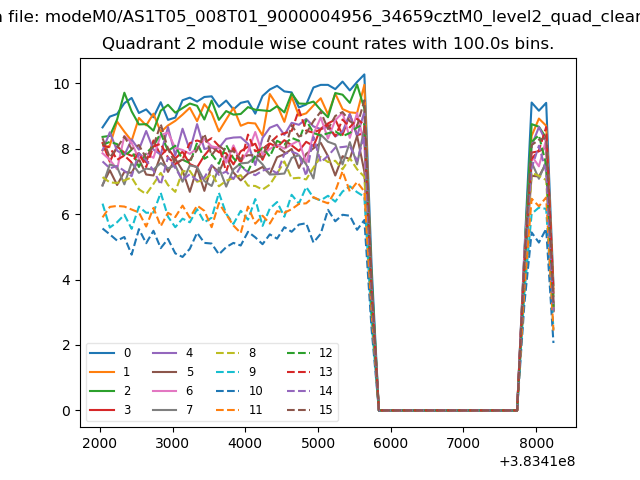
| Module-wise count rates for Quadrant B Data is divided into 100 sec bins |
 |
 |
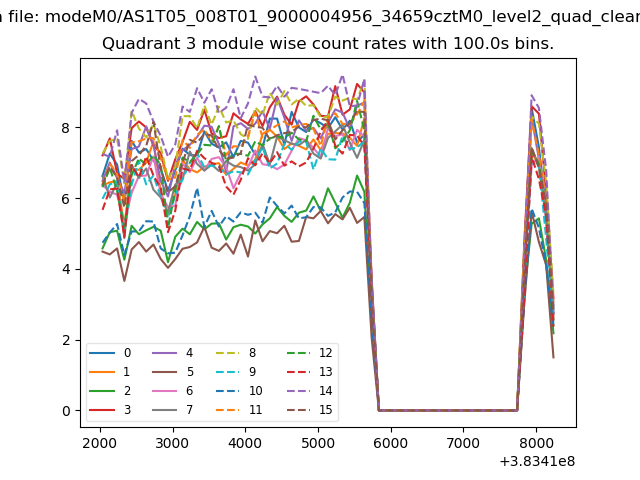
| Module-wise count rates for Quadrant C Data is divided into 100 sec bins |
 |
 |
| Module-wise count rates for Quadrant D Data is divided into 100 sec bins |
 |
 |
| Parameter | Plot |
|---|---|
| CZT HV Monitor | 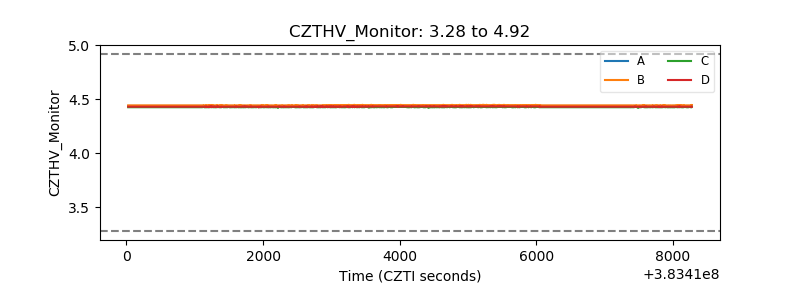 |
| D_VDD | 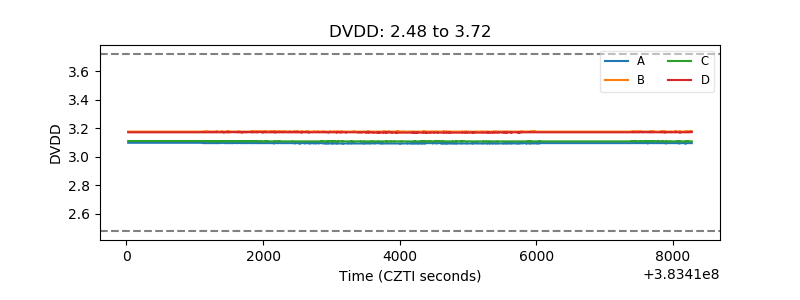 |
| Temperature 1 | 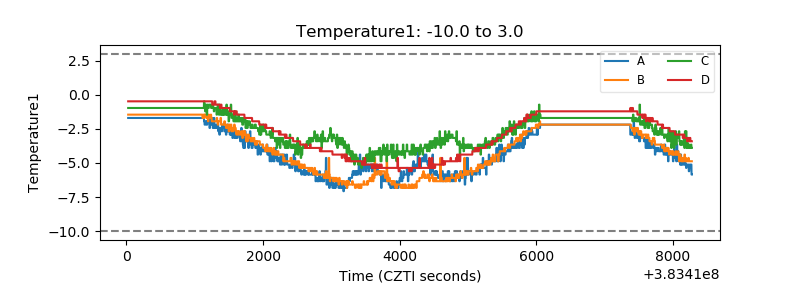 |
| Veto HV Monitor | 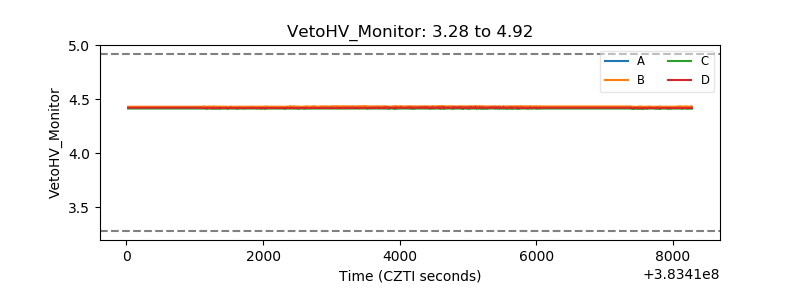 |
| Veto LLD | 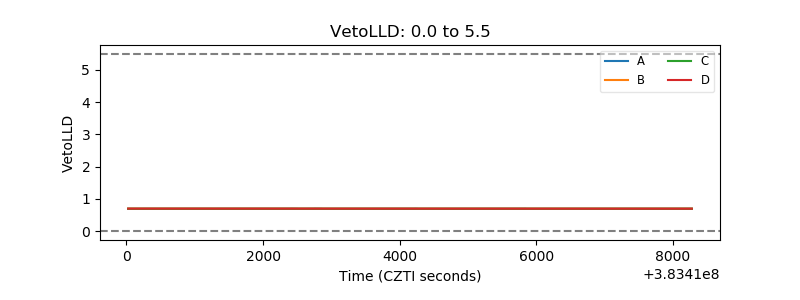 |
| Alpha Counter | 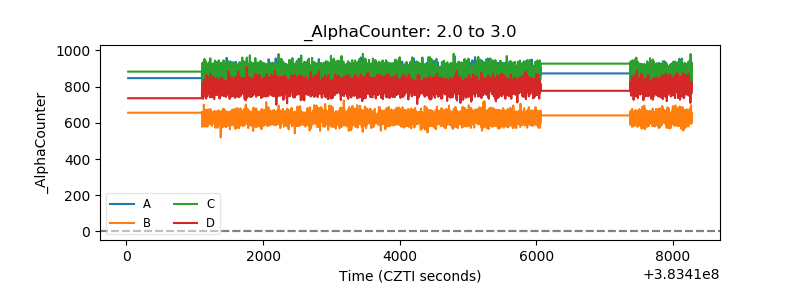 |
| _CPM_Rate | 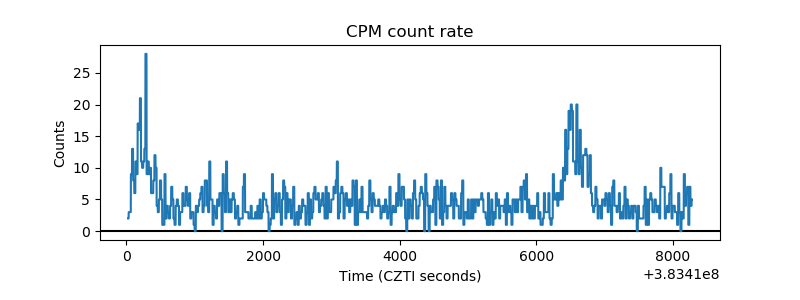 |
| CZT Counter | 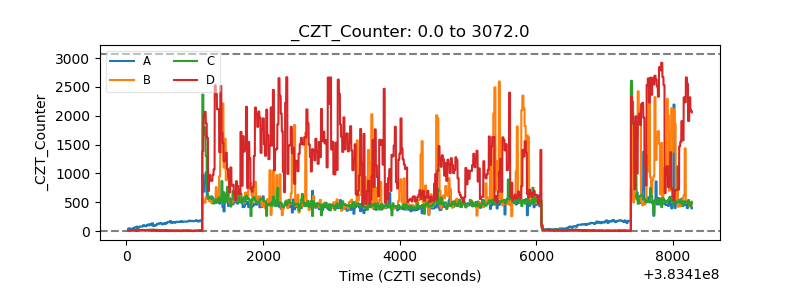 |
| +2.5 Volts monitor | 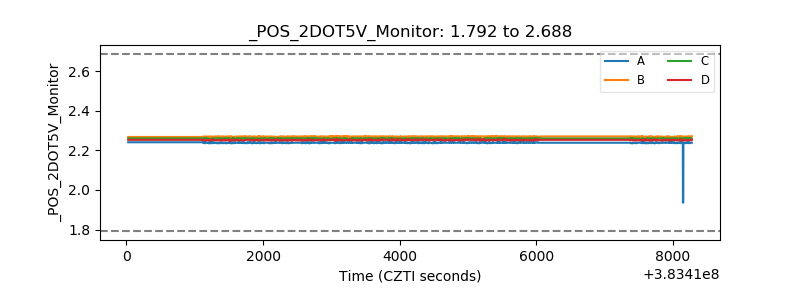 |
| +5 Volts monitor | 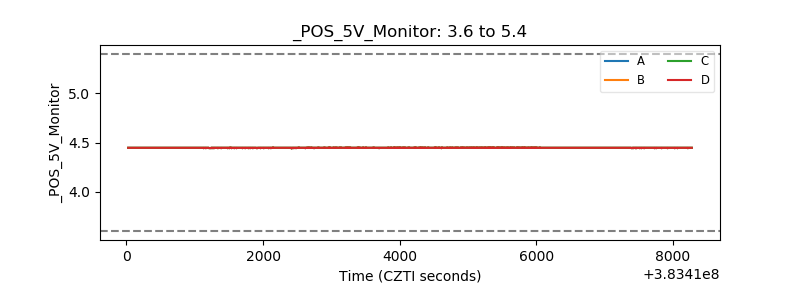 |
| _ROLL_ROT | 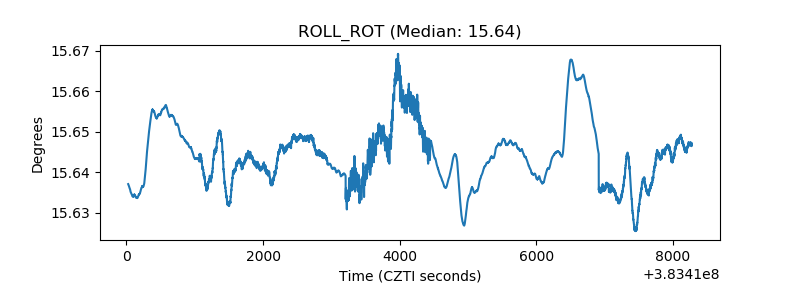 |
| _Roll_DEC | 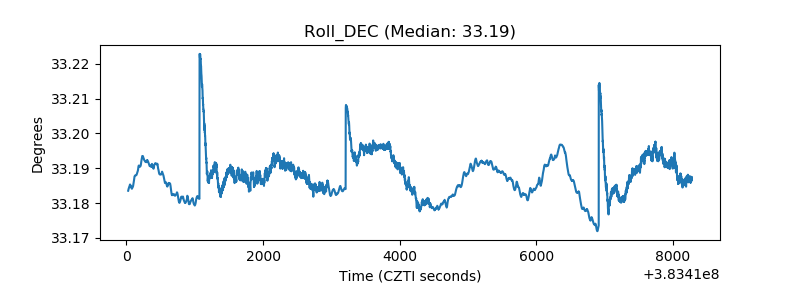 |
| _Roll_RA | 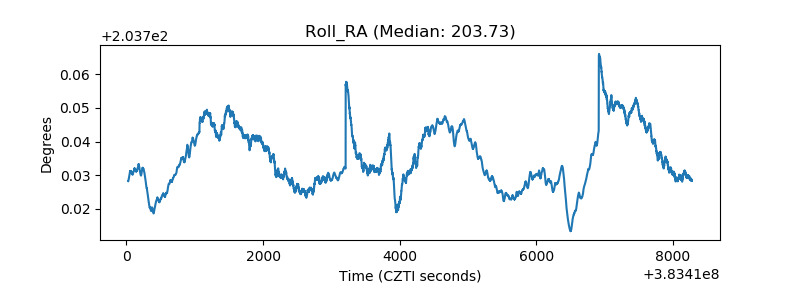 |
| Veto Counter | 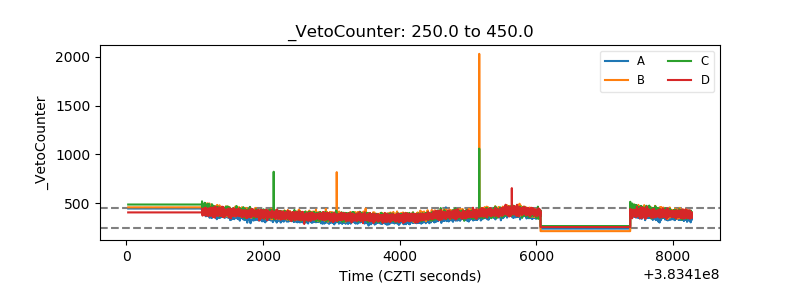 |