| Param | Original file | Final file |
|---|---|---|
| Filename | modeM0/AS1T05_008T01_9000004956_34652cztM0_level2.evt | modeM0/AS1T05_008T01_9000004956_34652cztM0_level2_quad_clean.evt |
| Size (bytes) | 456,016,320 | 73,560,960 |
| Size | 434.9 MB | 70.2 MB |
| Events in quadrant A | 2,639,821 | 473,024 |
| Events in quadrant B | 3,207,098 | 477,557 |
| Events in quadrant C | 2,937,909 | 460,947 |
| Events in quadrant D | 4,660,128 | 438,449 |
| Mode SS | |||
|---|---|---|---|
| Quadrant | BADHDUFLAG | Total packets | Discarded packets |
| A | 0 | 110 | 0 |
| B | 0 | 110 | 0 |
| C | 0 | 110 | 0 |
| D | 0 | 110 | 0 |
| Mode M9 | |||
|---|---|---|---|
| Quadrant | BADHDUFLAG | Total packets | Discarded packets |
| A | 0 | 28 | 0 |
| B | 0 | 28 | 0 |
| C | 0 | 28 | 0 |
| D | 0 | 29 | 0 |
| Mode M0 | |||
|---|---|---|---|
| Quadrant | BADHDUFLAG | Total packets | Discarded packets |
| A | 0 | 11037 | 3 |
| B | 0 | 12783 | 2 |
| C | 0 | 11694 | 2 |
| D | 0 | 17549 | 2 |
| Quadrant | Total seconds | Saturated seconds | Saturation percentage |
|---|---|---|---|
| A | 5391 | 5 | 0.092747% |
| B | 5391 | 114 | 2.114636% |
| C | 5391 | 84 | 1.558152% |
| D | 5391 | 81 | 1.502504% |
Noise dominated data is calculated using 1-second bins in cleaned event files. If a bin has >2000 counts, and if more than 50% of those come from <1% of pixels, then it is considered to be noise-dominated and hence unusable.
| Quadrant | # 1 sec bins | Bins with >0 counts | Bins with >2000 counts | High rate bins dominated by noise | Noise dominated (total time) | Noise dominated (detector-on time) | Marked lightcurve |
|---|---|---|---|---|---|---|---|
| A | 7303 | 5392 | 1 | 1 | 0.01% | 0.02% | 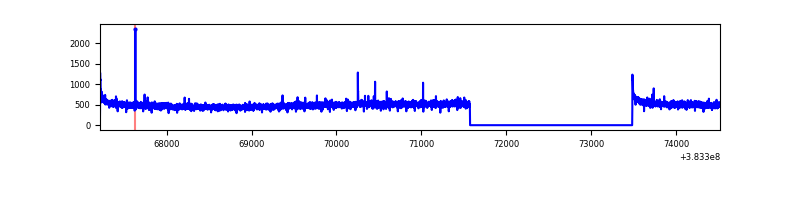 |
| B | 7303 | 5392 | 82 | 82 | 1.12% | 1.52% | 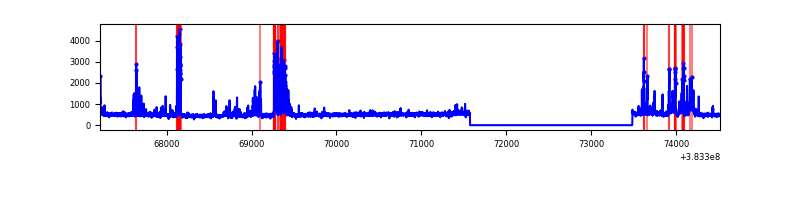 |
| C | 7303 | 5392 | 62 | 62 | 0.85% | 1.15% | 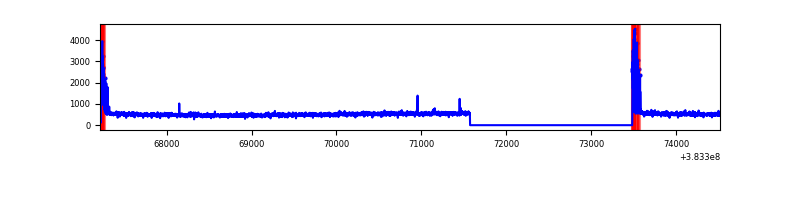 |
| D | 7303 | 5392 | 41 | 41 | 0.56% | 0.76% | 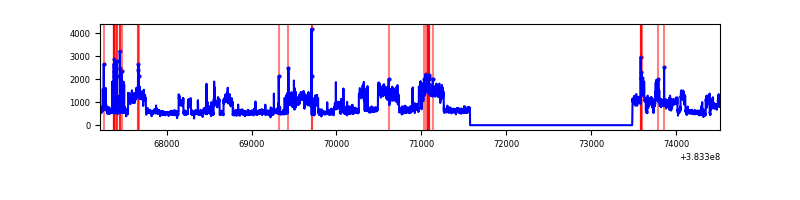 |
Top three noisy pixels from each quadrant. If the there are fewer than three noisy pixels in the level2.evt file, extra rows are filled as -1
| Pixel properties | Quadrant properties | ||||||
|---|---|---|---|---|---|---|---|
| Quadrant | DetID | PixID | Counts | Sigma | Mean | Median | Sigma |
| A | 10 | 83 | 46267 | 343.17 | 665 | 653 | 132.9 |
| A | 9 | 143 | 11373 | 80.65 | 665 | 653 | 132.9 |
| A | 13 | 6 | 11155 | 79.01 | 665 | 653 | 132.9 |
| B | 5 | 172 | 550904 | 4483.04 | 651 | 637 | 122.7 |
| B | 4 | 171 | 57030 | 459.44 | 651 | 637 | 122.7 |
| B | 4 | 232 | 16569 | 129.8 | 651 | 637 | 122.7 |
| C | 15 | 214 | 227757 | 1576.05 | 629 | 633 | 144.1 |
| C | 0 | 10 | 218830 | 1514.1 | 629 | 633 | 144.1 |
| C | 14 | 67 | 20731 | 139.46 | 629 | 633 | 144.1 |
| D | 8 | 195 | 1931204 | 12297.29 | 636 | 618 | 157.0 |
| D | 2 | 250 | 120449 | 763.29 | 636 | 618 | 157.0 |
| D | 7 | 38 | 58911 | 371.31 | 636 | 618 | 157.0 |
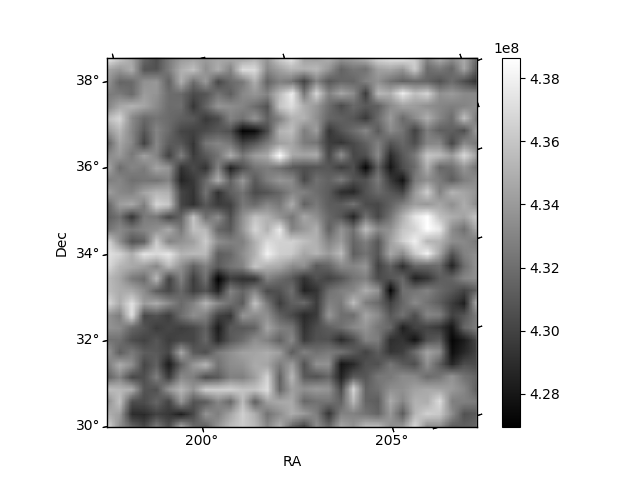
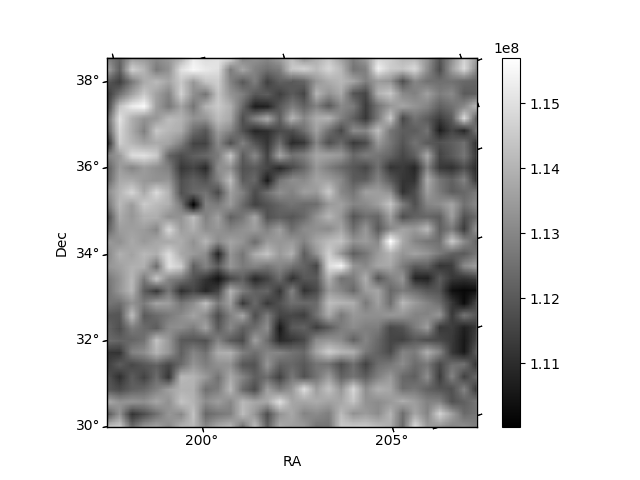
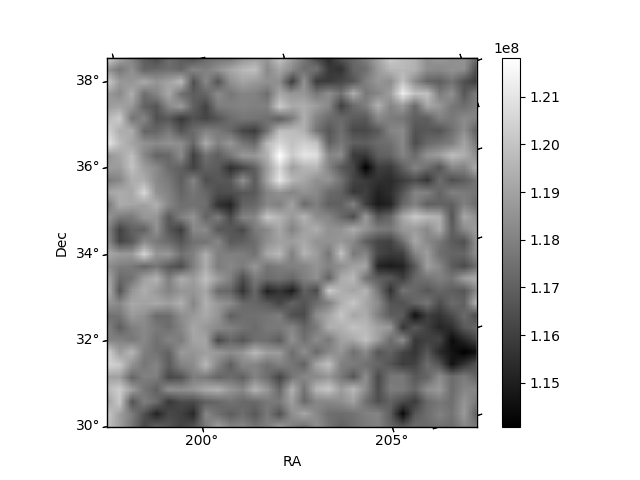
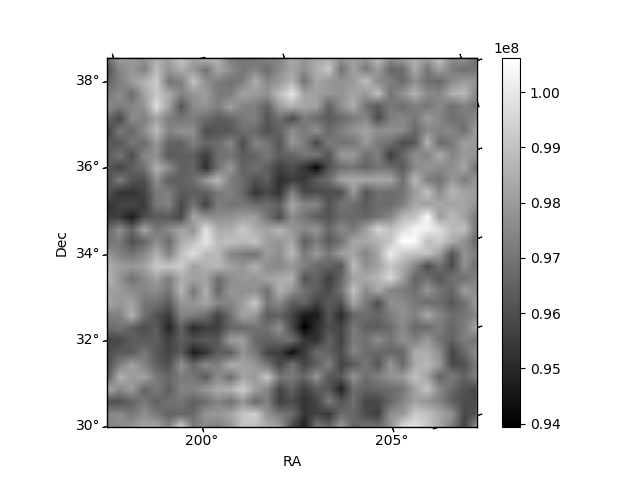
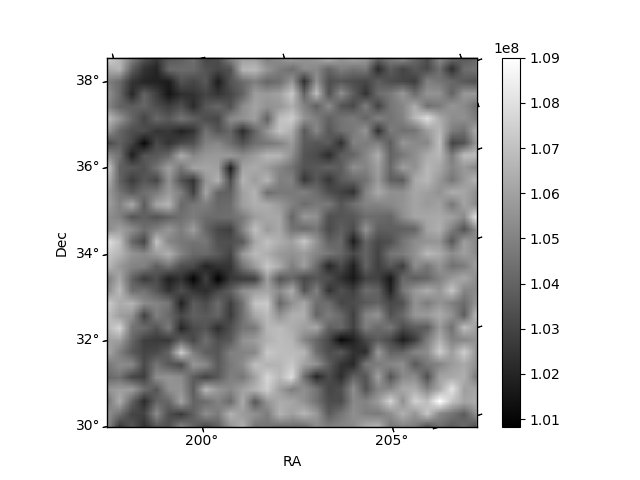
Histogram calculated using DETX and DETY for each event in the final _common_clean file
| Quadrant A | 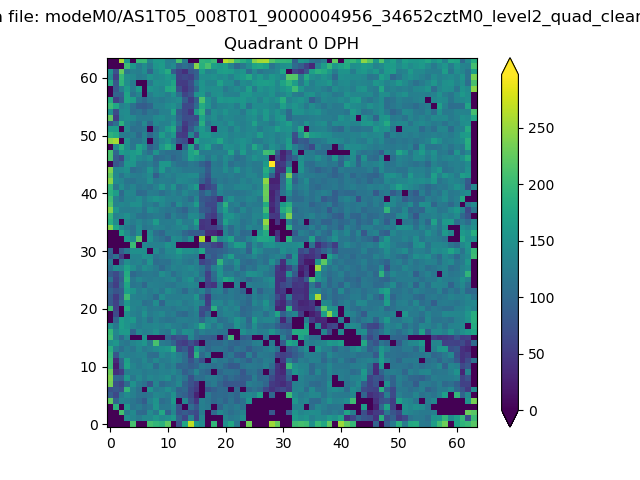 |
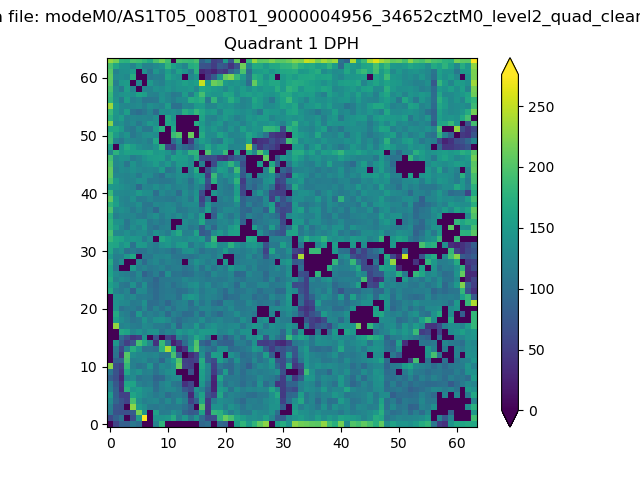 |
Quadrant B |
|---|---|---|---|
| Quadrant D | 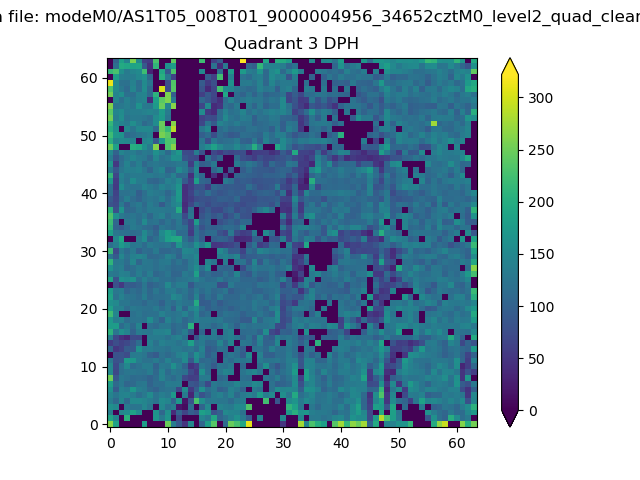 |
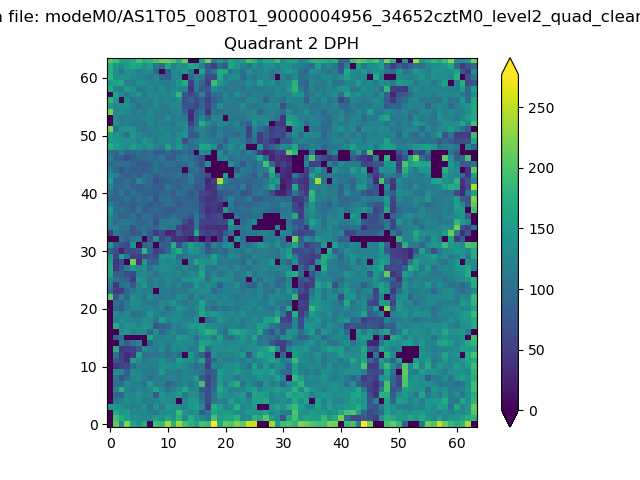 |
Quadrant C |
| Plot type | Count rate plots | Images |
|---|---|---|
| Comparison with Poisson distribution Blue bars denote a histogram of data divided into 1 sec bins. Red curve is a Poisson curve with rate = median count rate of data. |
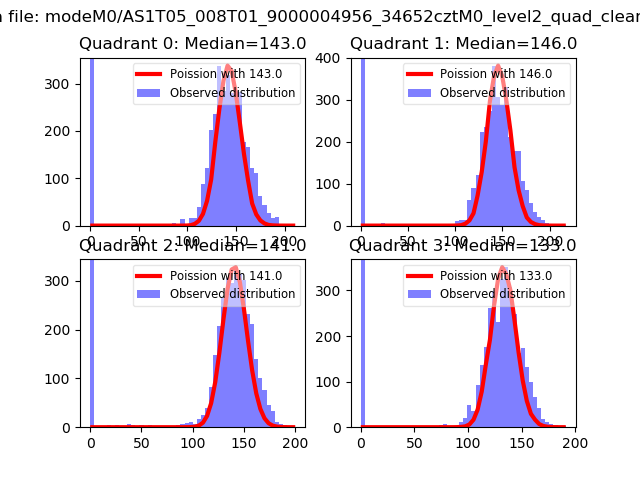 |
 |
| Quadrant-wise count rates Data is divided into 100 sec bins |
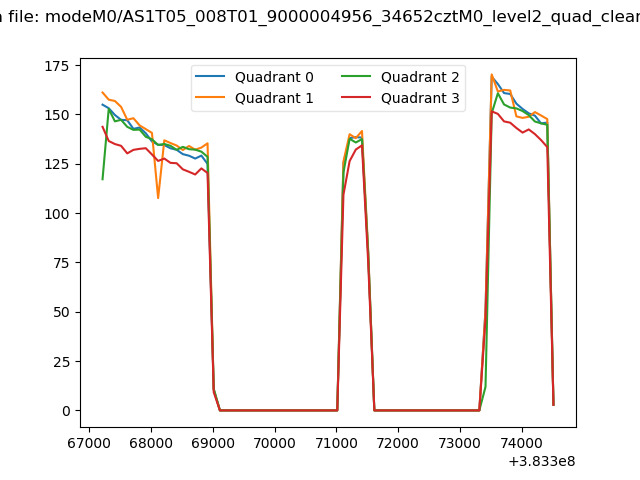 |
|
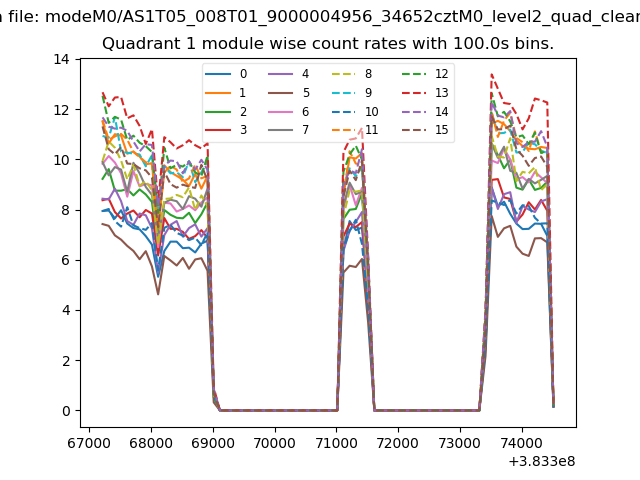
| Module-wise count rates for Quadrant A Data is divided into 100 sec bins |
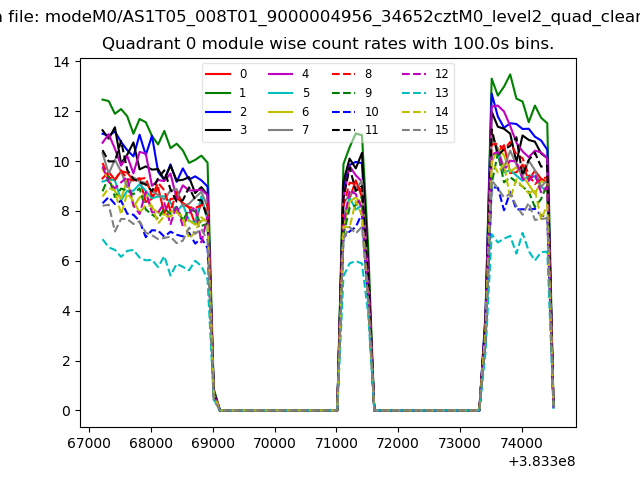 |
 |
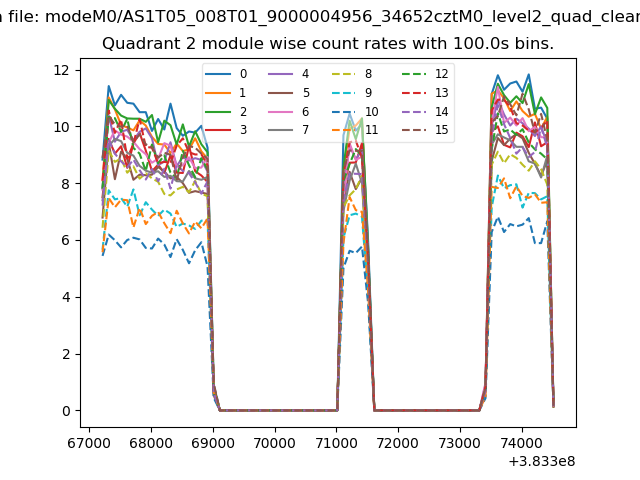
| Module-wise count rates for Quadrant B Data is divided into 100 sec bins |
 |
 |
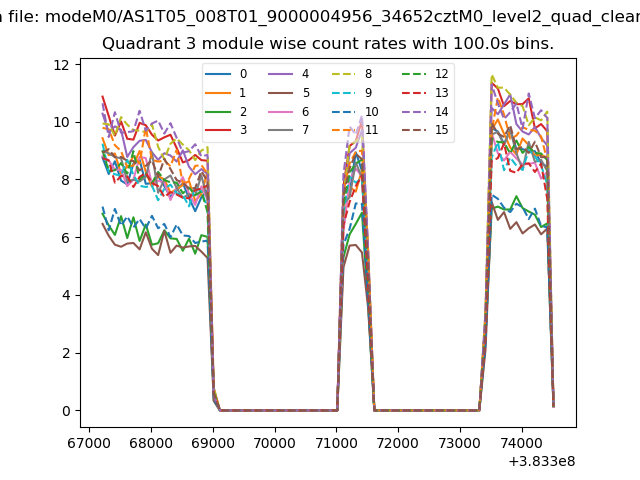
| Module-wise count rates for Quadrant C Data is divided into 100 sec bins |
 |
 |
| Module-wise count rates for Quadrant D Data is divided into 100 sec bins |
 |
 |
| Parameter | Plot |
|---|---|
| CZT HV Monitor | 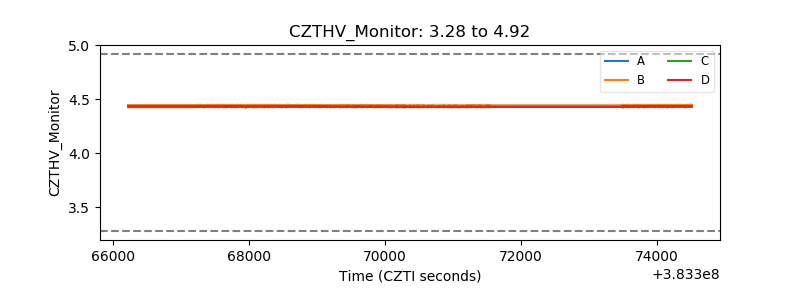 |
| D_VDD | 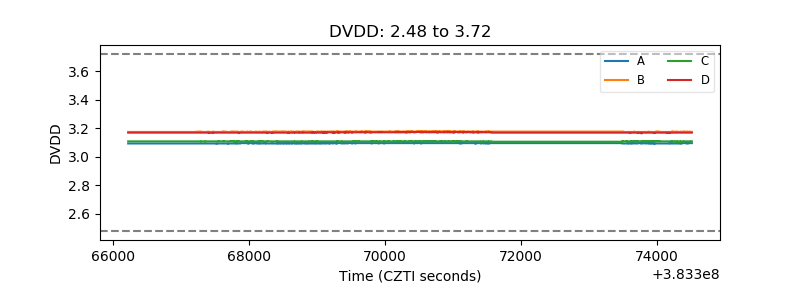 |
| Temperature 1 | 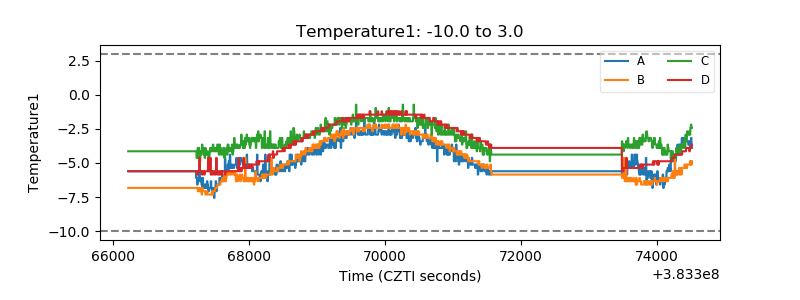 |
| Veto HV Monitor | 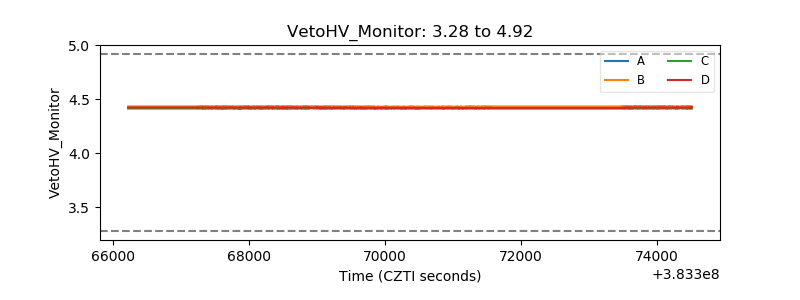 |
| Veto LLD | 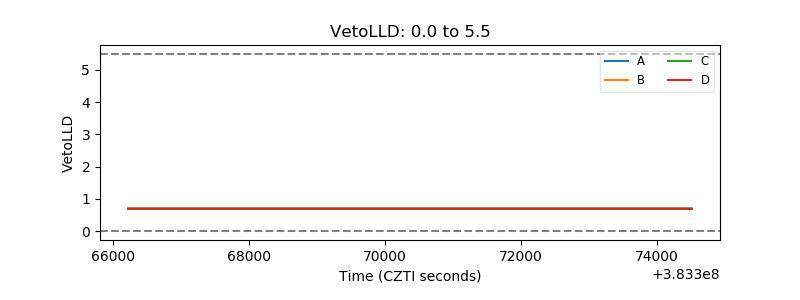 |
| Alpha Counter | 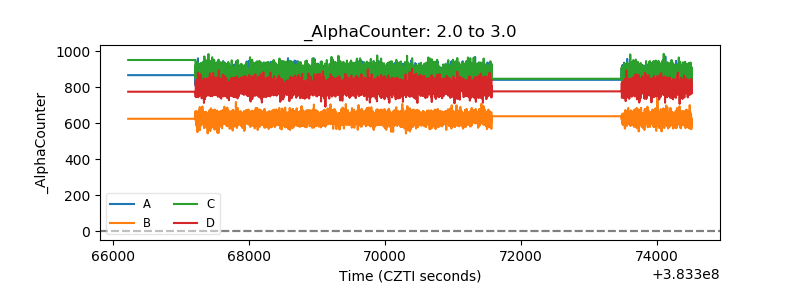 |
| _CPM_Rate | 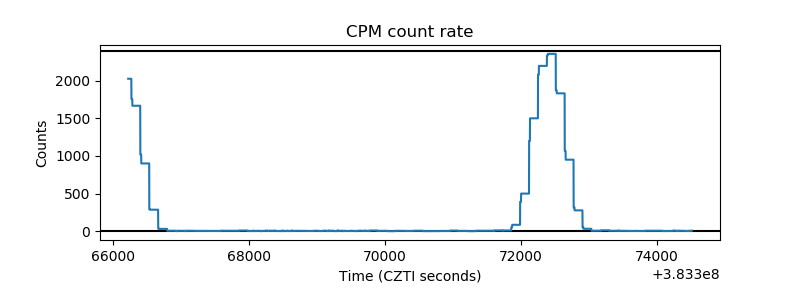 |
| CZT Counter | 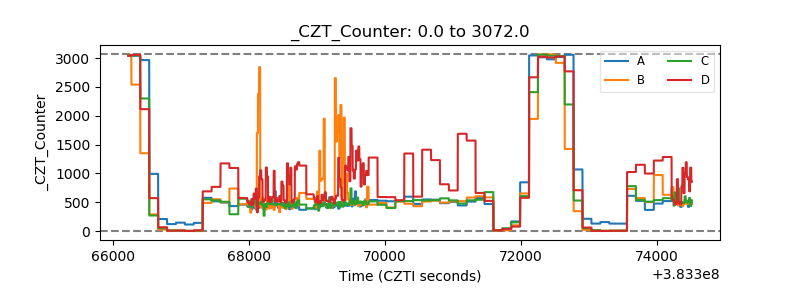 |
| +2.5 Volts monitor | 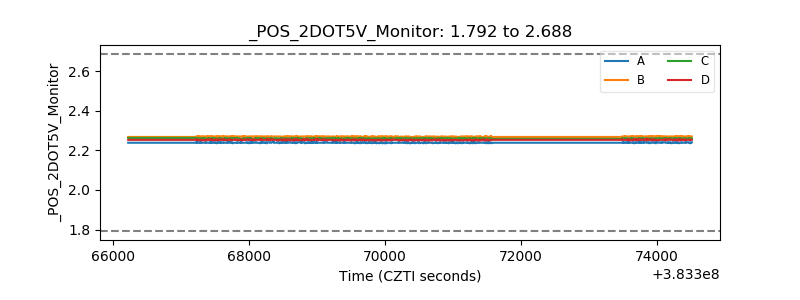 |
| +5 Volts monitor | 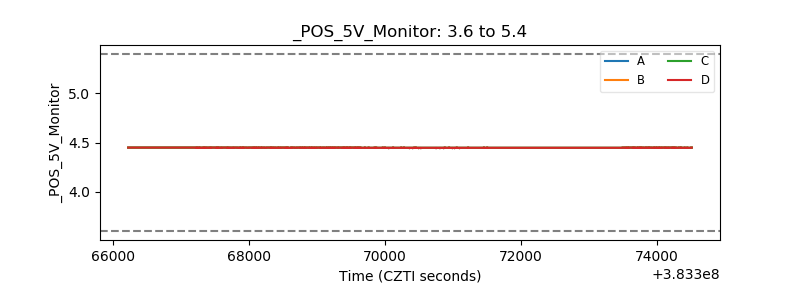 |
| _ROLL_ROT | 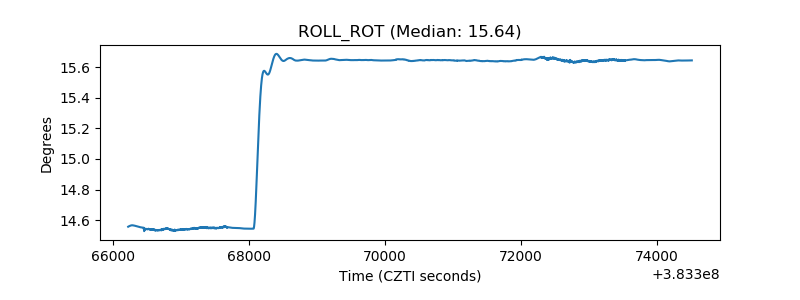 |
| _Roll_DEC | 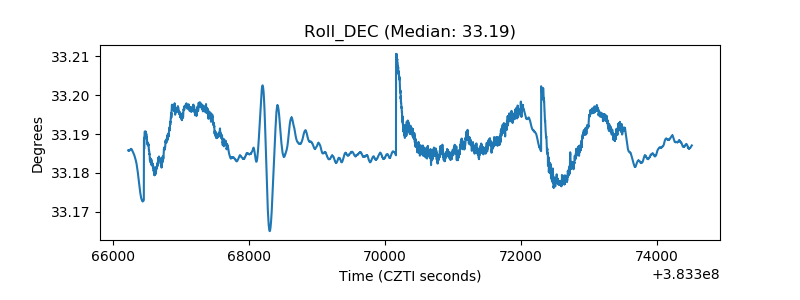 |
| _Roll_RA | 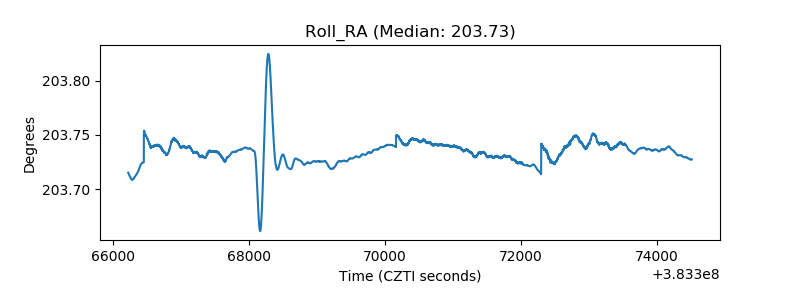 |
| Veto Counter | 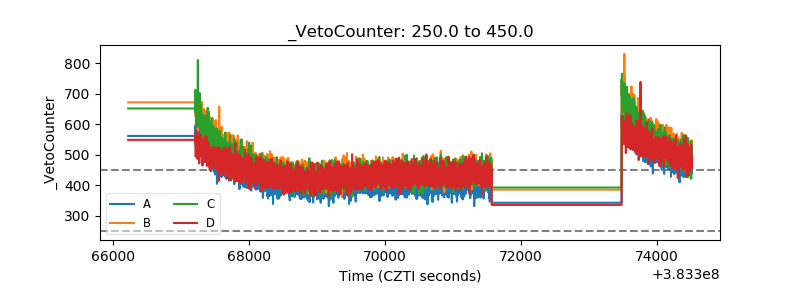 |