| Param | Original file | Final file |
|---|---|---|
| Filename | modeM0/AS1T05_008T01_9000004956_34645cztM0_level2.evt | modeM0/AS1T05_008T01_9000004956_34645cztM0_level2_quad_clean.evt |
| Size (bytes) | 563,054,400 | 94,855,680 |
| Size | 537.0 MB | 90.5 MB |
| Events in quadrant A | 3,027,503 | 615,234 |
| Events in quadrant B | 3,586,759 | 616,104 |
| Events in quadrant C | 3,400,580 | 611,961 |
| Events in quadrant D | 6,597,078 | 575,599 |
| Mode SS | |||
|---|---|---|---|
| Quadrant | BADHDUFLAG | Total packets | Discarded packets |
| A | 0 | 136 | 0 |
| B | 0 | 136 | 0 |
| C | 0 | 136 | 0 |
| D | 0 | 136 | 0 |
| Mode M9 | |||
|---|---|---|---|
| Quadrant | BADHDUFLAG | Total packets | Discarded packets |
| A | 0 | 26 | 0 |
| B | 0 | 26 | 0 |
| C | 0 | 26 | 0 |
| D | 0 | 26 | 0 |
| Mode M0 | |||
|---|---|---|---|
| Quadrant | BADHDUFLAG | Total packets | Discarded packets |
| A | 0 | 13311 | 3 |
| B | 0 | 14735 | 2 |
| C | 0 | 13894 | 2 |
| D | 0 | 24332 | 2 |
| Quadrant | Total seconds | Saturated seconds | Saturation percentage |
|---|---|---|---|
| A | 6499 | 14 | 0.215418% |
| B | 6499 | 87 | 1.338667% |
| C | 6499 | 67 | 1.030928% |
| D | 6499 | 223 | 3.431297% |
Noise dominated data is calculated using 1-second bins in cleaned event files. If a bin has >2000 counts, and if more than 50% of those come from <1% of pixels, then it is considered to be noise-dominated and hence unusable.
| Quadrant | # 1 sec bins | Bins with >0 counts | Bins with >2000 counts | High rate bins dominated by noise | Noise dominated (total time) | Noise dominated (detector-on time) | Marked lightcurve |
|---|---|---|---|---|---|---|---|
| A | 9154 | 6501 | 4 | 4 | 0.04% | 0.06% | 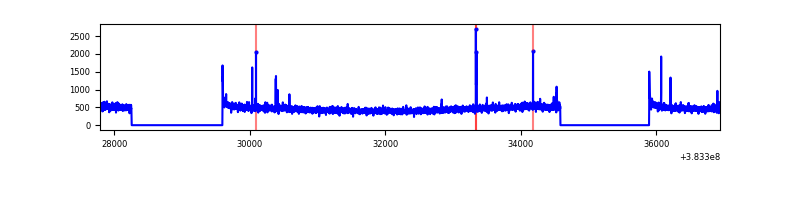 |
| B | 9154 | 6501 | 42 | 42 | 0.46% | 0.65% | 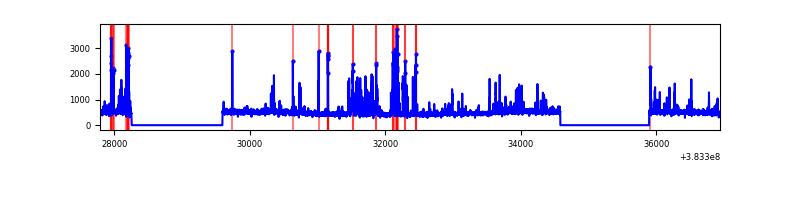 |
| C | 9154 | 6501 | 43 | 43 | 0.47% | 0.66% | 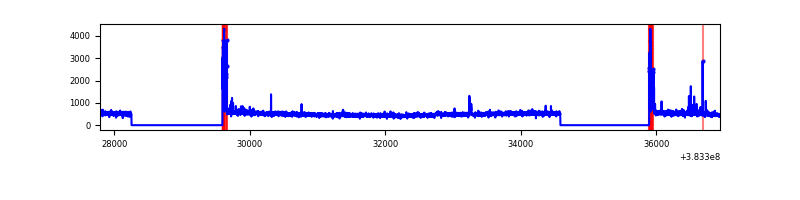 |
| D | 9154 | 6501 | 151 | 151 | 1.65% | 2.32% | 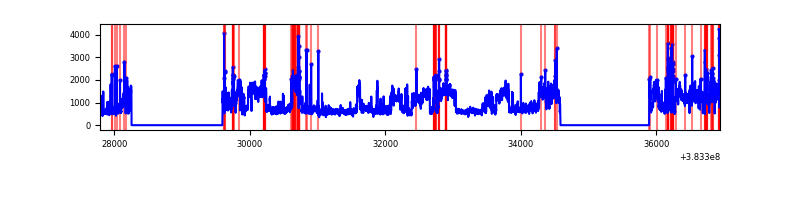 |
Top three noisy pixels from each quadrant. If the there are fewer than three noisy pixels in the level2.evt file, extra rows are filled as -1
| Pixel properties | Quadrant properties | ||||||
|---|---|---|---|---|---|---|---|
| Quadrant | DetID | PixID | Counts | Sigma | Mean | Median | Sigma |
| A | 10 | 83 | 51024 | 330.0 | 757 | 743 | 152.4 |
| A | 9 | 143 | 25520 | 162.62 | 757 | 743 | 152.4 |
| A | 13 | 6 | 13473 | 83.55 | 757 | 743 | 152.4 |
| B | 5 | 172 | 437394 | 3014.94 | 751 | 731 | 144.8 |
| B | 15 | 201 | 34420 | 232.61 | 751 | 731 | 144.8 |
| B | 0 | 190 | 32453 | 219.02 | 751 | 731 | 144.8 |
| C | 15 | 214 | 272414 | 1592.88 | 731 | 737 | 170.6 |
| C | 0 | 10 | 175128 | 1022.48 | 731 | 737 | 170.6 |
| C | 12 | 250 | 23143 | 131.37 | 731 | 737 | 170.6 |
| D | 8 | 195 | 3040237 | 15882.79 | 725 | 708 | 191.4 |
| D | 13 | 249 | 178620 | 929.66 | 725 | 708 | 191.4 |
| D | 2 | 250 | 117513 | 610.35 | 725 | 708 | 191.4 |
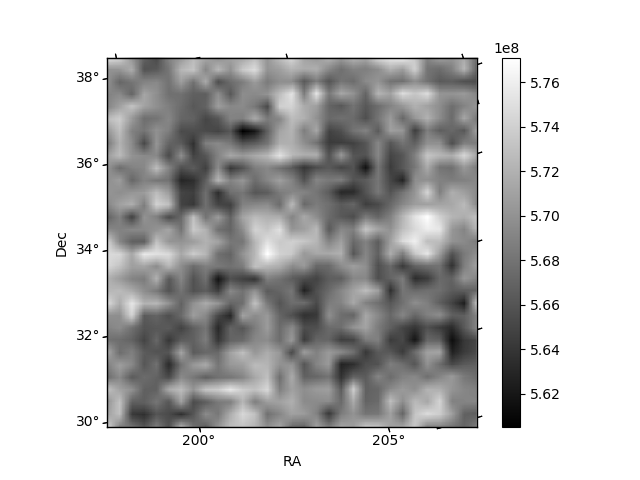
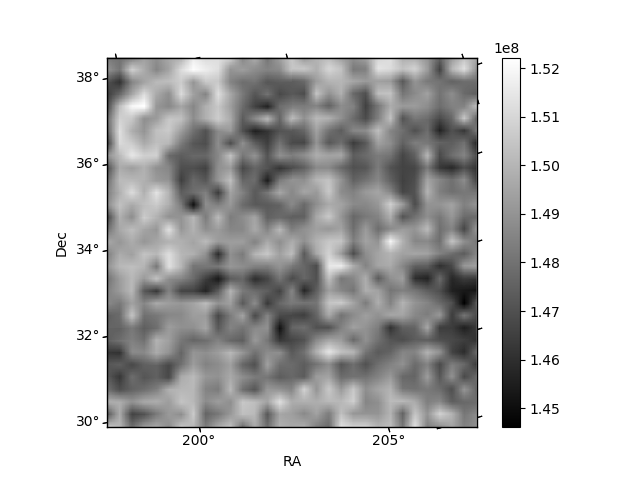
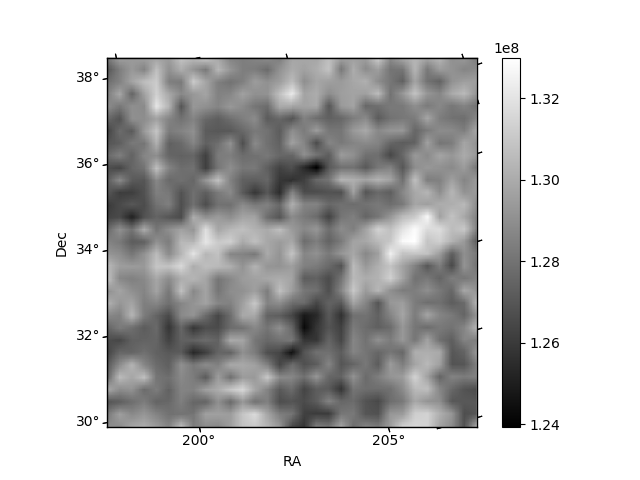
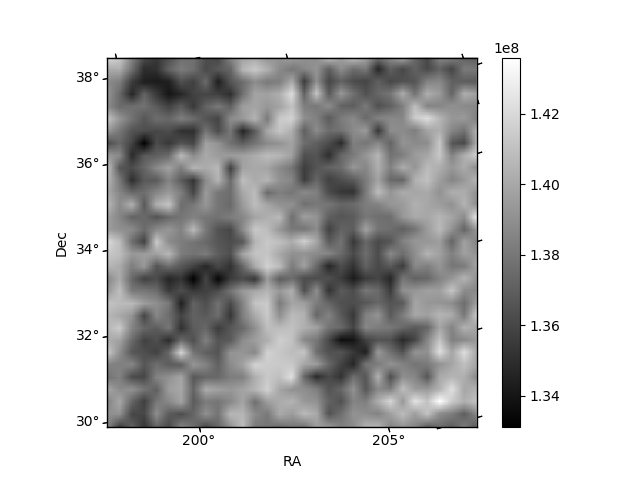
Histogram calculated using DETX and DETY for each event in the final _common_clean file
| Quadrant A | 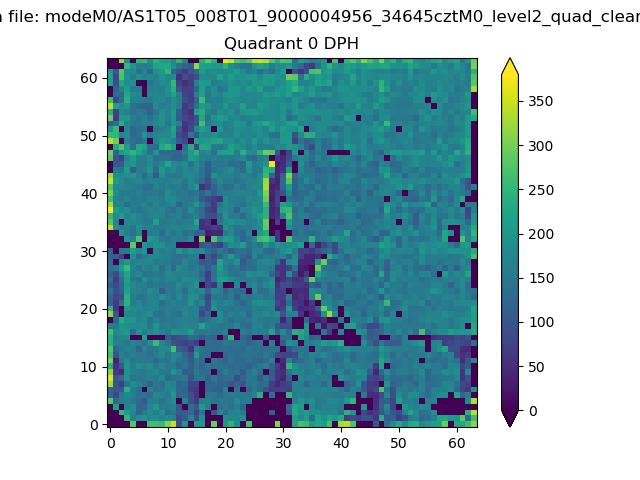 |
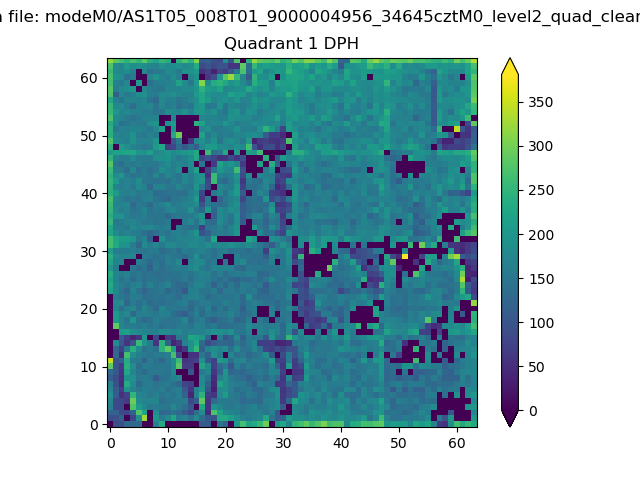 |
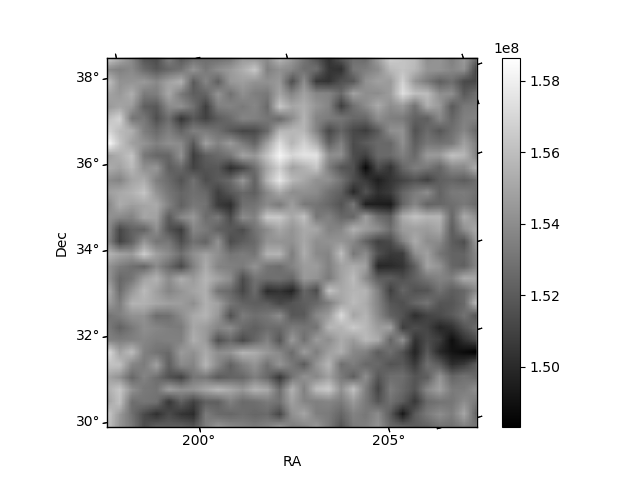
Quadrant B |
|---|---|---|---|
| Quadrant D | 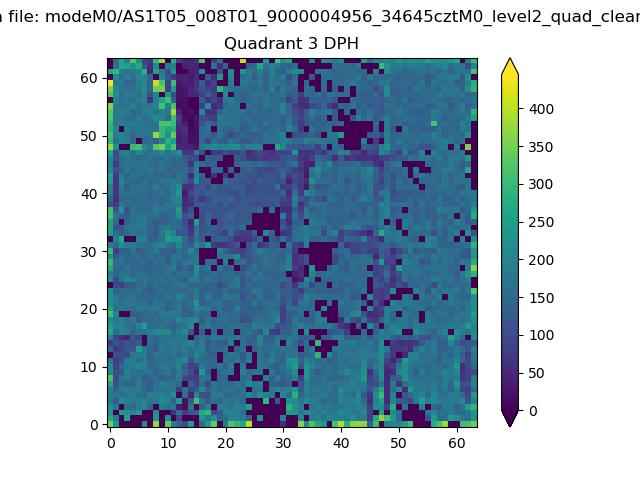 |
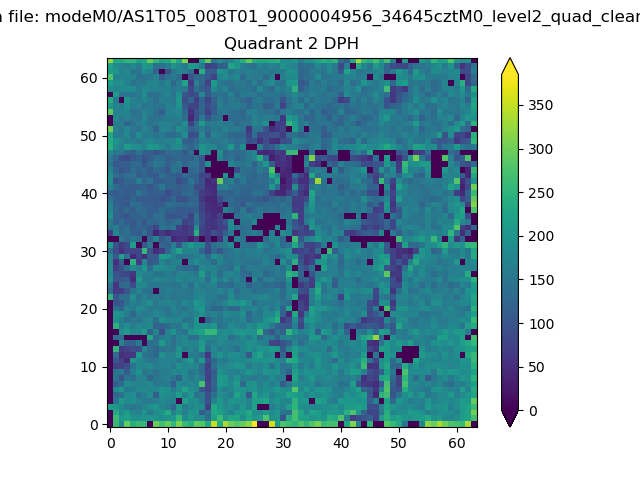 |
Quadrant C |
| Plot type | Count rate plots | Images |
|---|---|---|
| Comparison with Poisson distribution Blue bars denote a histogram of data divided into 1 sec bins. Red curve is a Poisson curve with rate = median count rate of data. |
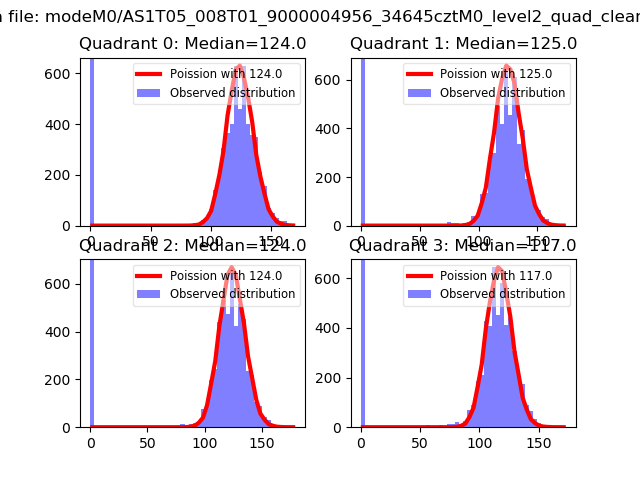 |
 |
| Quadrant-wise count rates Data is divided into 100 sec bins |
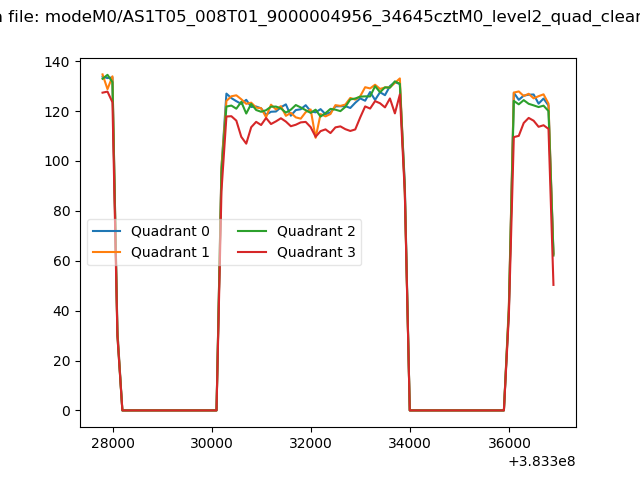 |
|
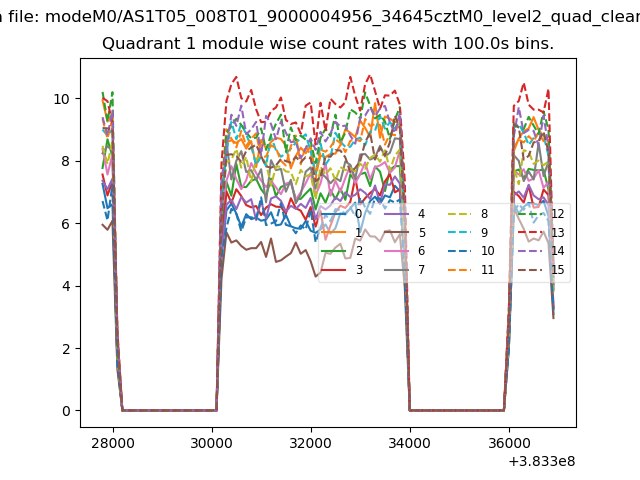
| Module-wise count rates for Quadrant A Data is divided into 100 sec bins |
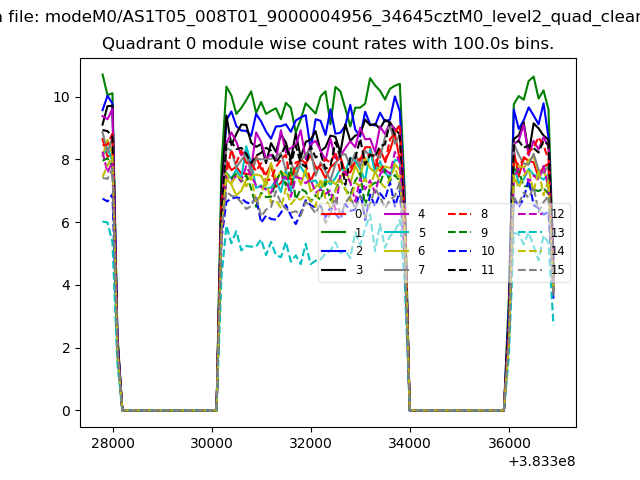 |
 |
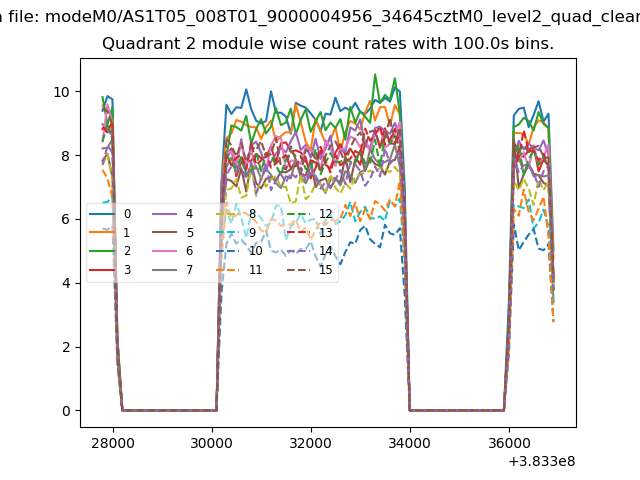
| Module-wise count rates for Quadrant B Data is divided into 100 sec bins |
 |
 |
| Module-wise count rates for Quadrant C Data is divided into 100 sec bins |
 |
 |
| Module-wise count rates for Quadrant D Data is divided into 100 sec bins |
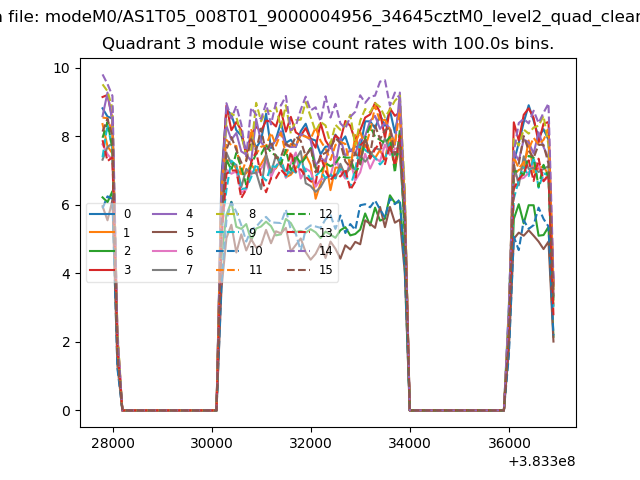 |
 |
| Parameter | Plot |
|---|---|
| CZT HV Monitor | 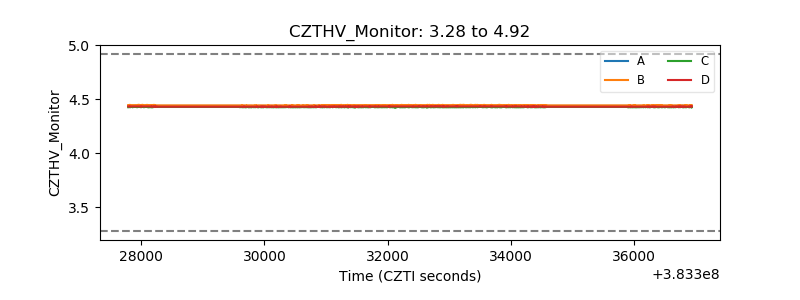 |
| D_VDD | 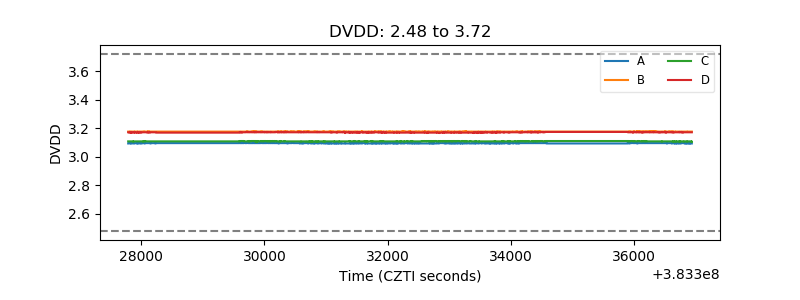 |
| Temperature 1 | 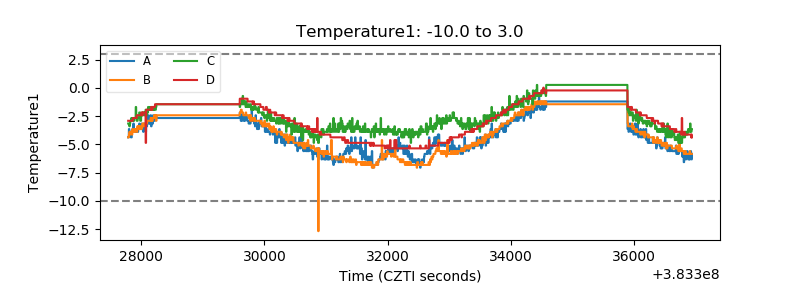 |
| Veto HV Monitor | 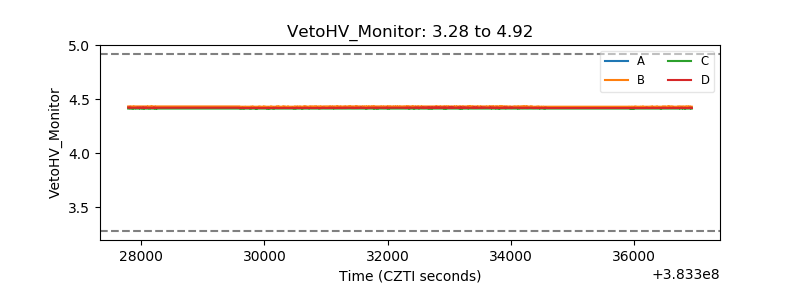 |
| Veto LLD | 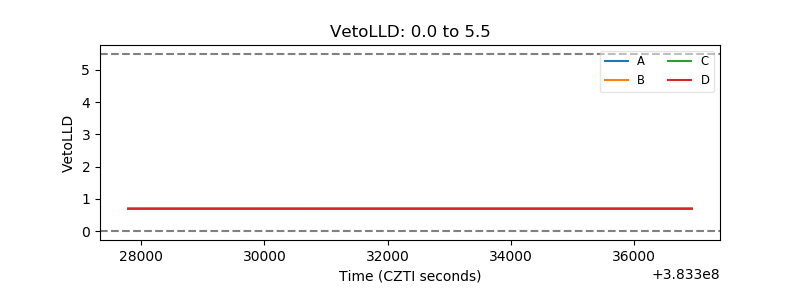 |
| Alpha Counter | 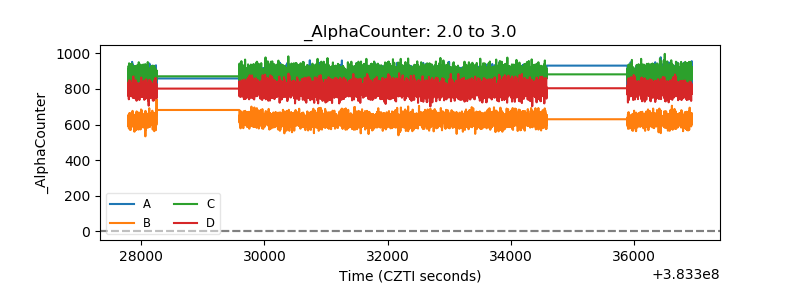 |
| _CPM_Rate | 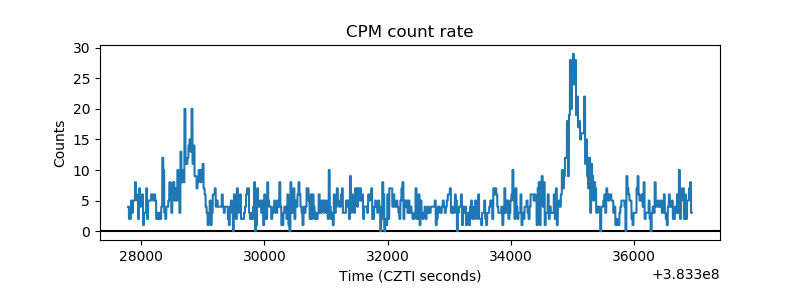 |
| CZT Counter | 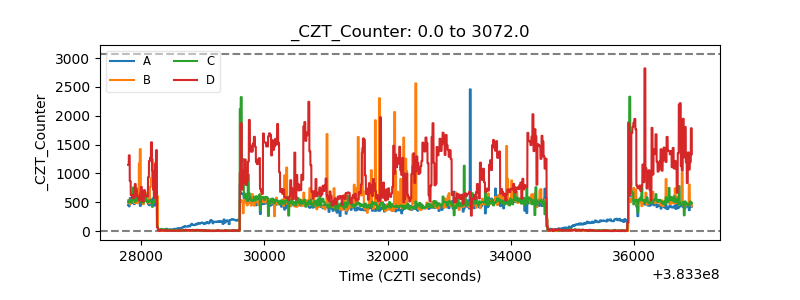 |
| +2.5 Volts monitor | 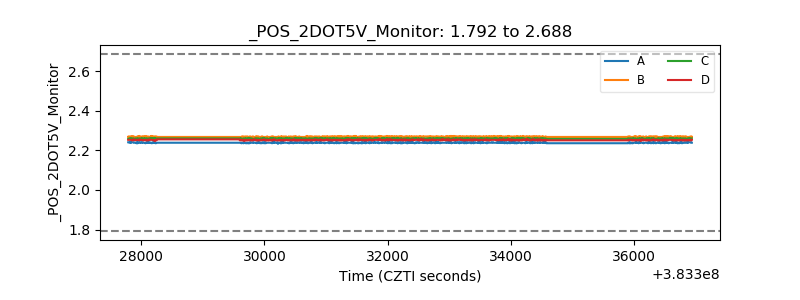 |
| +5 Volts monitor |  |
| _ROLL_ROT | 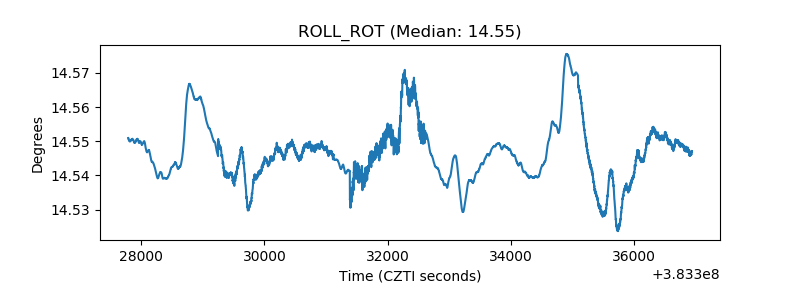 |
| _Roll_DEC | 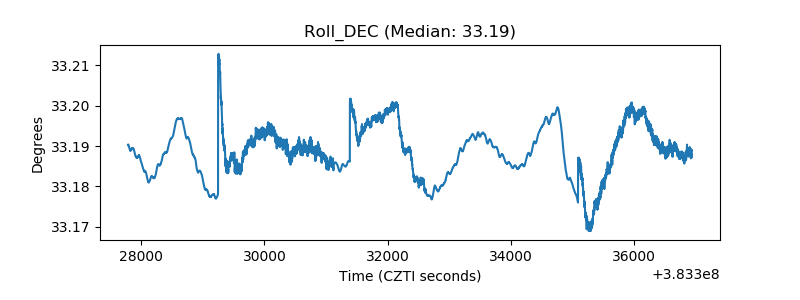 |
| _Roll_RA | 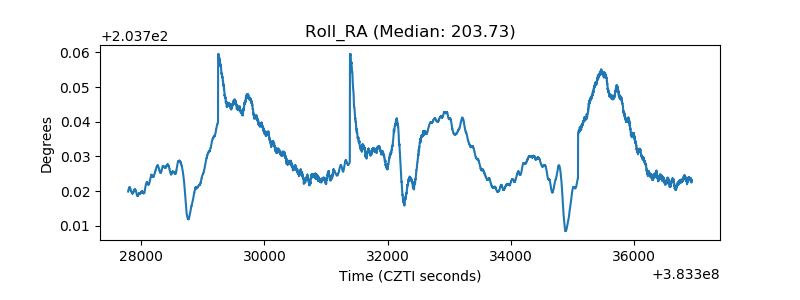 |
| Veto Counter | 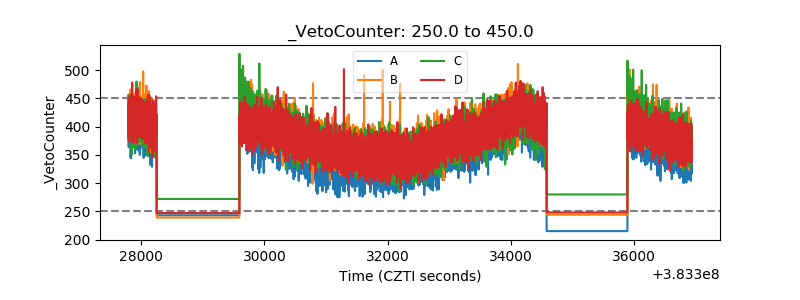 |