| Param | Original file | Final file |
|---|---|---|
| Filename | modeM0/AS1T05_008T01_9000004956_34641cztM0_level2.evt | modeM0/AS1T05_008T01_9000004956_34641cztM0_level2_quad_clean.evt |
| Size (bytes) | 453,608,640 | 48,386,880 |
| Size | 432.6 MB | 46.1 MB |
| Events in quadrant A | 2,524,915 | 287,092 |
| Events in quadrant B | 3,275,217 | 276,883 |
| Events in quadrant C | 2,820,288 | 278,175 |
| Events in quadrant D | 4,775,724 | 269,447 |
| Mode SS | |||
|---|---|---|---|
| Quadrant | BADHDUFLAG | Total packets | Discarded packets |
| A | 0 | 102 | 0 |
| B | 0 | 102 | 0 |
| C | 0 | 102 | 0 |
| D | 0 | 102 | 0 |
| Mode M9 | |||
|---|---|---|---|
| Quadrant | BADHDUFLAG | Total packets | Discarded packets |
| A | 0 | 24 | 0 |
| B | 0 | 24 | 0 |
| C | 0 | 24 | 0 |
| D | 0 | 25 | 0 |
| Mode M0 | |||
|---|---|---|---|
| Quadrant | BADHDUFLAG | Total packets | Discarded packets |
| A | 0 | 10402 | 3 |
| B | 0 | 12649 | 2 |
| C | 0 | 11054 | 2 |
| D | 0 | 17663 | 2 |
| Quadrant | Total seconds | Saturated seconds | Saturation percentage |
|---|---|---|---|
| A | 5038 | 17 | 0.337435% |
| B | 5038 | 275 | 5.458515% |
| C | 5038 | 68 | 1.349742% |
| D | 5038 | 158 | 3.136165% |
Noise dominated data is calculated using 1-second bins in cleaned event files. If a bin has >2000 counts, and if more than 50% of those come from <1% of pixels, then it is considered to be noise-dominated and hence unusable.
| Quadrant | # 1 sec bins | Bins with >0 counts | Bins with >2000 counts | High rate bins dominated by noise | Noise dominated (total time) | Noise dominated (detector-on time) | Marked lightcurve |
|---|---|---|---|---|---|---|---|
| A | 7162 | 5039 | 5 | 5 | 0.07% | 0.10% | 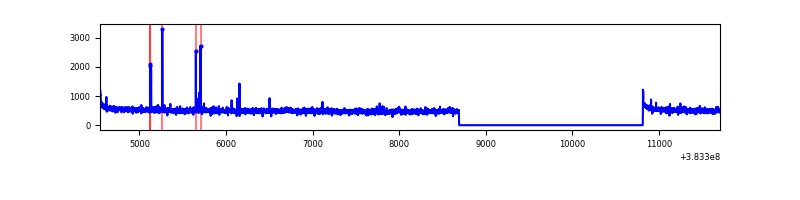 |
| B | 7162 | 5039 | 196 | 196 | 2.74% | 3.89% | 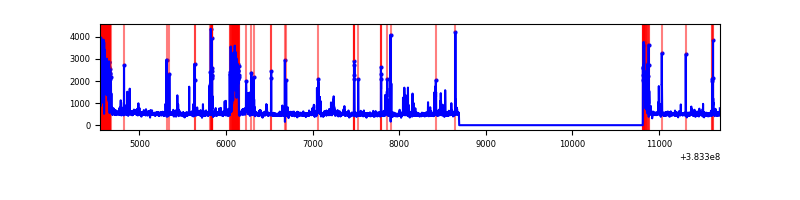 |
| C | 7162 | 5039 | 42 | 42 | 0.59% | 0.83% | 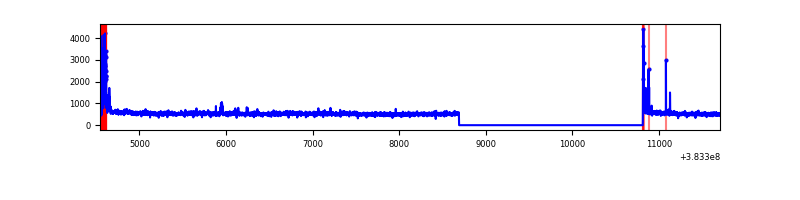 |
| D | 7162 | 5039 | 117 | 117 | 1.63% | 2.32% | 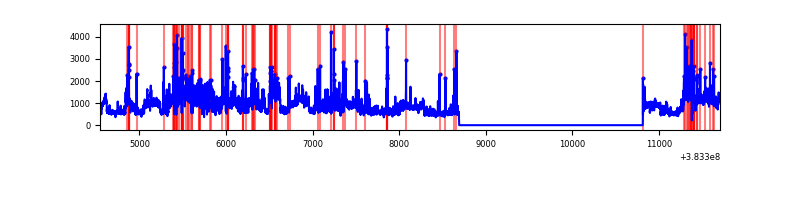 |
Top three noisy pixels from each quadrant. If the there are fewer than three noisy pixels in the level2.evt file, extra rows are filled as -1
| Pixel properties | Quadrant properties | ||||||
|---|---|---|---|---|---|---|---|
| Quadrant | DetID | PixID | Counts | Sigma | Mean | Median | Sigma |
| A | 10 | 83 | 45969 | 361.87 | 629 | 617 | 125.3 |
| A | 9 | 143 | 16866 | 129.65 | 629 | 617 | 125.3 |
| A | 15 | 174 | 15334 | 117.43 | 629 | 617 | 125.3 |
| B | 5 | 172 | 600985 | 5245.37 | 604 | 591 | 114.5 |
| B | 3 | 112 | 143441 | 1248.02 | 604 | 591 | 114.5 |
| B | 4 | 232 | 36691 | 315.39 | 604 | 591 | 114.5 |
| C | 15 | 214 | 214283 | 1546.96 | 600 | 604 | 138.1 |
| C | 0 | 10 | 182699 | 1318.3 | 600 | 604 | 138.1 |
| C | 14 | 67 | 32663 | 232.1 | 600 | 604 | 138.1 |
| D | 8 | 195 | 1422676 | 8668.63 | 599 | 587 | 164.1 |
| D | 7 | 38 | 128241 | 778.14 | 599 | 587 | 164.1 |
| D | 10 | 199 | 116228 | 704.91 | 599 | 587 | 164.1 |
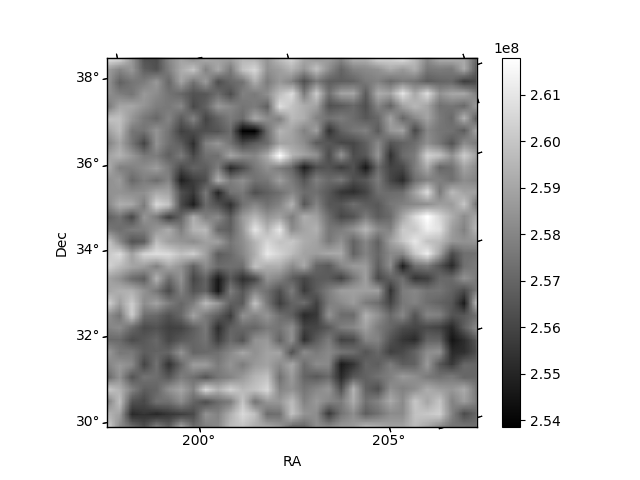
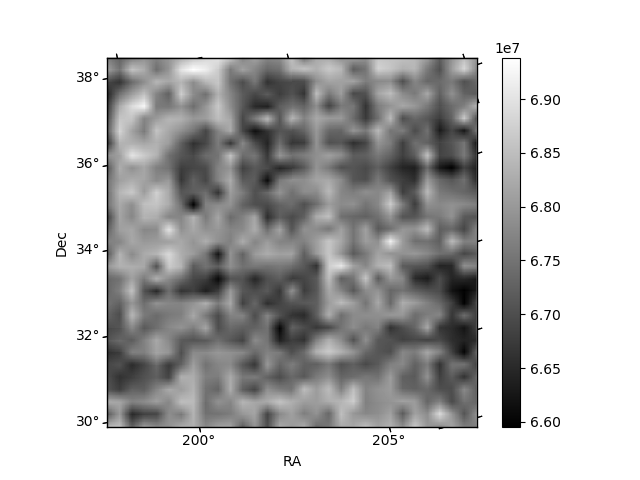
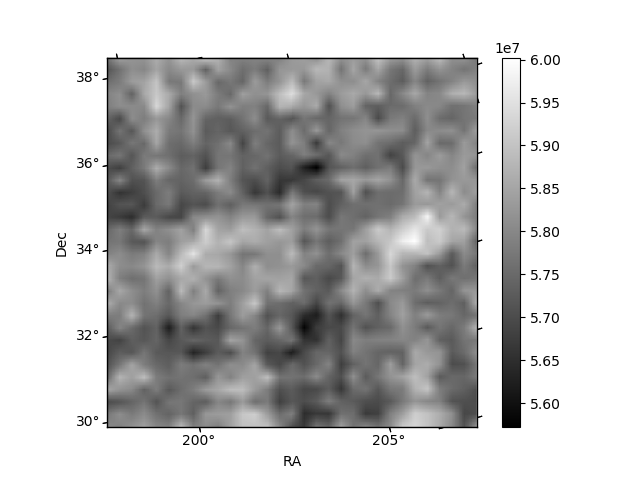
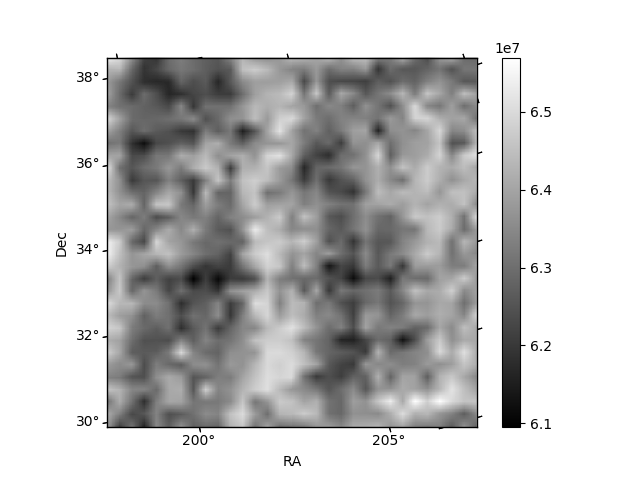
Histogram calculated using DETX and DETY for each event in the final _common_clean file
| Quadrant A | 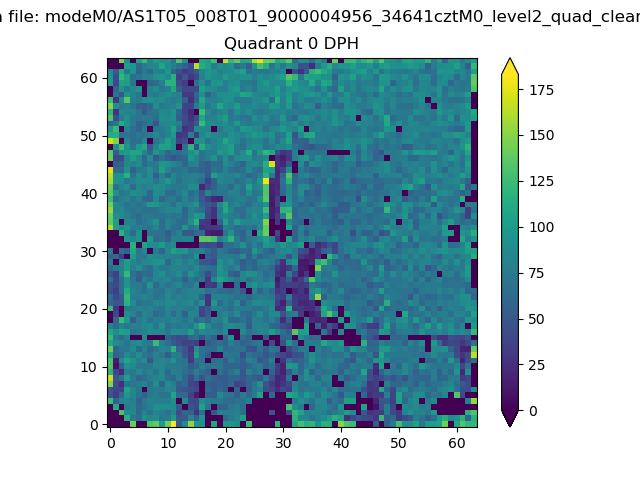 |
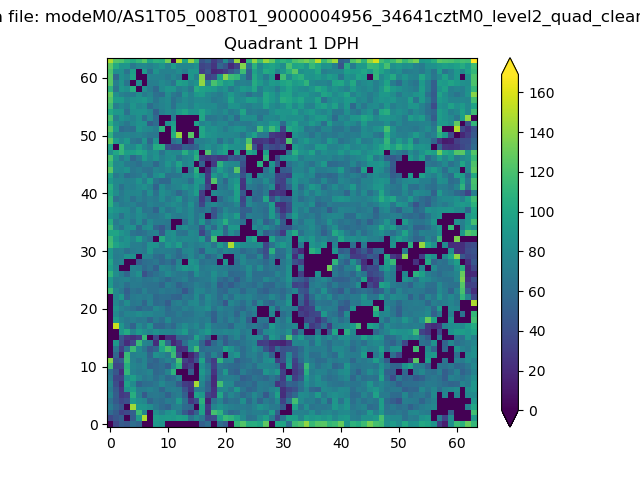 |
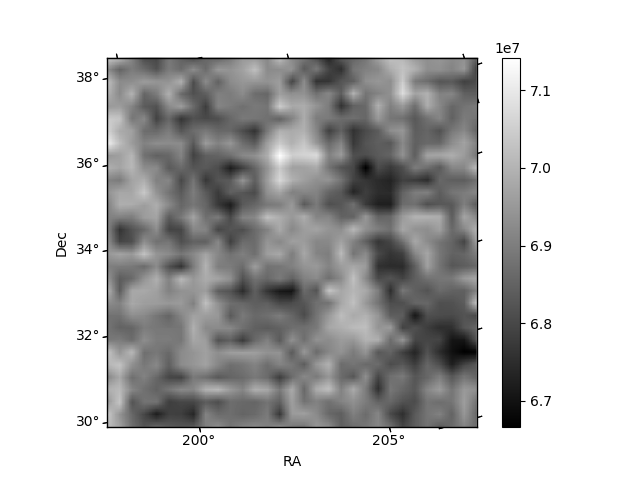
Quadrant B |
|---|---|---|---|
| Quadrant D | 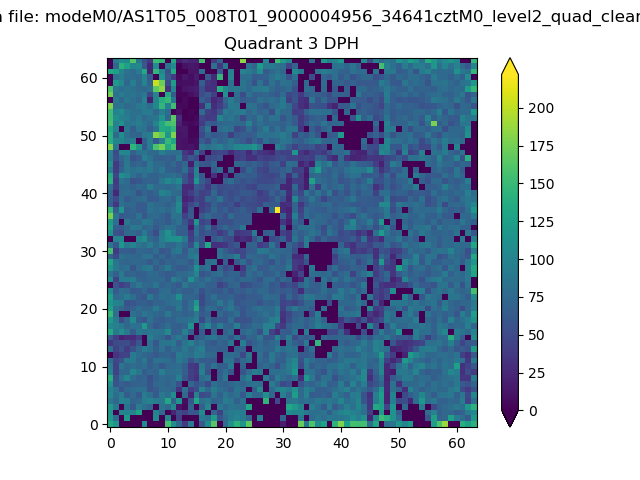 |
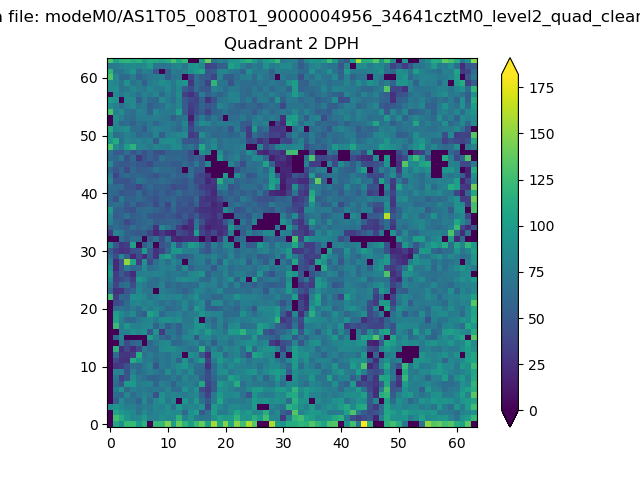 |
Quadrant C |
| Plot type | Count rate plots | Images |
|---|---|---|
| Comparison with Poisson distribution Blue bars denote a histogram of data divided into 1 sec bins. Red curve is a Poisson curve with rate = median count rate of data. |
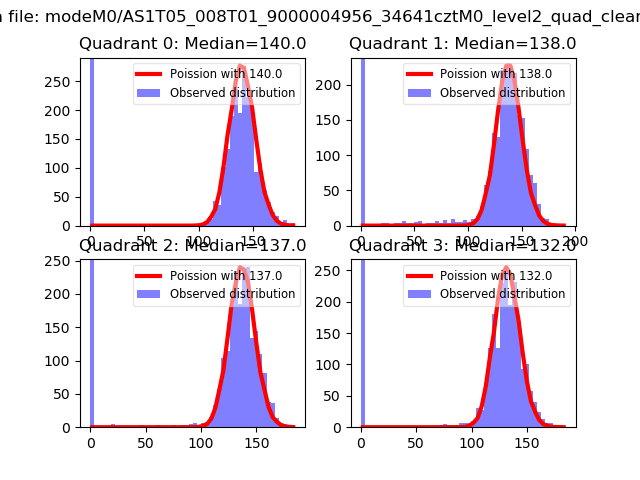 |
 |
| Quadrant-wise count rates Data is divided into 100 sec bins |
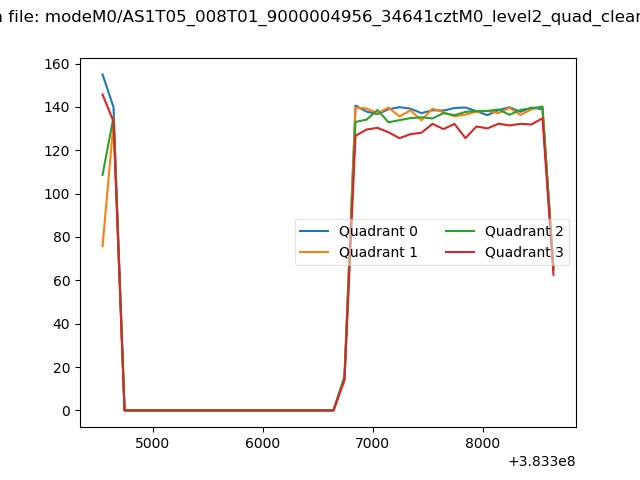 |
|
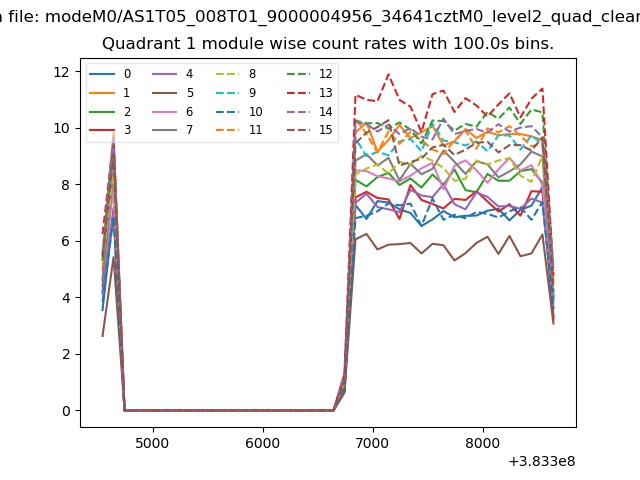
| Module-wise count rates for Quadrant A Data is divided into 100 sec bins |
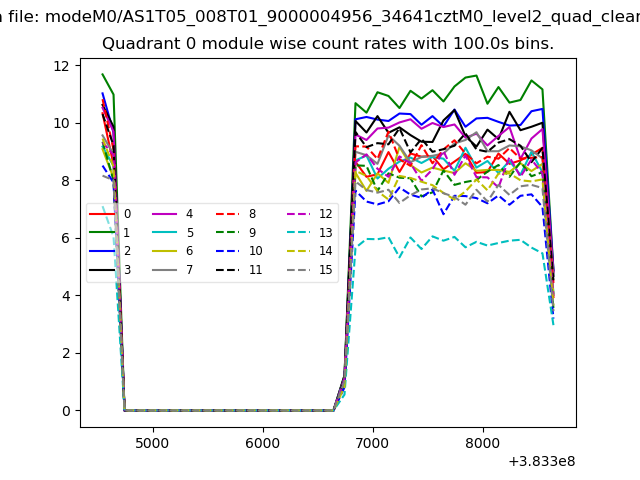 |
 |
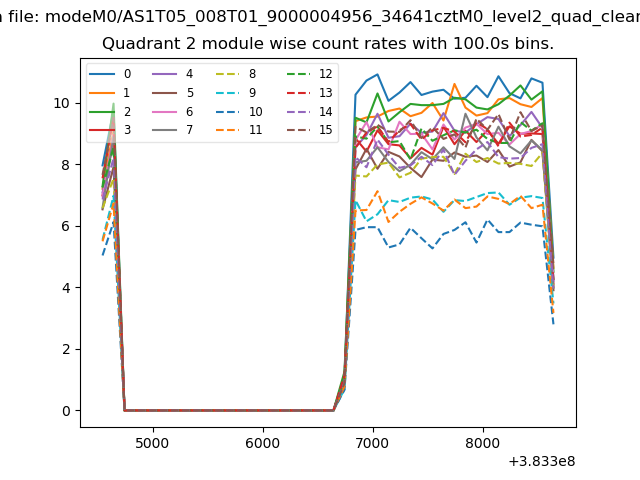
| Module-wise count rates for Quadrant B Data is divided into 100 sec bins |
 |
 |
| Module-wise count rates for Quadrant C Data is divided into 100 sec bins |
 |
 |
| Module-wise count rates for Quadrant D Data is divided into 100 sec bins |
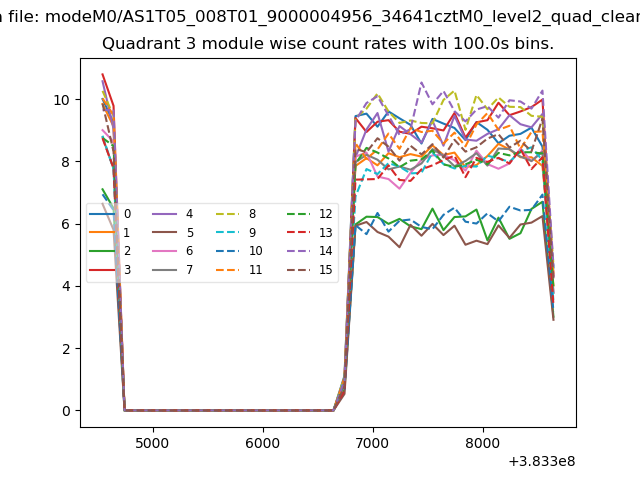 |
 |
| Parameter | Plot |
|---|---|
| CZT HV Monitor | 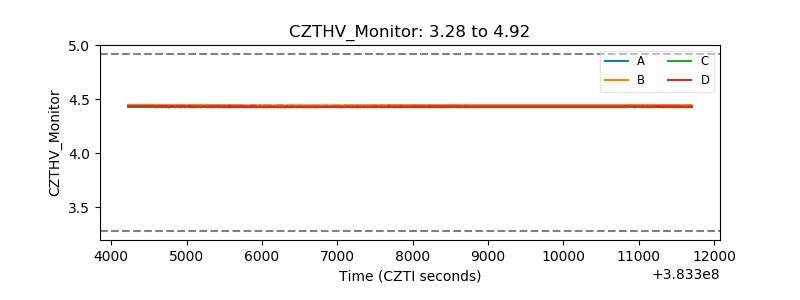 |
| D_VDD | 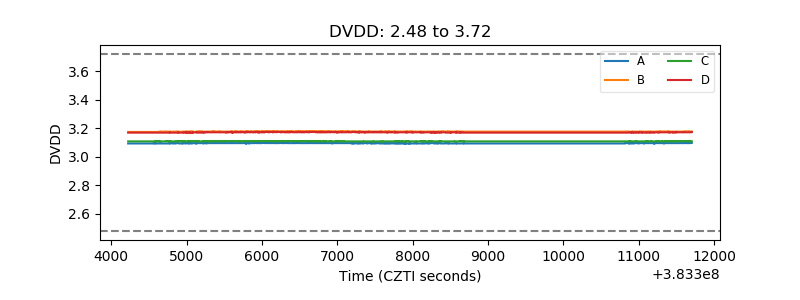 |
| Temperature 1 | 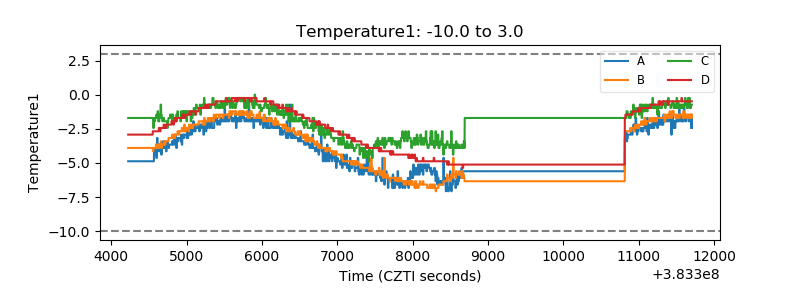 |
| Veto HV Monitor |  |
| Veto LLD | 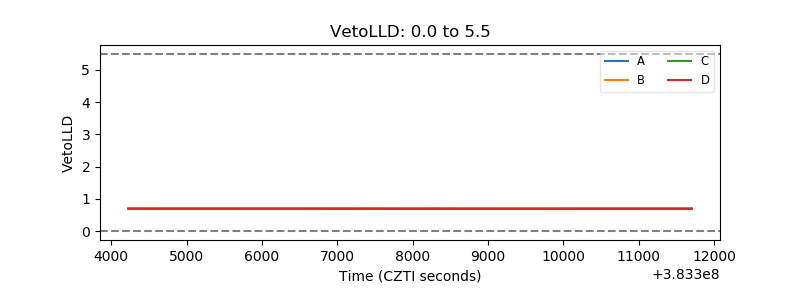 |
| Alpha Counter | 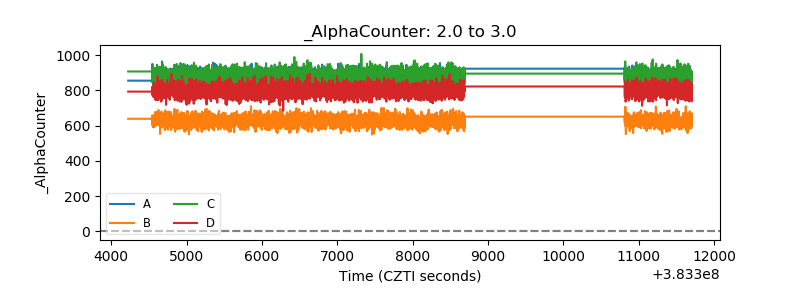 |
| _CPM_Rate | 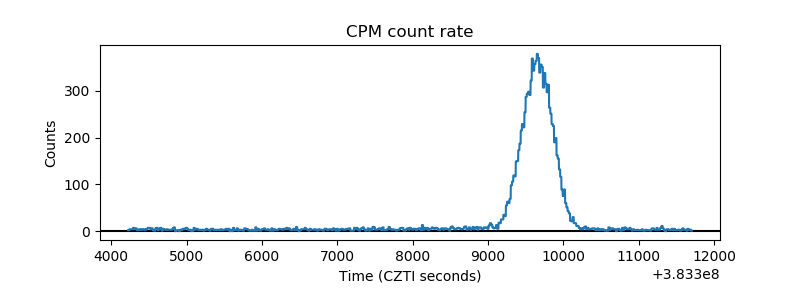 |
| CZT Counter | 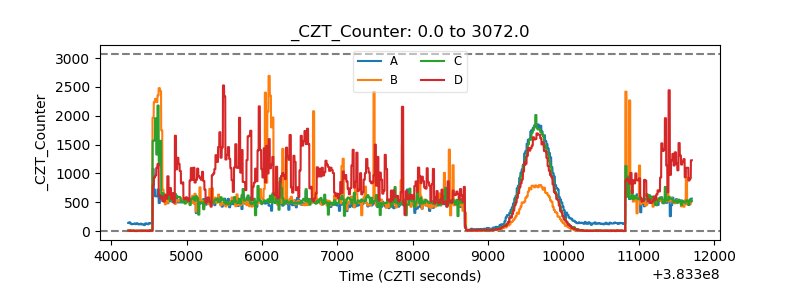 |
| +2.5 Volts monitor | 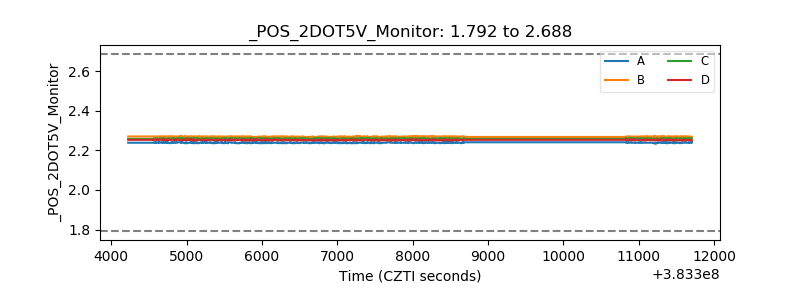 |
| +5 Volts monitor | 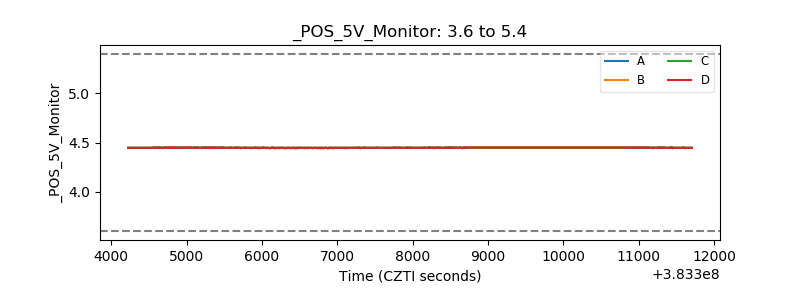 |
| _ROLL_ROT | 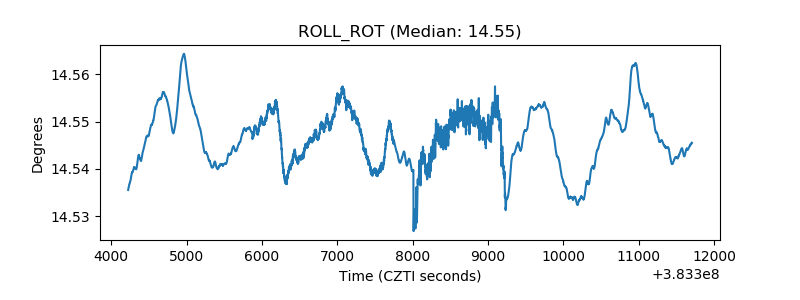 |
| _Roll_DEC | 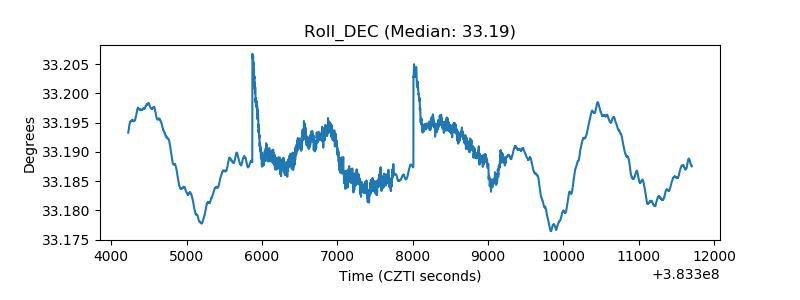 |
| _Roll_RA | 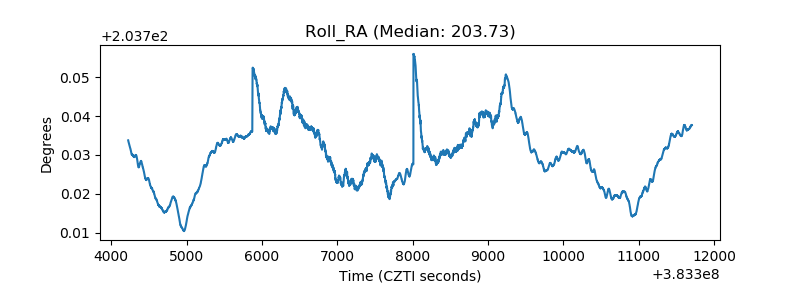 |
| Veto Counter | 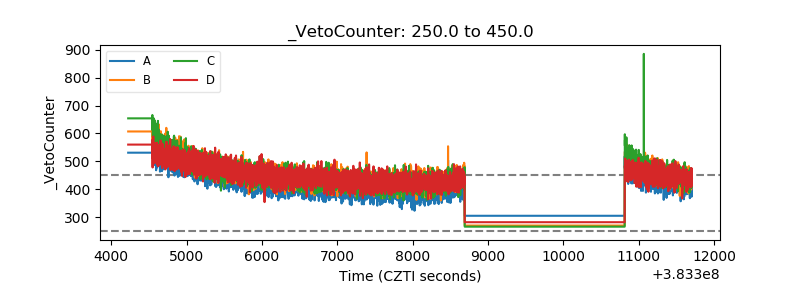 |