| Param | Original file | Final file |
|---|---|---|
| Filename | modeM0/AS1T05_008T01_9000004956_34630cztM0_level2.evt | modeM0/AS1T05_008T01_9000004956_34630cztM0_level2_quad_clean.evt |
| Size (bytes) | 495,325,440 | 83,678,400 |
| Size | 472.4 MB | 79.8 MB |
| Events in quadrant A | 2,710,533 | 542,238 |
| Events in quadrant B | 3,944,762 | 533,488 |
| Events in quadrant C | 3,096,282 | 541,160 |
| Events in quadrant D | 4,853,547 | 509,104 |
| Mode SS | |||
|---|---|---|---|
| Quadrant | BADHDUFLAG | Total packets | Discarded packets |
| A | 0 | 118 | 0 |
| B | 0 | 118 | 0 |
| C | 0 | 118 | 0 |
| D | 0 | 118 | 0 |
| Mode M9 | |||
|---|---|---|---|
| Quadrant | BADHDUFLAG | Total packets | Discarded packets |
| A | 0 | 19 | 0 |
| B | 0 | 19 | 0 |
| C | 0 | 19 | 0 |
| D | 0 | 20 | 0 |
| Mode M0 | |||
|---|---|---|---|
| Quadrant | BADHDUFLAG | Total packets | Discarded packets |
| A | 0 | 11933 | 3 |
| B | 0 | 15511 | 2 |
| C | 0 | 12661 | 2 |
| D | 0 | 18384 | 2 |
| Quadrant | Total seconds | Saturated seconds | Saturation percentage |
|---|---|---|---|
| A | 5838 | 4 | 0.068517% |
| B | 5838 | 336 | 5.755396% |
| C | 5838 | 63 | 1.079137% |
| D | 5838 | 242 | 4.145255% |
Noise dominated data is calculated using 1-second bins in cleaned event files. If a bin has >2000 counts, and if more than 50% of those come from <1% of pixels, then it is considered to be noise-dominated and hence unusable.
| Quadrant | # 1 sec bins | Bins with >0 counts | Bins with >2000 counts | High rate bins dominated by noise | Noise dominated (total time) | Noise dominated (detector-on time) | Marked lightcurve |
|---|---|---|---|---|---|---|---|
| A | 7150 | 5839 | 0 | 0 | 0.00% | 0.00% | 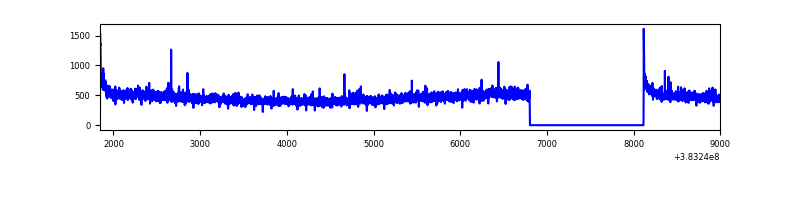 |
| B | 7150 | 5839 | 193 | 193 | 2.70% | 3.31% | 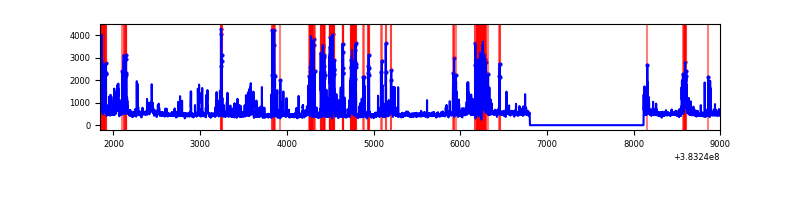 |
| C | 7150 | 5839 | 37 | 37 | 0.52% | 0.63% | 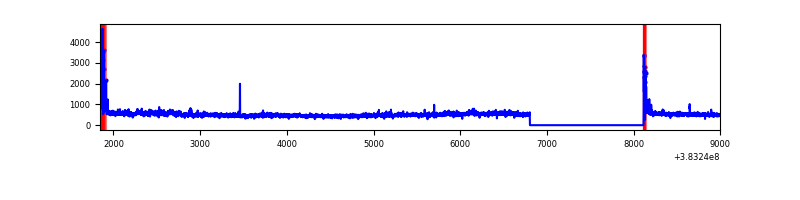 |
| D | 7150 | 5839 | 170 | 170 | 2.38% | 2.91% | 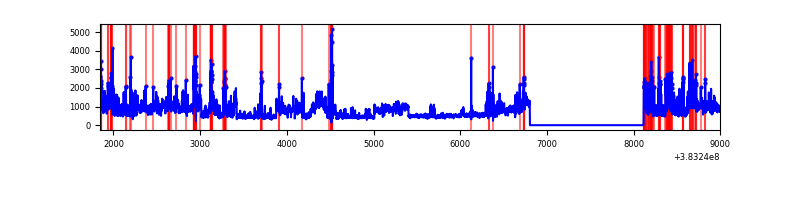 |
Top three noisy pixels from each quadrant. If the there are fewer than three noisy pixels in the level2.evt file, extra rows are filled as -1
| Pixel properties | Quadrant properties | ||||||
|---|---|---|---|---|---|---|---|
| Quadrant | DetID | PixID | Counts | Sigma | Mean | Median | Sigma |
| A | 10 | 83 | 49329 | 354.26 | 678 | 665 | 137.4 |
| A | 13 | 6 | 19242 | 135.23 | 678 | 665 | 137.4 |
| A | 13 | 254 | 11201 | 76.7 | 678 | 665 | 137.4 |
| B | 5 | 172 | 908618 | 7061.39 | 663 | 646 | 128.6 |
| B | 4 | 171 | 151122 | 1170.27 | 663 | 646 | 128.6 |
| B | 4 | 232 | 132551 | 1025.84 | 663 | 646 | 128.6 |
| C | 15 | 214 | 242710 | 1568.21 | 655 | 660 | 154.3 |
| C | 0 | 10 | 154913 | 999.39 | 655 | 660 | 154.3 |
| C | 14 | 67 | 113696 | 732.35 | 655 | 660 | 154.3 |
| D | 8 | 195 | 1340369 | 7724.82 | 644 | 629 | 173.4 |
| D | 13 | 249 | 191034 | 1097.86 | 644 | 629 | 173.4 |
| D | 7 | 223 | 135514 | 777.74 | 644 | 629 | 173.4 |
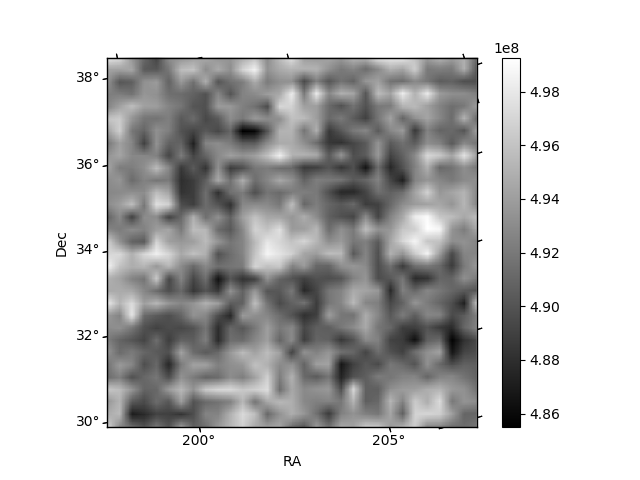
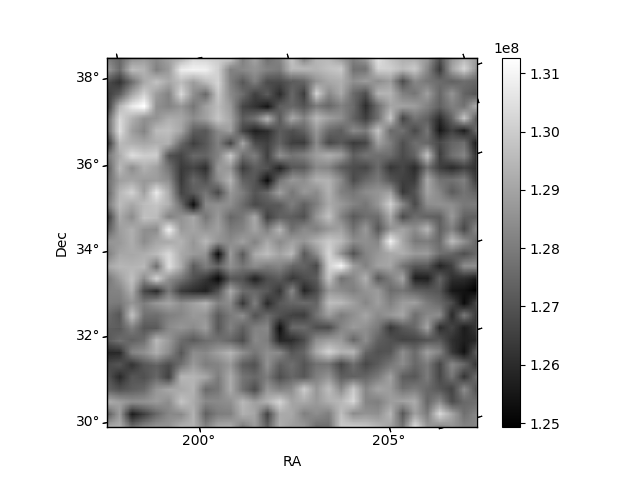
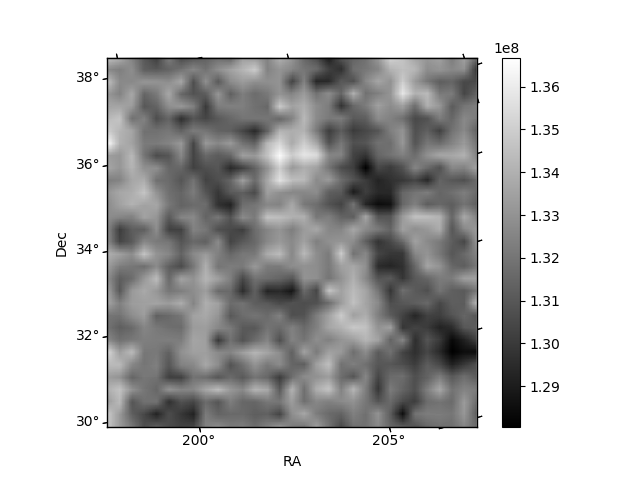
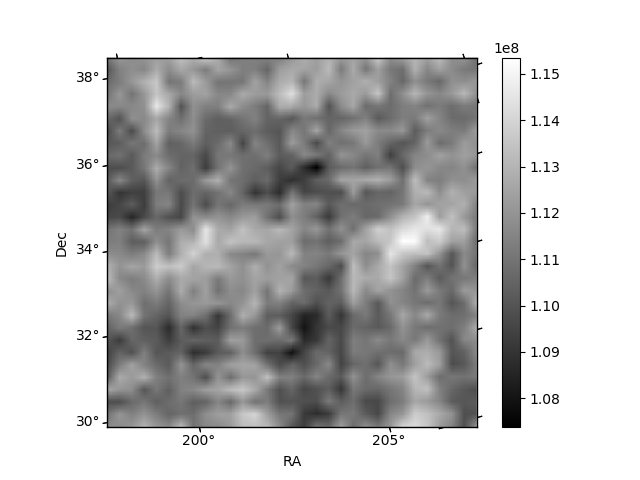
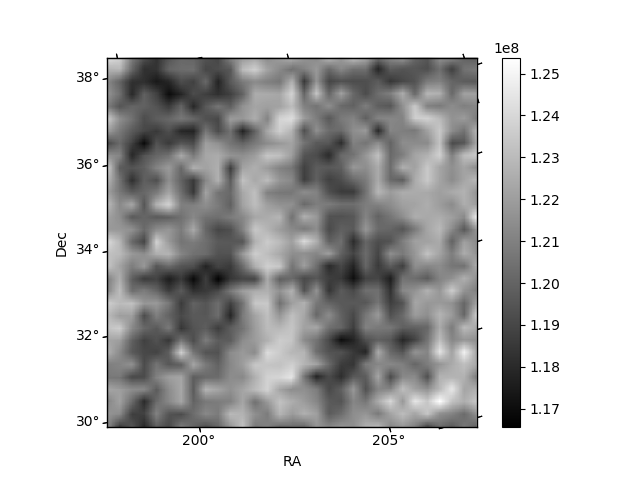
Histogram calculated using DETX and DETY for each event in the final _common_clean file
| Quadrant A | 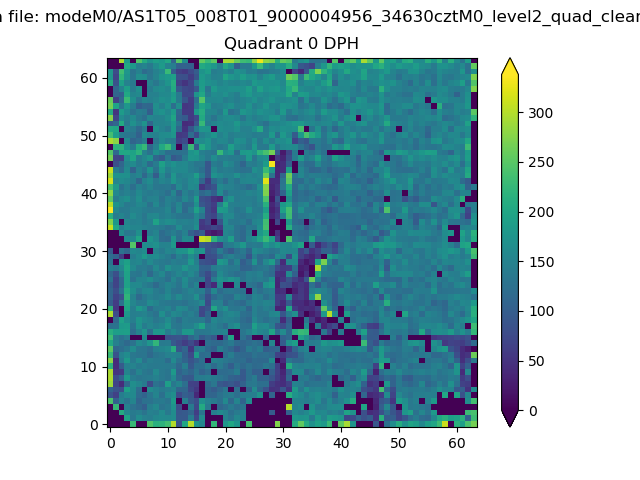 |
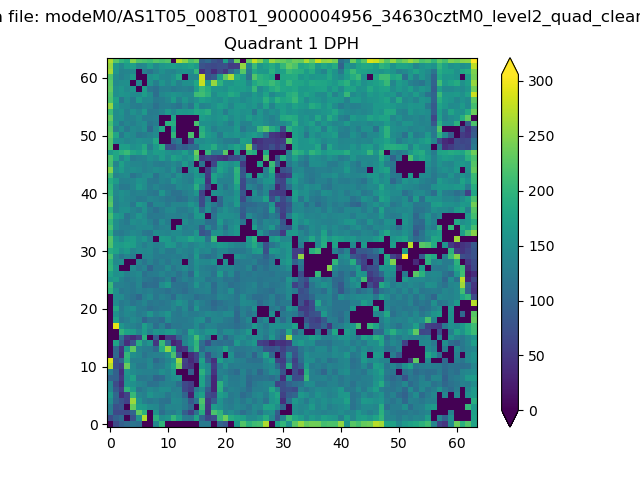 |
Quadrant B |
|---|---|---|---|
| Quadrant D | 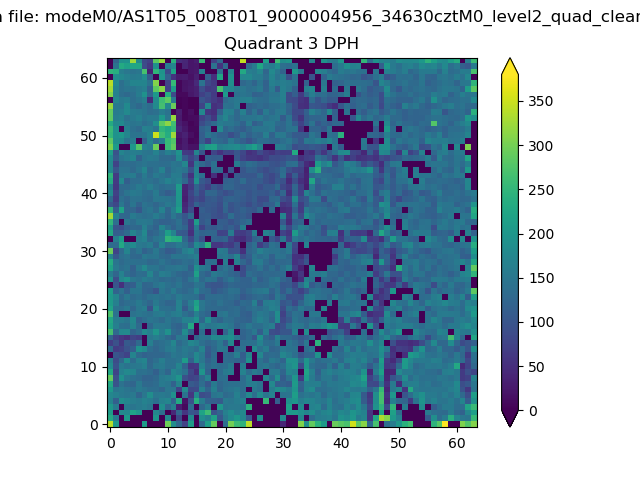 |
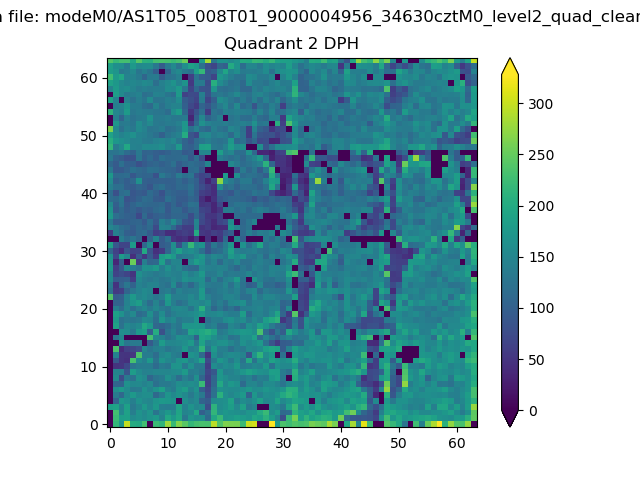 |
Quadrant C |
| Plot type | Count rate plots | Images |
|---|---|---|
| Comparison with Poisson distribution Blue bars denote a histogram of data divided into 1 sec bins. Red curve is a Poisson curve with rate = median count rate of data. |
 |
 |
| Quadrant-wise count rates Data is divided into 100 sec bins |
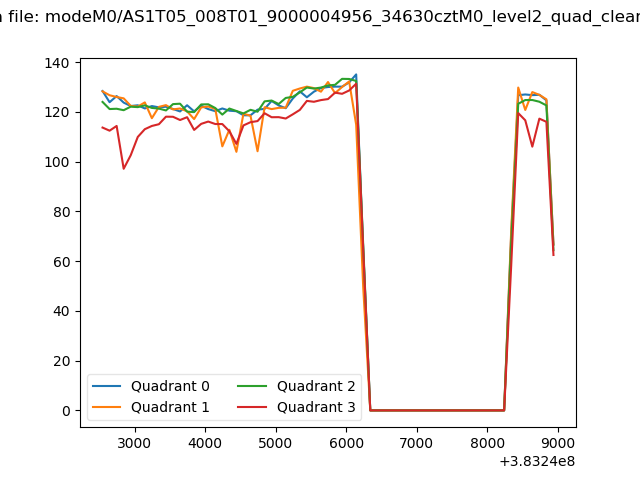 |
|
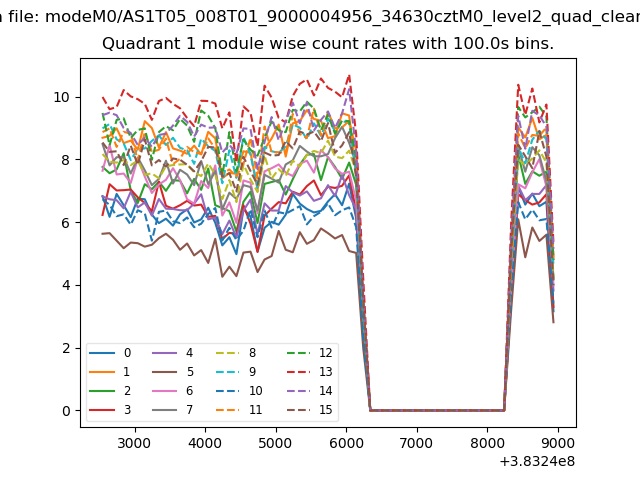
| Module-wise count rates for Quadrant A Data is divided into 100 sec bins |
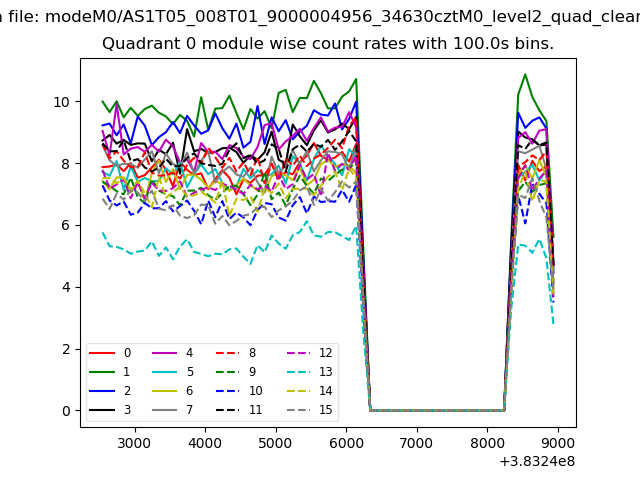 |
 |
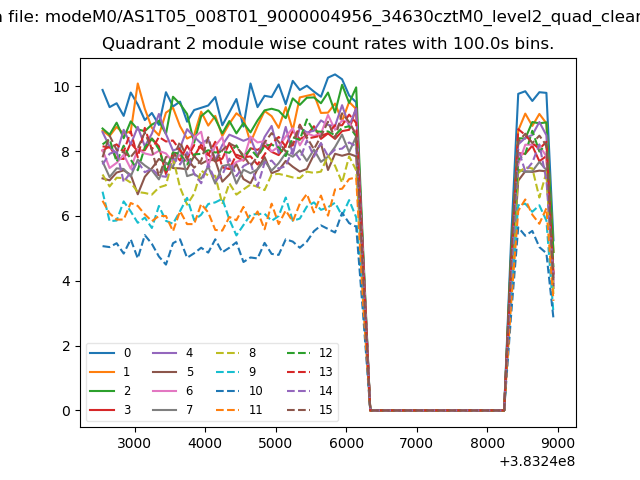
| Module-wise count rates for Quadrant B Data is divided into 100 sec bins |
 |
 |
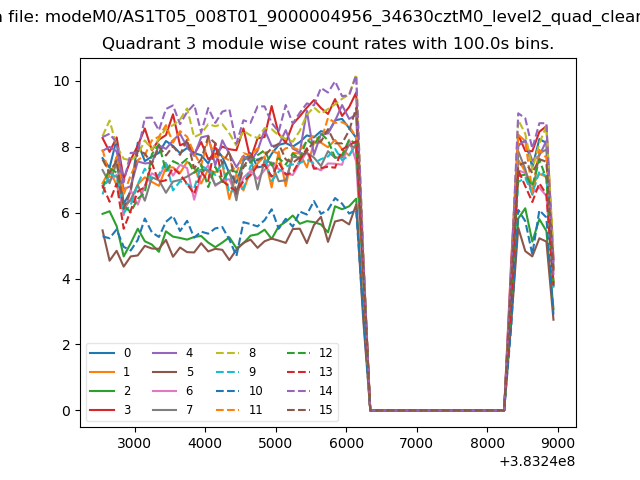
| Module-wise count rates for Quadrant C Data is divided into 100 sec bins |
 |
 |
| Module-wise count rates for Quadrant D Data is divided into 100 sec bins |
 |
 |
| Parameter | Plot |
|---|---|
| CZT HV Monitor | 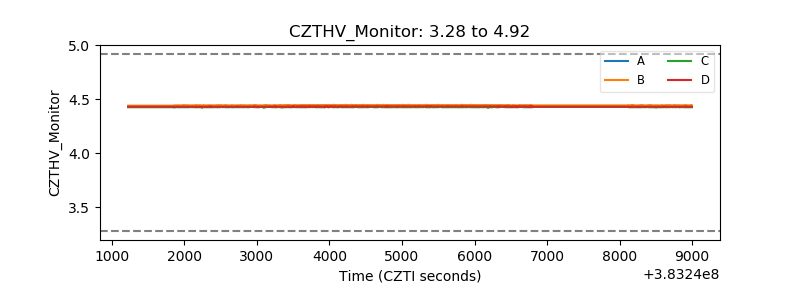 |
| D_VDD | 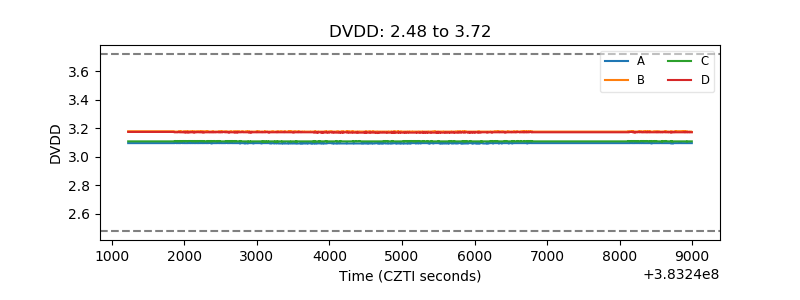 |
| Temperature 1 | 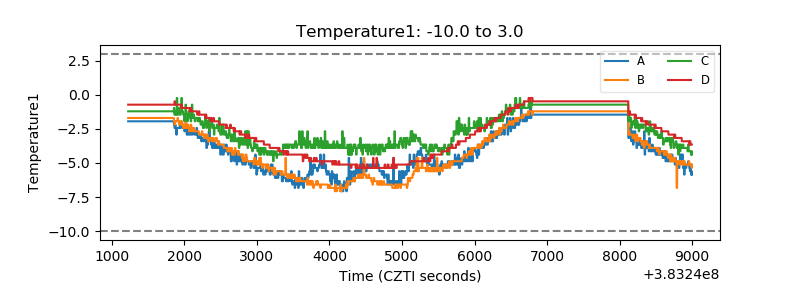 |
| Veto HV Monitor | 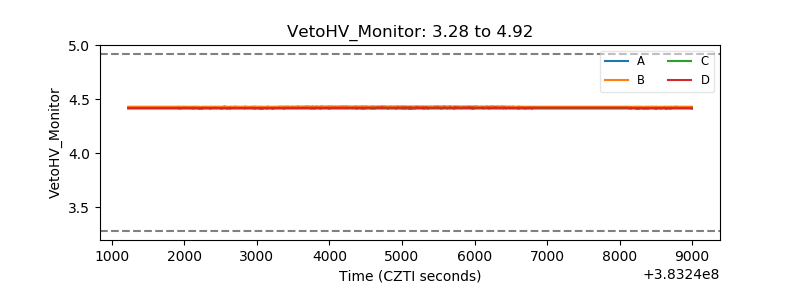 |
| Veto LLD | 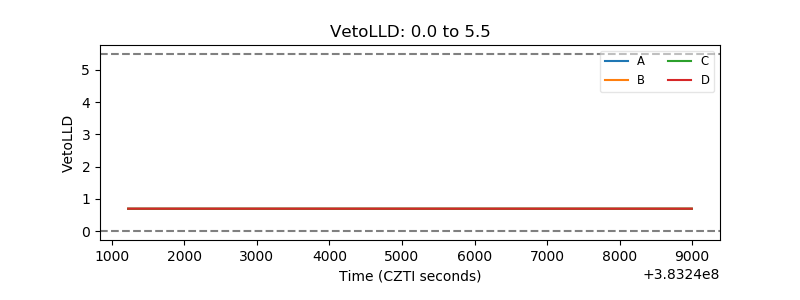 |
| Alpha Counter | 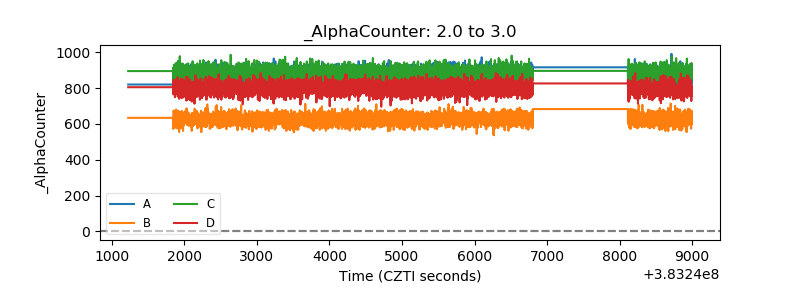 |
| _CPM_Rate | 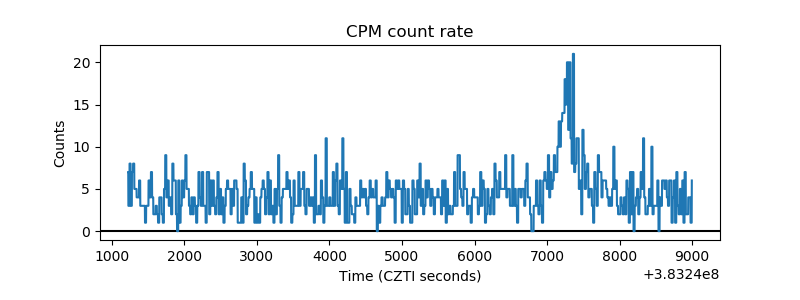 |
| CZT Counter | 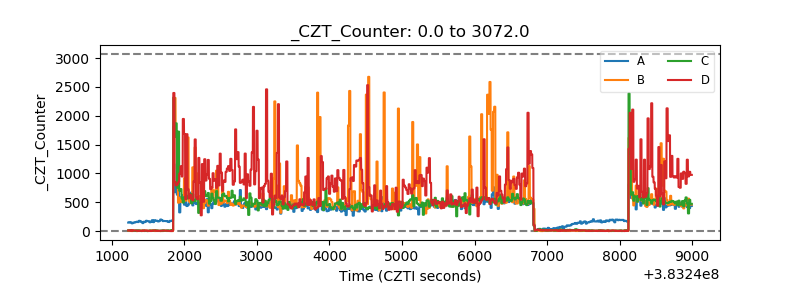 |
| +2.5 Volts monitor | 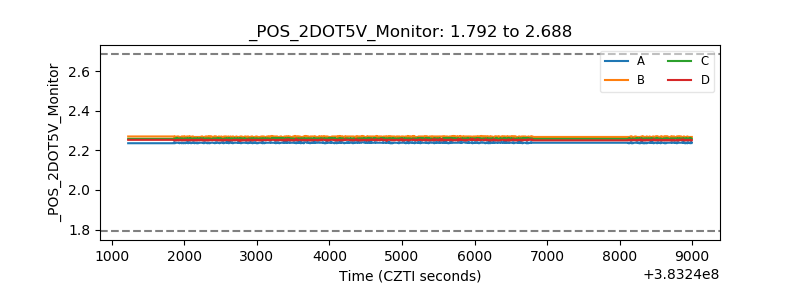 |
| +5 Volts monitor | 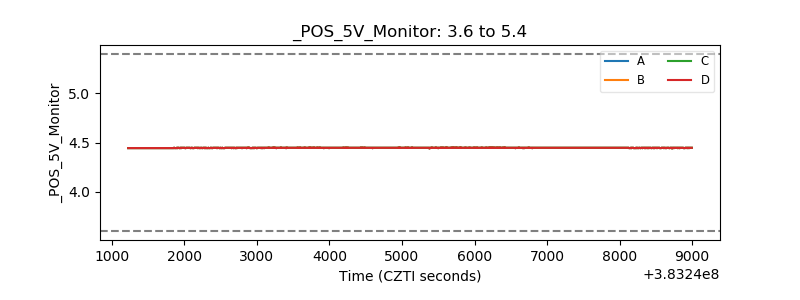 |
| _ROLL_ROT | 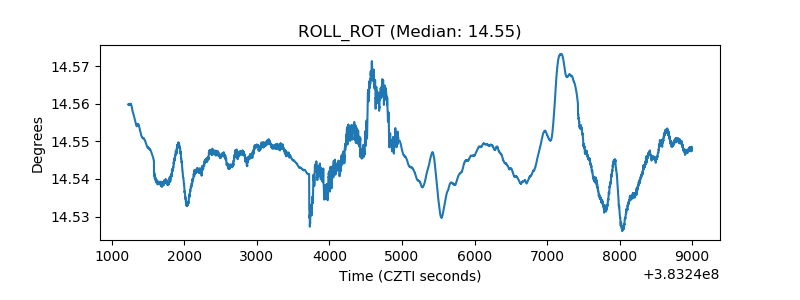 |
| _Roll_DEC | 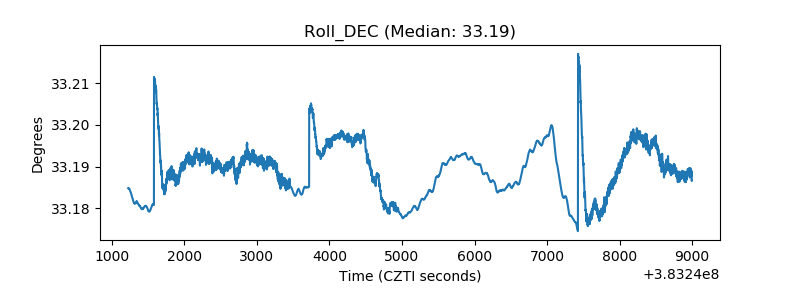 |
| _Roll_RA | 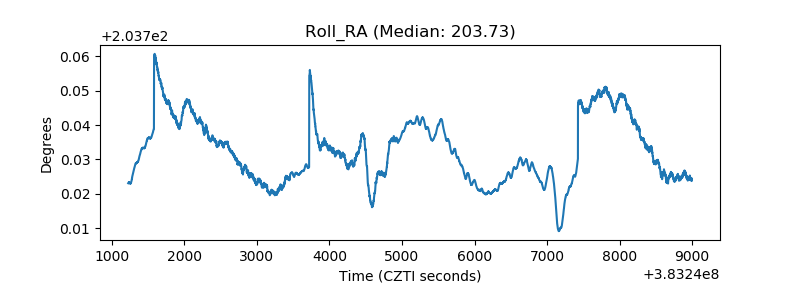 |
| Veto Counter | 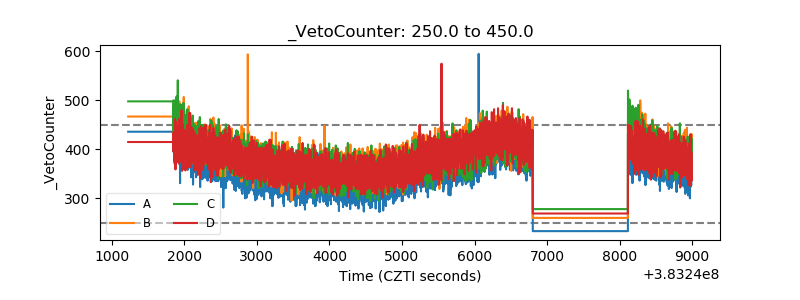 |