| Param | Original file | Final file |
|---|---|---|
| Filename | modeM0/AS1T05_008T01_9000004956_34628cztM0_level2.evt | modeM0/AS1T05_008T01_9000004956_34628cztM0_level2_quad_clean.evt |
| Size (bytes) | 478,339,200 | 61,649,280 |
| Size | 456.2 MB | 58.8 MB |
| Events in quadrant A | 2,546,689 | 384,268 |
| Events in quadrant B | 3,359,896 | 370,760 |
| Events in quadrant C | 2,950,427 | 382,136 |
| Events in quadrant D | 5,263,498 | 351,091 |
| Mode SS | |||
|---|---|---|---|
| Quadrant | BADHDUFLAG | Total packets | Discarded packets |
| A | 0 | 110 | 0 |
| B | 0 | 110 | 0 |
| C | 0 | 110 | 0 |
| D | 0 | 110 | 0 |
| Mode M9 | |||
|---|---|---|---|
| Quadrant | BADHDUFLAG | Total packets | Discarded packets |
| A | 0 | 24 | 0 |
| B | 0 | 24 | 0 |
| C | 0 | 24 | 0 |
| D | 0 | 25 | 0 |
| Mode M0 | |||
|---|---|---|---|
| Quadrant | BADHDUFLAG | Total packets | Discarded packets |
| A | 0 | 11037 | 3 |
| B | 0 | 13282 | 2 |
| C | 0 | 11789 | 2 |
| D | 0 | 19524 | 2 |
| Quadrant | Total seconds | Saturated seconds | Saturation percentage |
|---|---|---|---|
| A | 5400 | 7 | 0.129630% |
| B | 5400 | 251 | 4.648148% |
| C | 5400 | 69 | 1.277778% |
| D | 5400 | 301 | 5.574074% |
Noise dominated data is calculated using 1-second bins in cleaned event files. If a bin has >2000 counts, and if more than 50% of those come from <1% of pixels, then it is considered to be noise-dominated and hence unusable.
| Quadrant | # 1 sec bins | Bins with >0 counts | Bins with >2000 counts | High rate bins dominated by noise | Noise dominated (total time) | Noise dominated (detector-on time) | Marked lightcurve |
|---|---|---|---|---|---|---|---|
| A | 7164 | 5401 | 0 | 0 | 0.00% | 0.00% | 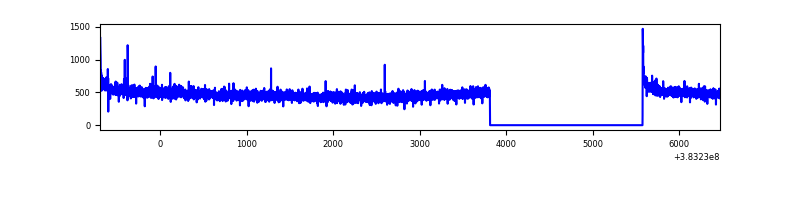 |
| B | 7164 | 5401 | 178 | 178 | 2.48% | 3.30% | 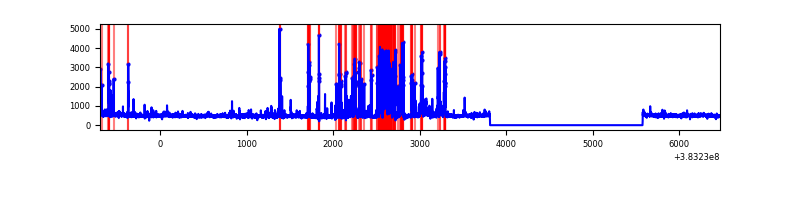 |
| C | 7164 | 5401 | 46 | 46 | 0.64% | 0.85% | 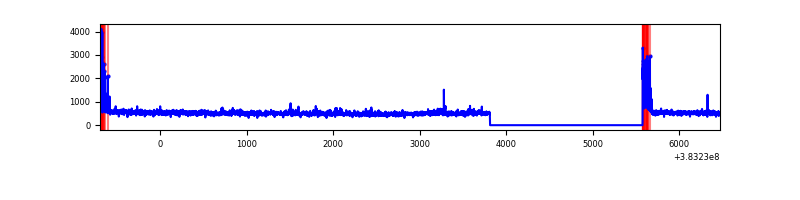 |
| D | 7164 | 5401 | 262 | 262 | 3.66% | 4.85% | 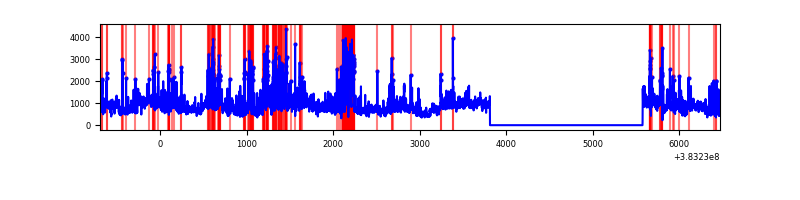 |
Top three noisy pixels from each quadrant. If the there are fewer than three noisy pixels in the level2.evt file, extra rows are filled as -1
| Pixel properties | Quadrant properties | ||||||
|---|---|---|---|---|---|---|---|
| Quadrant | DetID | PixID | Counts | Sigma | Mean | Median | Sigma |
| A | 10 | 83 | 46925 | 361.18 | 638 | 624 | 128.2 |
| A | 13 | 6 | 12576 | 93.23 | 638 | 624 | 128.2 |
| A | 13 | 254 | 10406 | 76.31 | 638 | 624 | 128.2 |
| B | 5 | 172 | 781167 | 6503.52 | 624 | 608 | 120.0 |
| B | 0 | 189 | 48004 | 394.9 | 624 | 608 | 120.0 |
| B | 4 | 232 | 21329 | 172.64 | 624 | 608 | 120.0 |
| C | 15 | 214 | 225582 | 1567.37 | 614 | 619 | 143.5 |
| C | 0 | 10 | 200455 | 1392.3 | 614 | 619 | 143.5 |
| C | 14 | 67 | 113170 | 784.17 | 614 | 619 | 143.5 |
| D | 8 | 195 | 1663706 | 11133.84 | 607 | 589 | 149.4 |
| D | 7 | 223 | 283523 | 1894.12 | 607 | 589 | 149.4 |
| D | 13 | 249 | 253610 | 1693.86 | 607 | 589 | 149.4 |
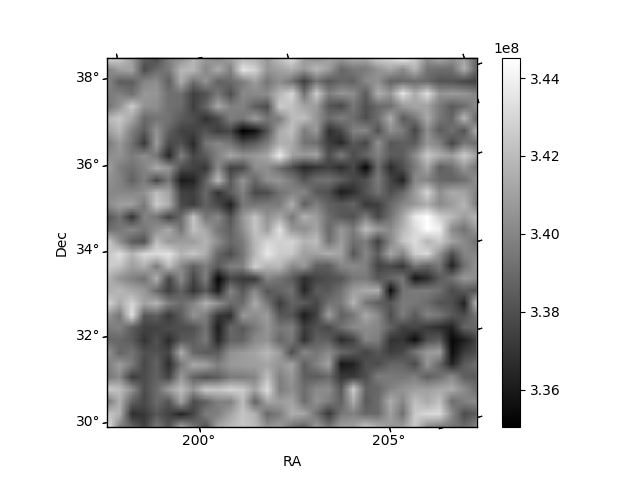
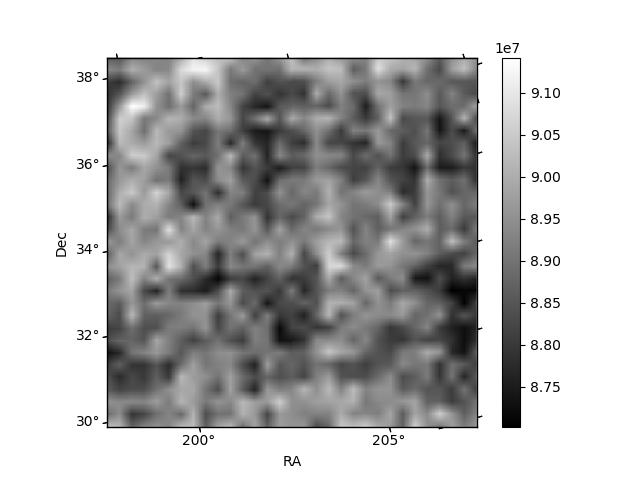
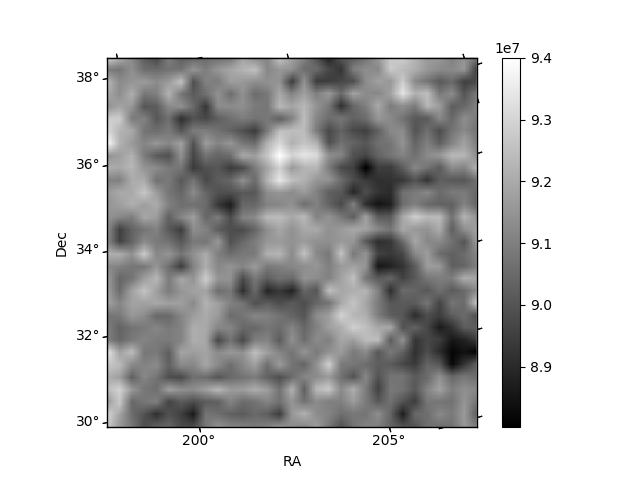
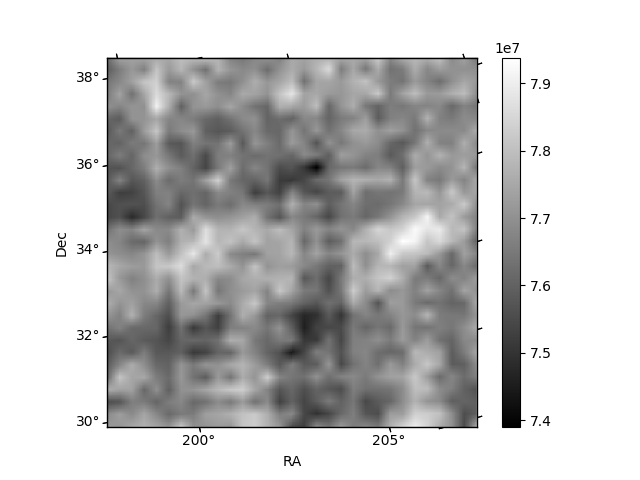
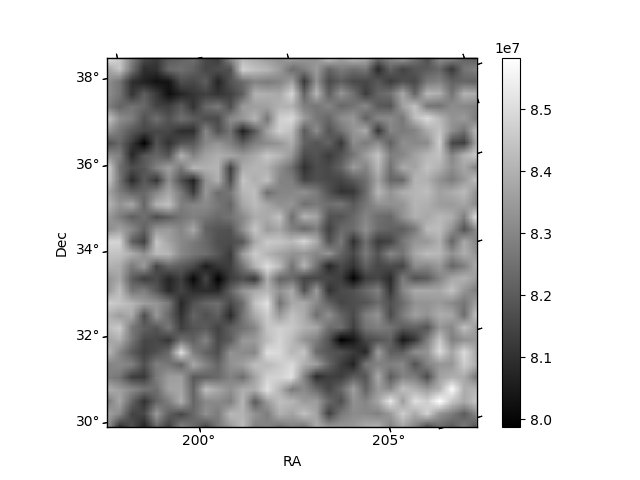
Histogram calculated using DETX and DETY for each event in the final _common_clean file
| Quadrant A | 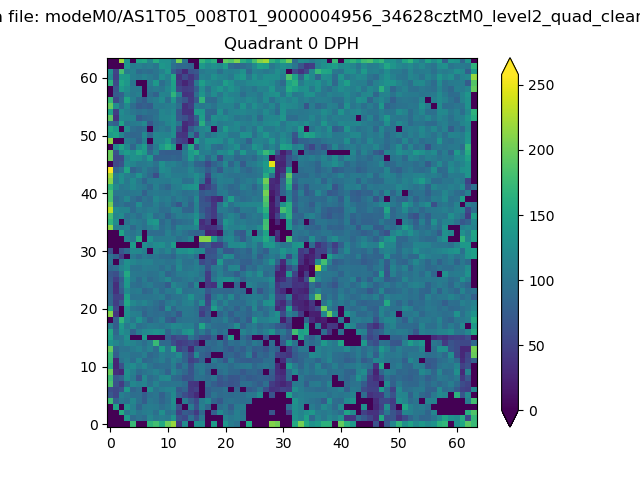 |
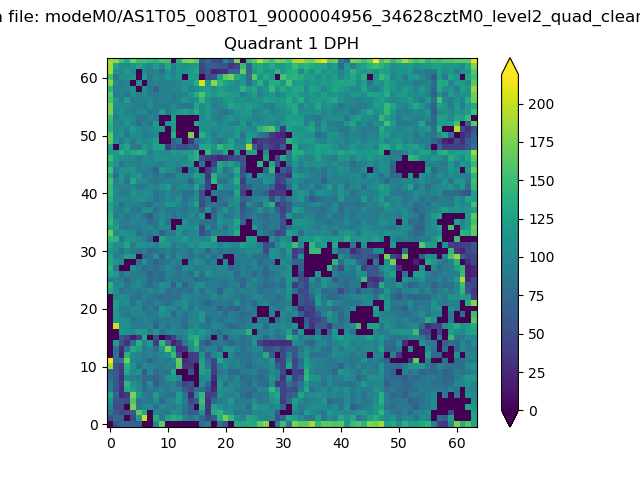 |
Quadrant B |
|---|---|---|---|
| Quadrant D | 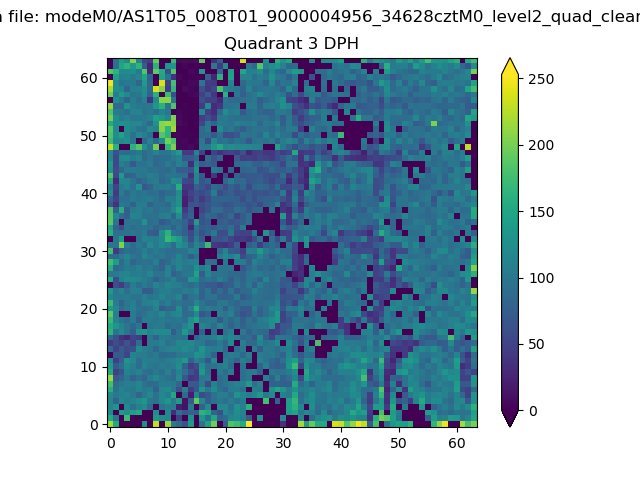 |
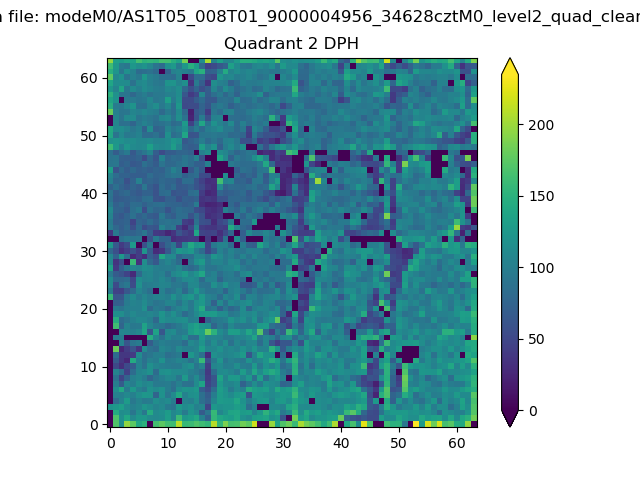 |
Quadrant C |
| Plot type | Count rate plots | Images |
|---|---|---|
| Comparison with Poisson distribution Blue bars denote a histogram of data divided into 1 sec bins. Red curve is a Poisson curve with rate = median count rate of data. |
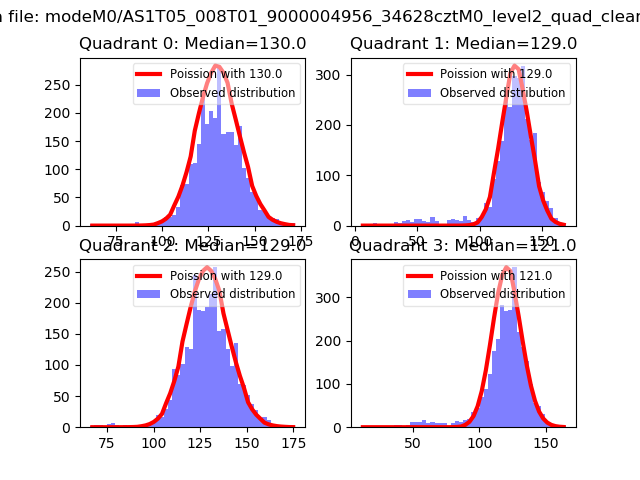 |
 |
| Quadrant-wise count rates Data is divided into 100 sec bins |
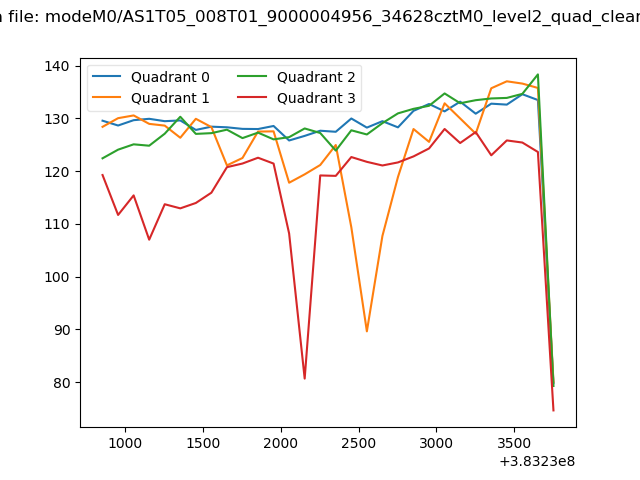 |
|
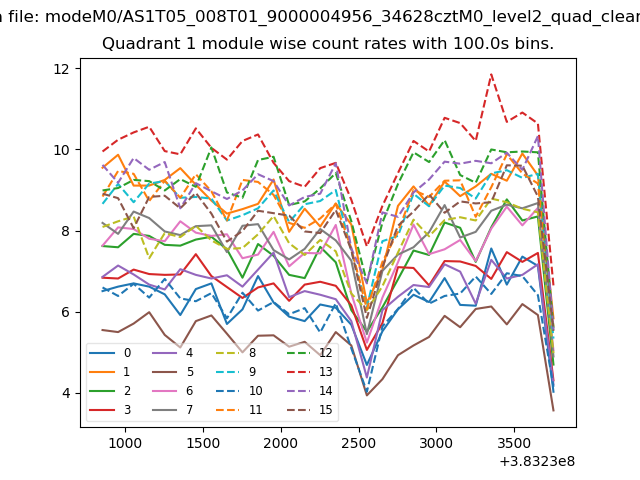
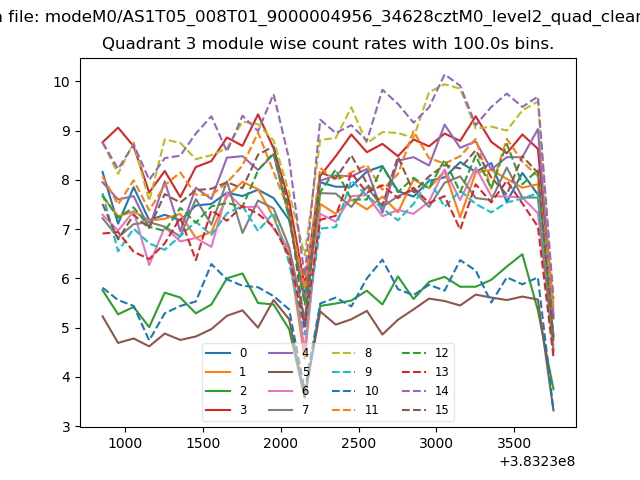
| Module-wise count rates for Quadrant A Data is divided into 100 sec bins |
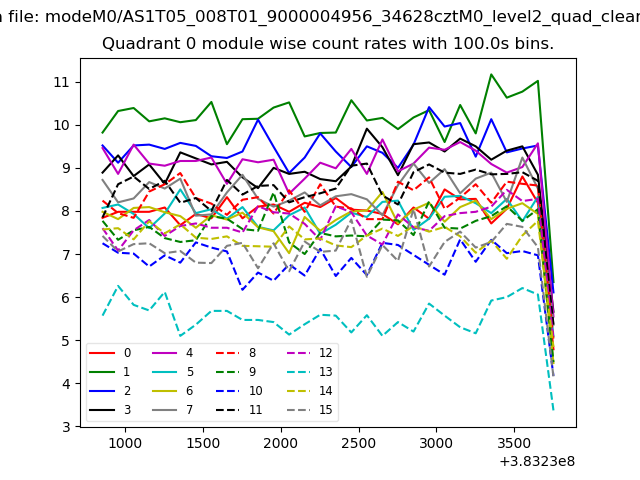 |
 |
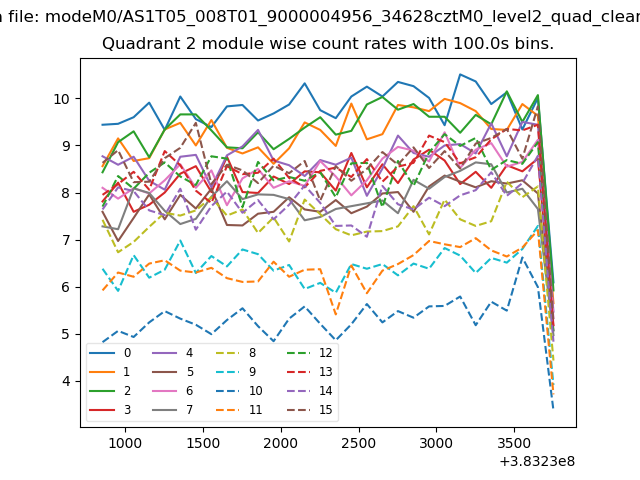
| Module-wise count rates for Quadrant B Data is divided into 100 sec bins |
 |
 |
| Module-wise count rates for Quadrant C Data is divided into 100 sec bins |
 |
 |
| Module-wise count rates for Quadrant D Data is divided into 100 sec bins |
 |
 |
| Parameter | Plot |
|---|---|
| CZT HV Monitor | 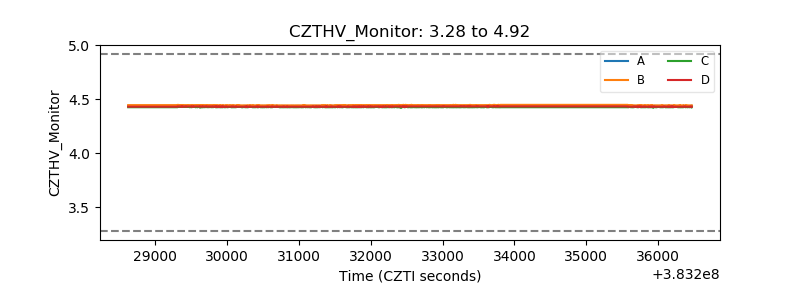 |
| D_VDD | 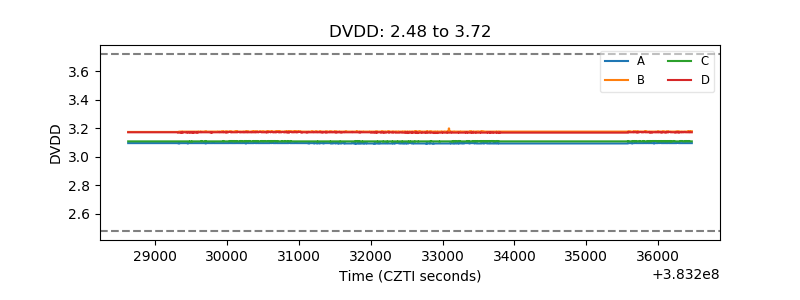 |
| Temperature 1 | 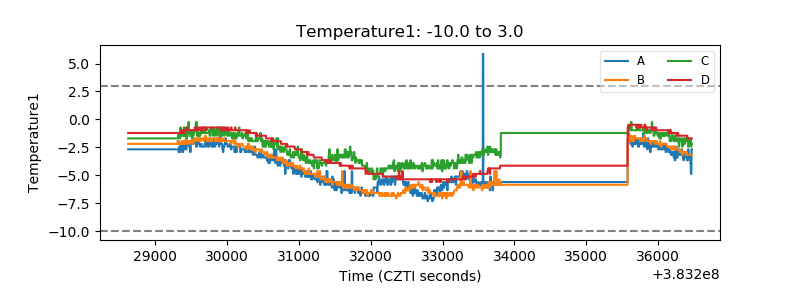 |
| Veto HV Monitor | 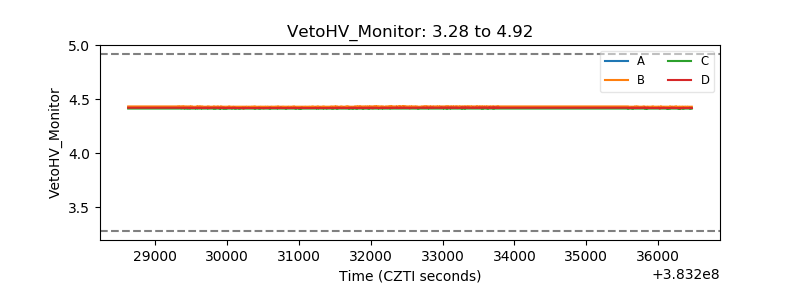 |
| Veto LLD | 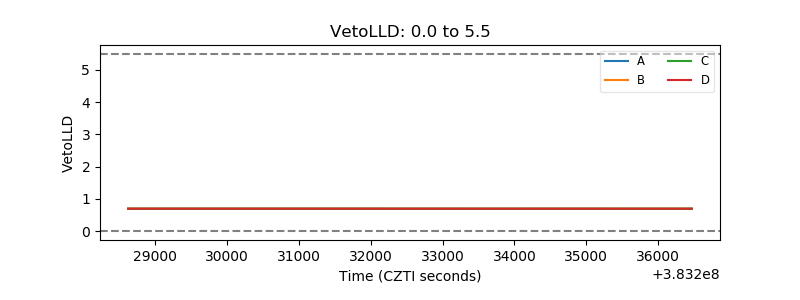 |
| Alpha Counter | 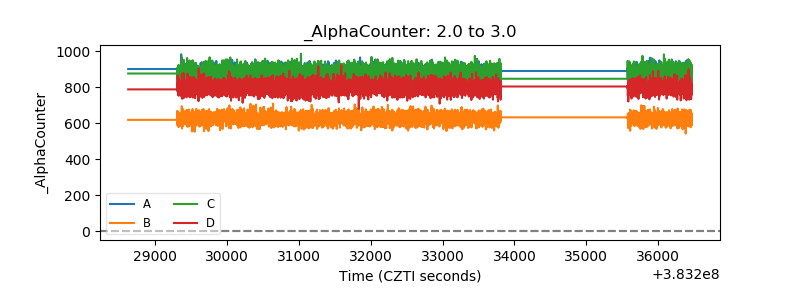 |
| _CPM_Rate | 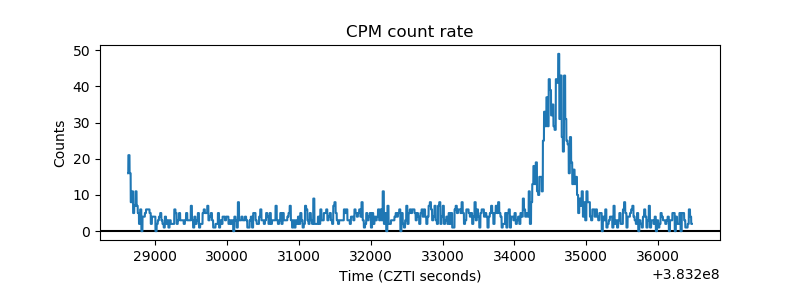 |
| CZT Counter | 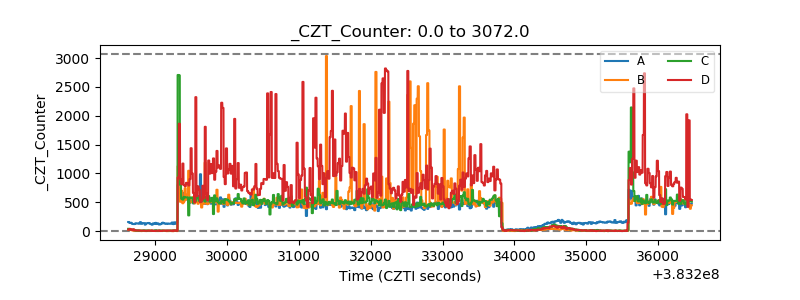 |
| +2.5 Volts monitor | 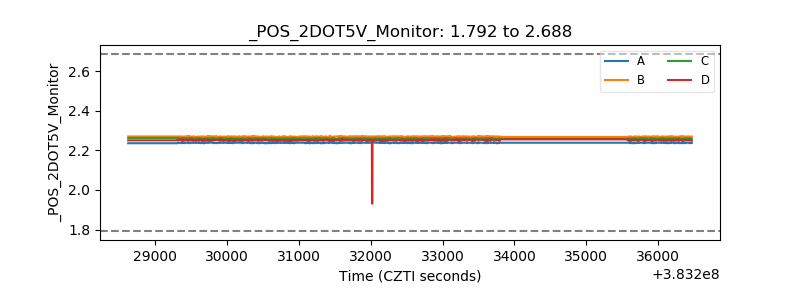 |
| +5 Volts monitor | 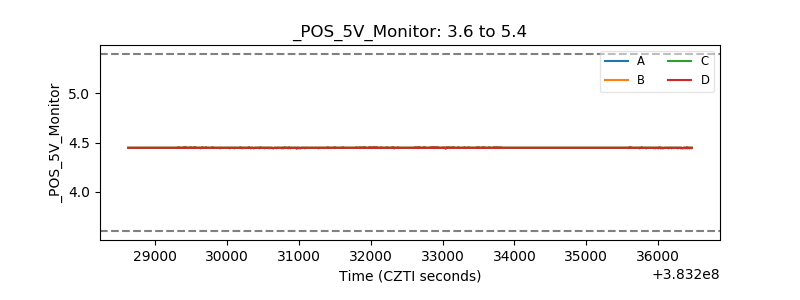 |
| _ROLL_ROT | 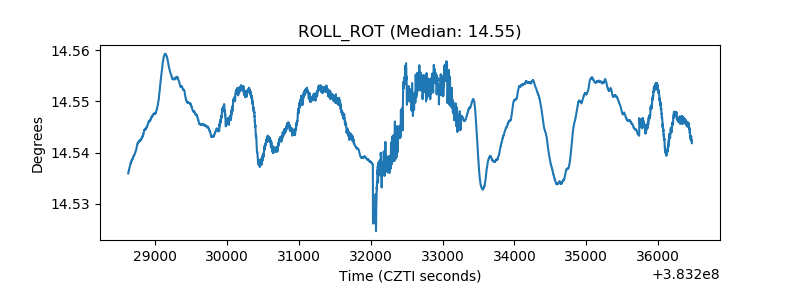 |
| _Roll_DEC | 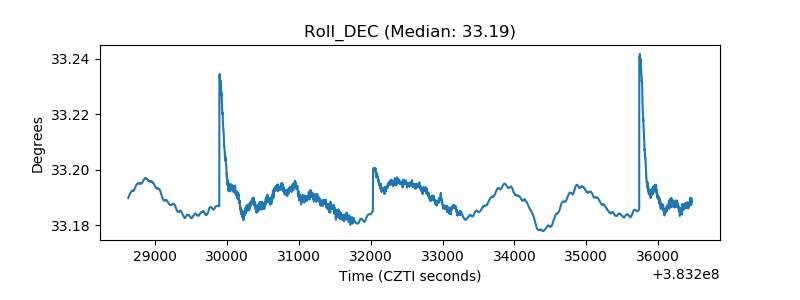 |
| _Roll_RA | 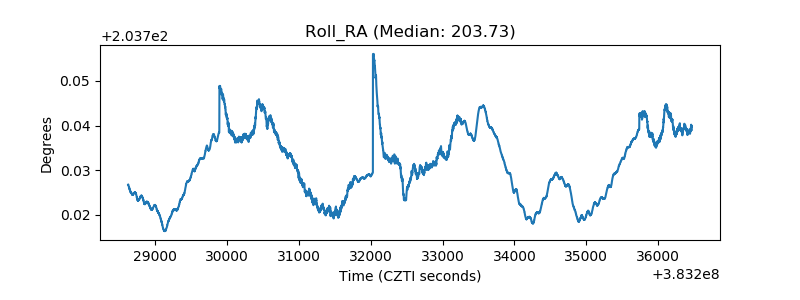 |
| Veto Counter | 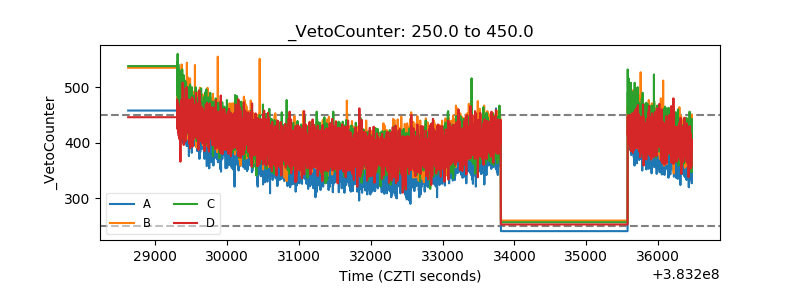 |