| Param | Original file | Final file |
|---|---|---|
| Filename | modeM0/AS1A11_058T02_9000004954_34622cztM0_level2.evt | modeM0/AS1A11_058T02_9000004954_34622cztM0_level2_quad_clean.evt |
| Size (bytes) | 503,291,520 | 73,324,800 |
| Size | 480.0 MB | 69.9 MB |
| Events in quadrant A | 2,646,434 | 471,462 |
| Events in quadrant B | 3,960,171 | 463,083 |
| Events in quadrant C | 2,967,168 | 463,297 |
| Events in quadrant D | 5,294,909 | 436,422 |
| Mode M9 | |||
|---|---|---|---|
| Quadrant | BADHDUFLAG | Total packets | Discarded packets |
| A | 0 | 22 | 0 |
| B | 0 | 22 | 0 |
| C | 0 | 22 | 0 |
| D | 0 | 23 | 0 |
| Mode M0 | |||
|---|---|---|---|
| Quadrant | BADHDUFLAG | Total packets | Discarded packets |
| A | 0 | 11354 | 3 |
| B | 0 | 15263 | 2 |
| C | 0 | 12016 | 2 |
| D | 0 | 19579 | 2 |
| Mode SS | |||
|---|---|---|---|
| Quadrant | BADHDUFLAG | Total packets | Discarded packets |
| A | 0 | 112 | 0 |
| B | 0 | 112 | 0 |
| C | 0 | 112 | 0 |
| D | 0 | 112 | 0 |
| Quadrant | Total seconds | Saturated seconds | Saturation percentage |
|---|---|---|---|
| A | 5516 | 12 | 0.217549% |
| B | 5516 | 411 | 7.451051% |
| C | 5516 | 67 | 1.214648% |
| D | 5516 | 217 | 3.934010% |
Noise dominated data is calculated using 1-second bins in cleaned event files. If a bin has >2000 counts, and if more than 50% of those come from <1% of pixels, then it is considered to be noise-dominated and hence unusable.
| Quadrant | # 1 sec bins | Bins with >0 counts | Bins with >2000 counts | High rate bins dominated by noise | Noise dominated (total time) | Noise dominated (detector-on time) | Marked lightcurve |
|---|---|---|---|---|---|---|---|
| A | 7309 | 5517 | 3 | 3 | 0.04% | 0.05% | 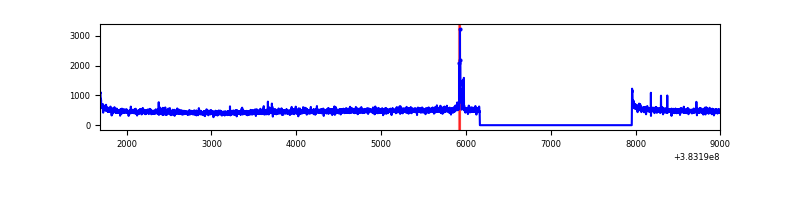 |
| B | 7309 | 5517 | 277 | 277 | 3.79% | 5.02% | 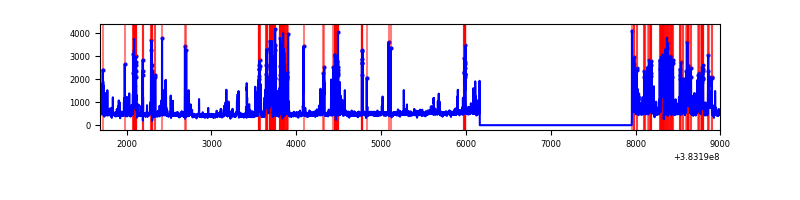 |
| C | 7309 | 5517 | 51 | 51 | 0.70% | 0.92% | 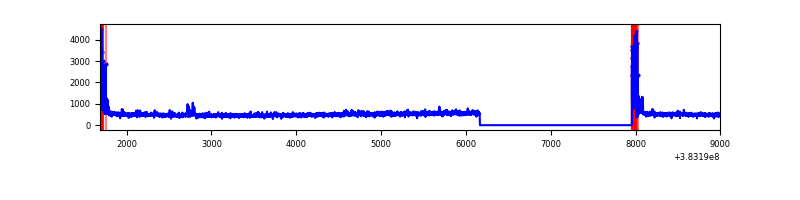 |
| D | 7309 | 5517 | 142 | 142 | 1.94% | 2.57% | 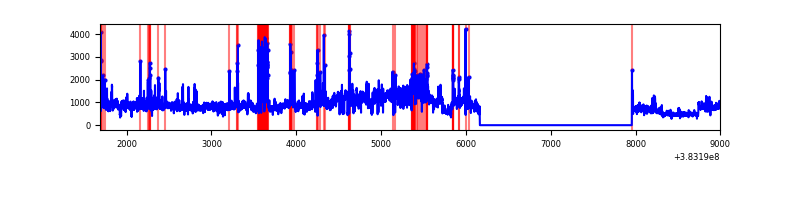 |
Top three noisy pixels from each quadrant. If the there are fewer than three noisy pixels in the level2.evt file, extra rows are filled as -1
| Pixel properties | Quadrant properties | ||||||
|---|---|---|---|---|---|---|---|
| Quadrant | DetID | PixID | Counts | Sigma | Mean | Median | Sigma |
| A | 15 | 174 | 51203 | 386.52 | 657 | 646 | 130.8 |
| A | 10 | 83 | 44009 | 331.52 | 657 | 646 | 130.8 |
| A | 13 | 254 | 9302 | 66.18 | 657 | 646 | 130.8 |
| B | 5 | 172 | 1283043 | 10587.53 | 631 | 616 | 121.1 |
| B | 4 | 171 | 69553 | 569.13 | 631 | 616 | 121.1 |
| B | 0 | 189 | 59063 | 482.53 | 631 | 616 | 121.1 |
| C | 15 | 214 | 229797 | 1579.1 | 626 | 631 | 145.1 |
| C | 0 | 10 | 210386 | 1445.34 | 626 | 631 | 145.1 |
| C | 14 | 67 | 73472 | 501.92 | 626 | 631 | 145.1 |
| D | 8 | 195 | 2259103 | 14916.73 | 622 | 605 | 151.4 |
| D | 2 | 249 | 303529 | 2000.73 | 622 | 605 | 151.4 |
| D | 12 | 6 | 66644 | 436.17 | 622 | 605 | 151.4 |
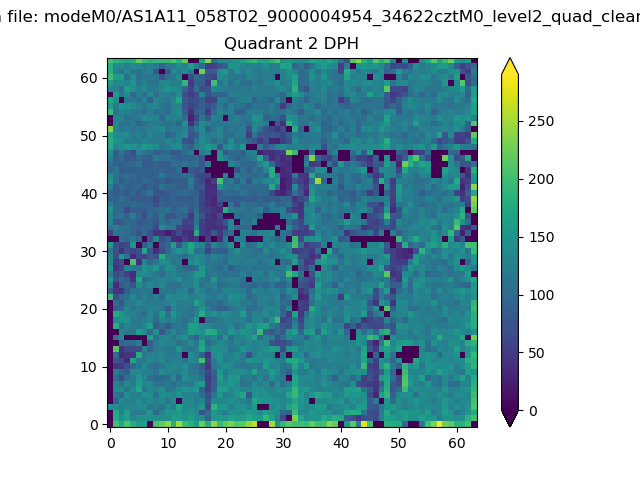
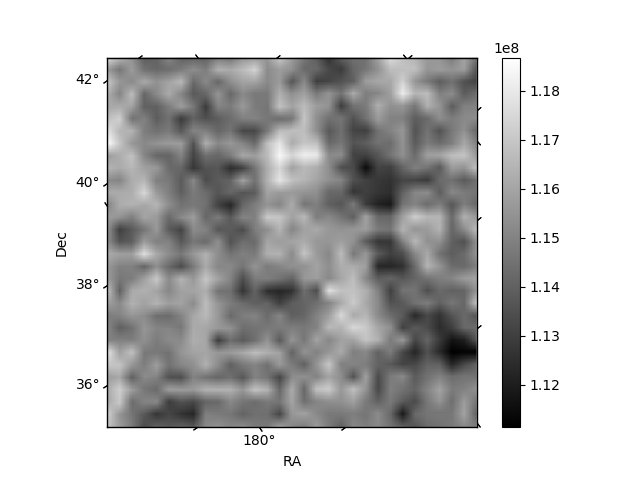
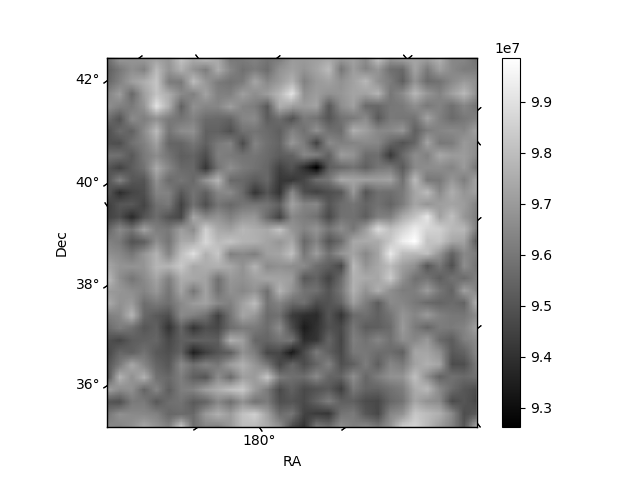
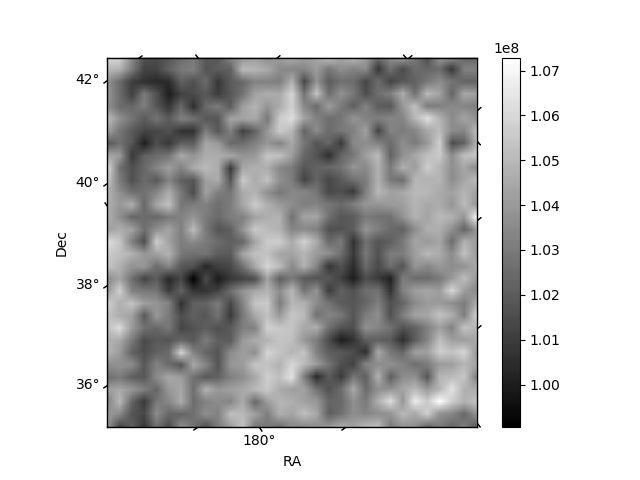
Histogram calculated using DETX and DETY for each event in the final _common_clean file
| Quadrant A | 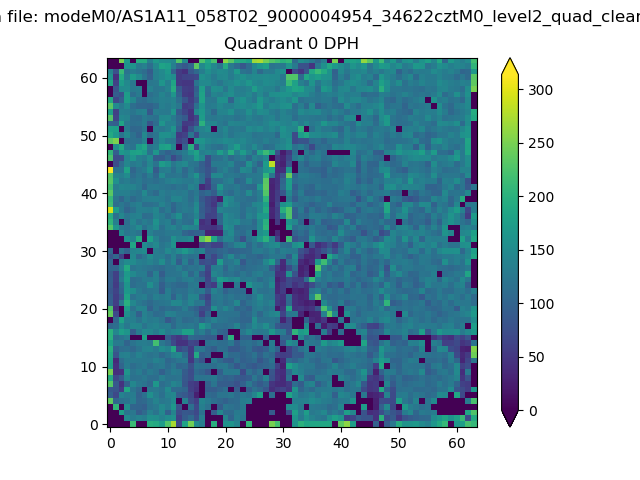 |
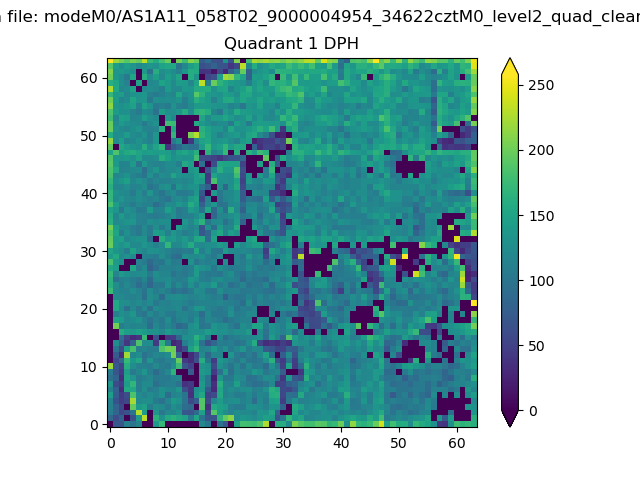 |
Quadrant B |
|---|---|---|---|
| Quadrant D | 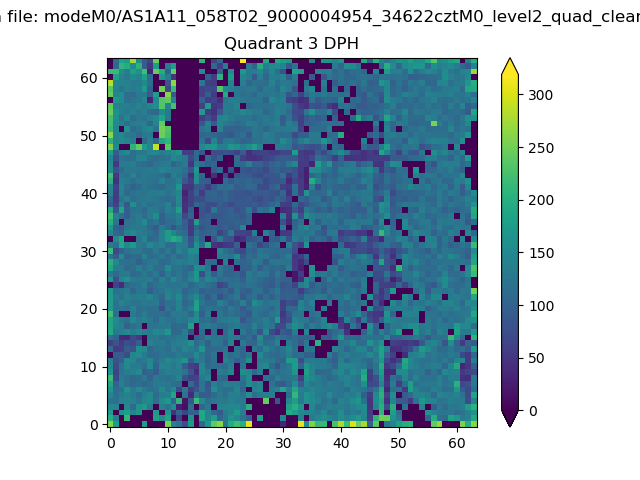 |
 |
Quadrant C |
| Plot type | Count rate plots | Images |
|---|---|---|
| Comparison with Poisson distribution Blue bars denote a histogram of data divided into 1 sec bins. Red curve is a Poisson curve with rate = median count rate of data. |
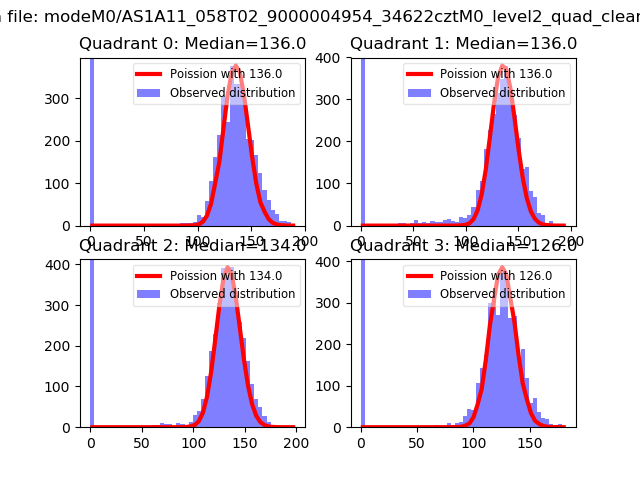 |
 |
| Quadrant-wise count rates Data is divided into 100 sec bins |
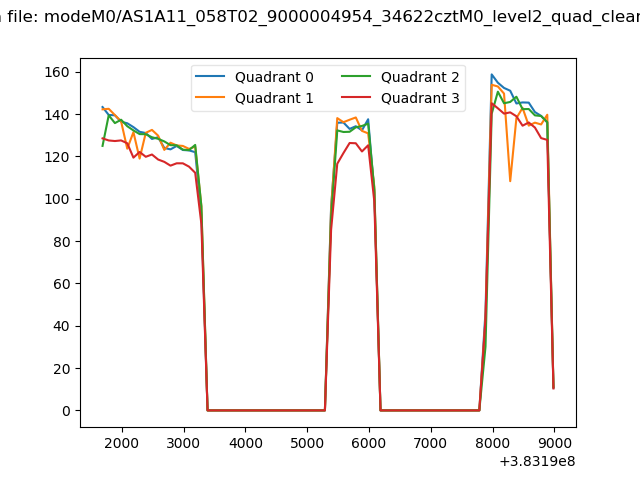 |
|
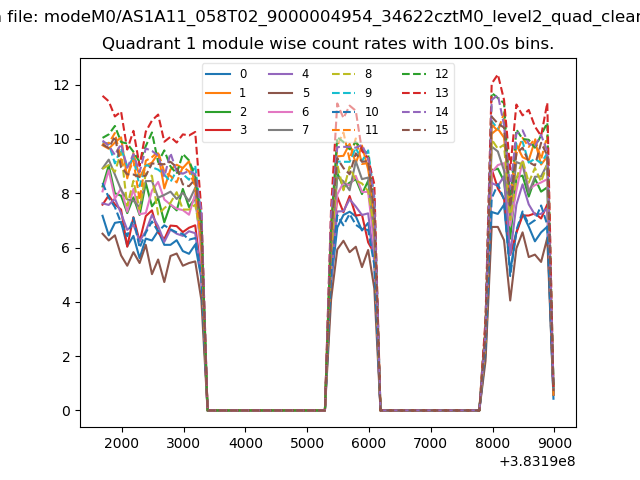
| Module-wise count rates for Quadrant A Data is divided into 100 sec bins |
 |
 |
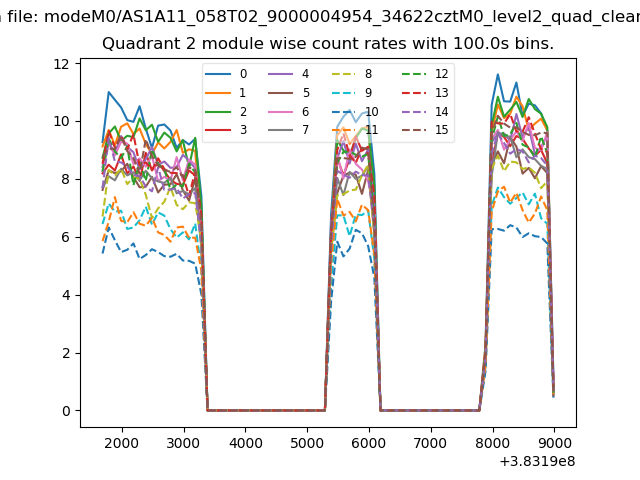
| Module-wise count rates for Quadrant B Data is divided into 100 sec bins |
 |
 |
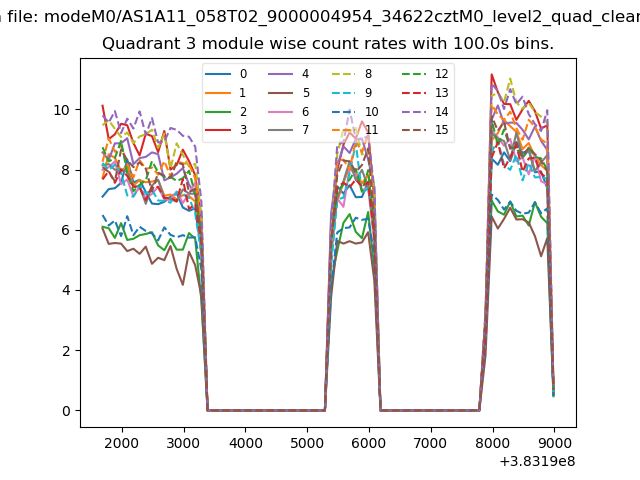
| Module-wise count rates for Quadrant C Data is divided into 100 sec bins |
 |
 |
| Module-wise count rates for Quadrant D Data is divided into 100 sec bins |
 |
 |
| Parameter | Plot |
|---|---|
| CZT HV Monitor | 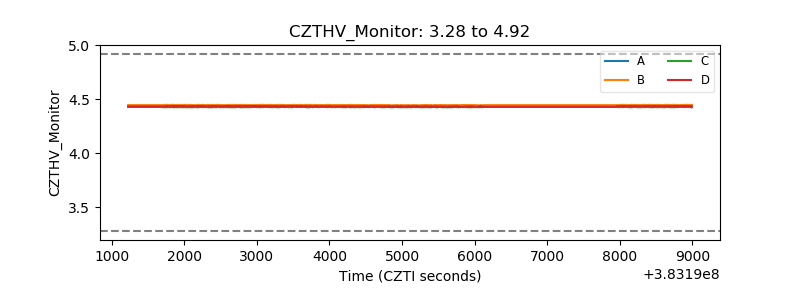 |
| D_VDD | 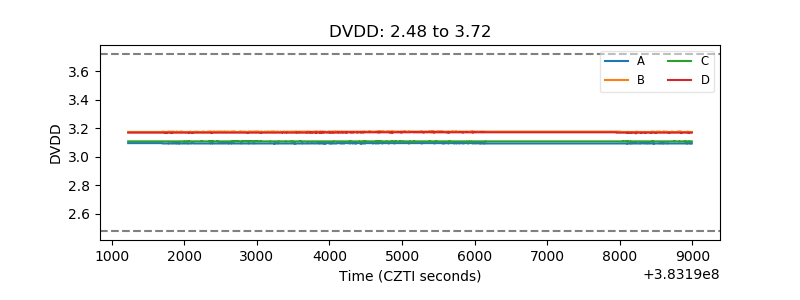 |
| Temperature 1 | 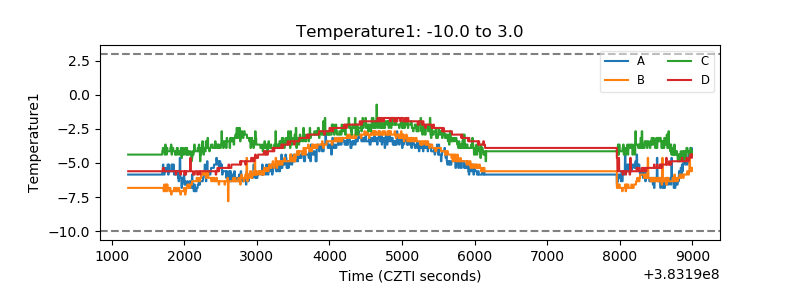 |
| Veto HV Monitor | 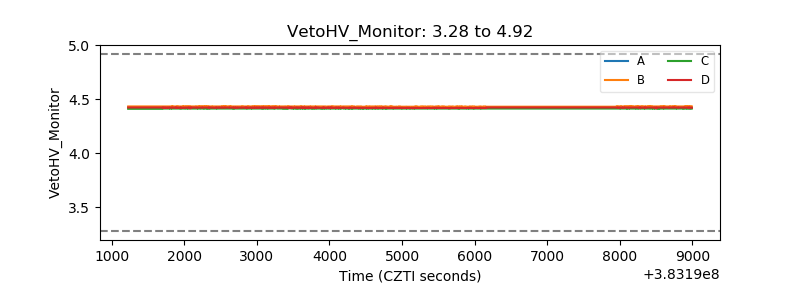 |
| Veto LLD | 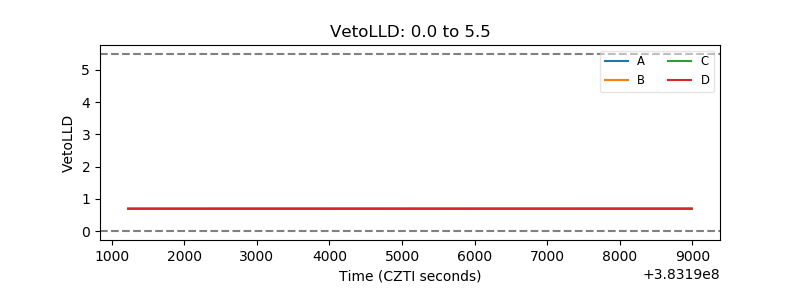 |
| Alpha Counter | 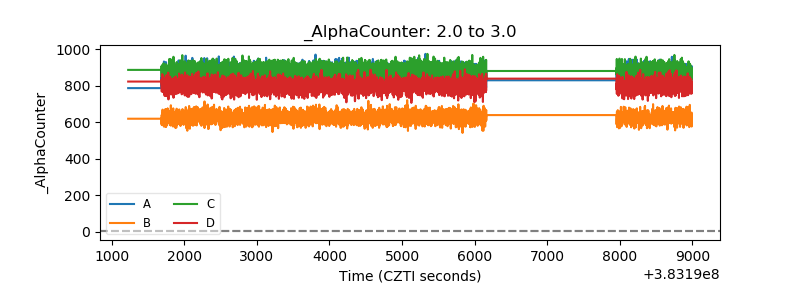 |
| _CPM_Rate | 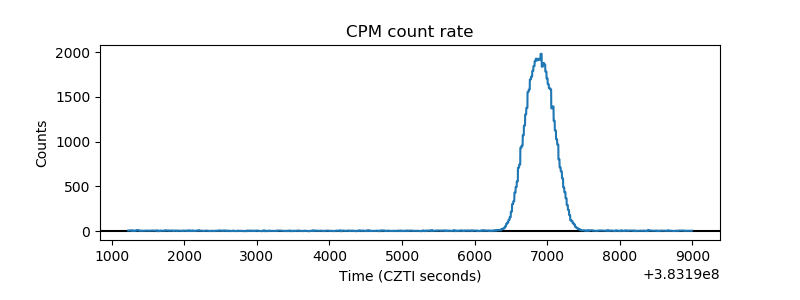 |
| CZT Counter |  |
| +2.5 Volts monitor | 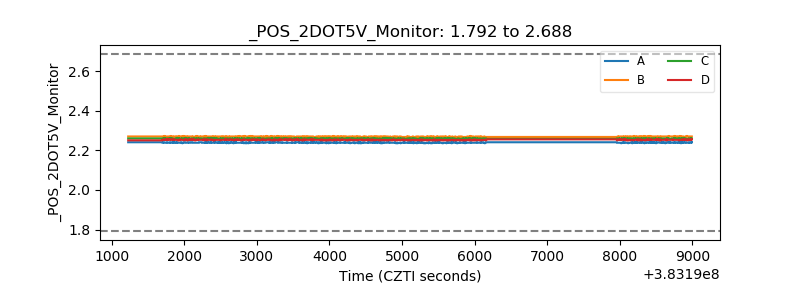 |
| +5 Volts monitor | 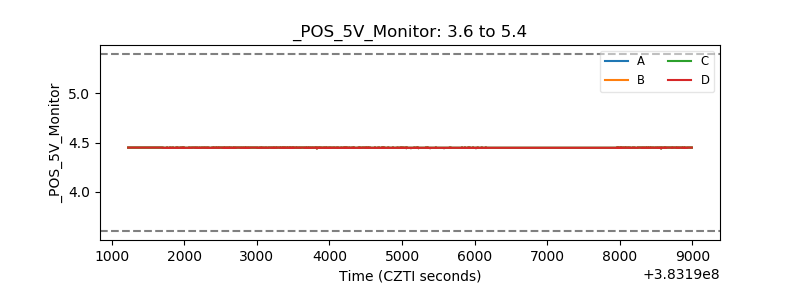 |
| _ROLL_ROT | 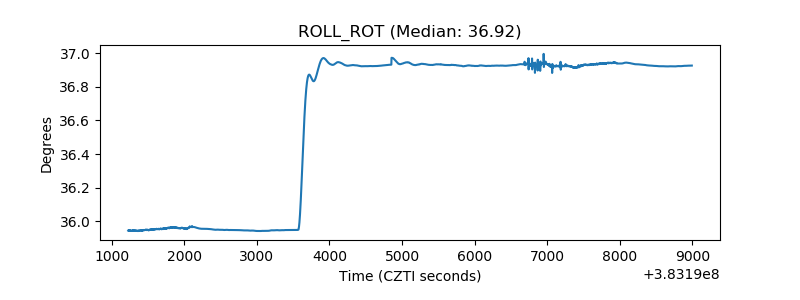 |
| _Roll_DEC | 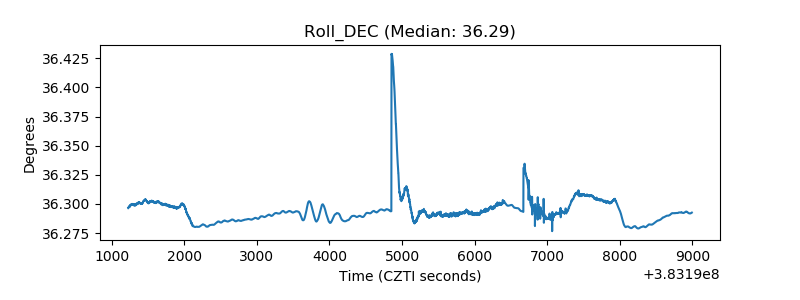 |
| _Roll_RA | 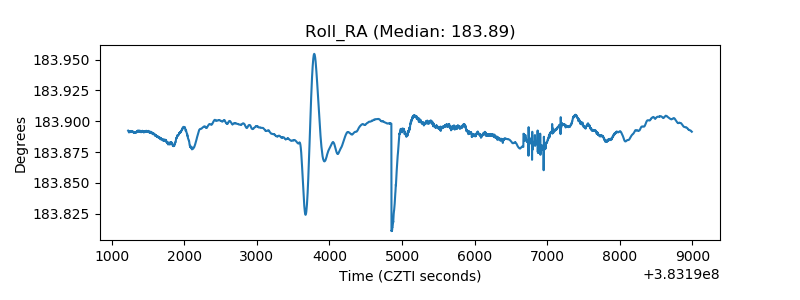 |
| Veto Counter |  |