| Param | Original file | Final file |
|---|---|---|
| Filename | modeM0/AS1A11_058T02_9000004954cztM0_level2_bc.evt | modeM0/AS1A11_058T02_9000004954cztM0_level2_quad_clean.evt |
| Size (bytes) | 2,063,831,040 | 463,579,200 |
| Size | 1.9 GB | 442.1 MB |
| Events in quadrant A | 8,803,837 | 2,937,340 |
| Events in quadrant B | 15,174,798 | 2,859,596 |
| Events in quadrant C | 10,763,418 | 2,885,270 |
| Events in quadrant D | 25,091,016 | 2,661,911 |
| Mode M9 | |||
|---|---|---|---|
| Quadrant | BADHDUFLAG | Total packets | Discarded packets |
| A | 0 | 138 | 0 |
| B | 0 | 138 | 0 |
| C | 0 | 138 | 0 |
| D | 0 | 139 | 0 |
| Mode M0 | |||
|---|---|---|---|
| Quadrant | BADHDUFLAG | Total packets | Discarded packets |
| A | 0 | 80987 | 0 |
| B | 0 | 109407 | 0 |
| C | 0 | 84179 | 0 |
| D | 0 | 139153 | 0 |
| Mode SS | |||
|---|---|---|---|
| Quadrant | BADHDUFLAG | Total packets | Discarded packets |
| A | 0 | 806 | 0 |
| B | 0 | 806 | 0 |
| C | 0 | 806 | 0 |
| D | 0 | 806 | 0 |
| Quadrant | Total seconds | Saturated seconds | Saturation percentage |
|---|---|---|---|
| A | 39314 | 90 | 0.228926% |
| B | 39304 | 2785 | 7.085793% |
| C | 38992 | 385 | 0.987382% |
| D | 39340 | 2713 | 6.896289% |
Noise dominated data is calculated using 1-second bins in cleaned event files. If a bin has >2000 counts, and if more than 50% of those come from <1% of pixels, then it is considered to be noise-dominated and hence unusable.
| Quadrant | # 1 sec bins | Bins with >0 counts | Bins with >2000 counts | High rate bins dominated by noise | Noise dominated (total time) | Noise dominated (detector-on time) | Marked lightcurve |
|---|---|---|---|---|---|---|---|
| A | 58052 | 39337 | 17 | 17 | 0.03% | 0.04% | 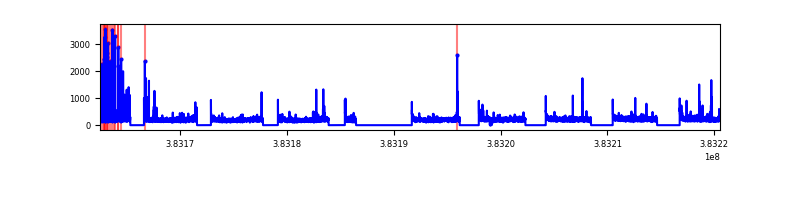 |
| B | 58052 | 39317 | 175 | 175 | 0.30% | 0.45% | 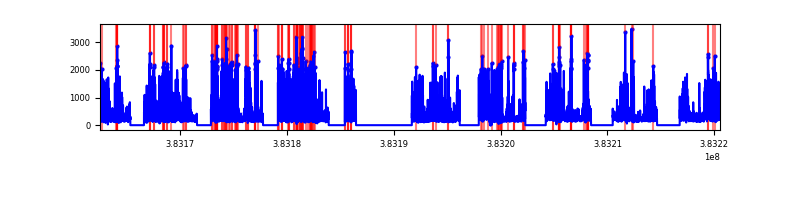 |
| C | 58052 | 39007 | 77 | 77 | 0.13% | 0.20% | 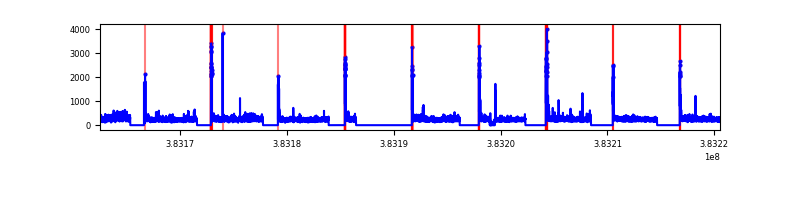 |
| D | 58052 | 39347 | 275 | 275 | 0.47% | 0.70% | 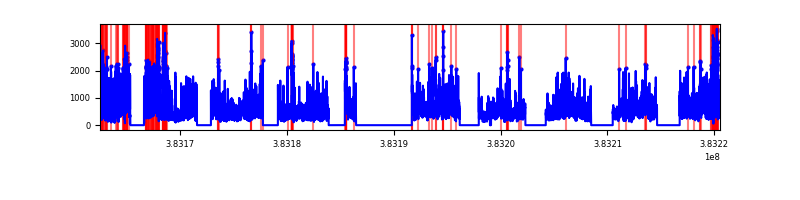 |
Top three noisy pixels from each quadrant. If the there are fewer than three noisy pixels in the level2.evt file, extra rows are filled as -1
| Pixel properties | Quadrant properties | ||||||
|---|---|---|---|---|---|---|---|
| Quadrant | DetID | PixID | Counts | Sigma | Mean | Median | Sigma |
| A | 10 | 83 | 218217 | 467.74 | 2109 | 2076 | 462.1 |
| A | 15 | 169 | 185233 | 396.36 | 2109 | 2076 | 462.1 |
| A | 13 | 6 | 92103 | 194.82 | 2109 | 2076 | 462.1 |
| B | 5 | 172 | 6071339 | 14981.84 | 2055 | 2014 | 405.1 |
| B | 4 | 171 | 275768 | 675.75 | 2055 | 2014 | 405.1 |
| B | 4 | 232 | 267916 | 656.37 | 2055 | 2014 | 405.1 |
| C | 15 | 214 | 1535742 | 3346.6 | 2015 | 2002 | 458.3 |
| C | 0 | 10 | 763258 | 1661.05 | 2015 | 2002 | 458.3 |
| C | 14 | 67 | 415922 | 903.17 | 2015 | 2002 | 458.3 |
| D | 8 | 195 | 11228678 | 23699.44 | 1995 | 1937 | 473.7 |
| D | 2 | 249 | 2897779 | 6113.07 | 1995 | 1937 | 473.7 |
| D | 13 | 249 | 483328 | 1016.21 | 1995 | 1937 | 473.7 |
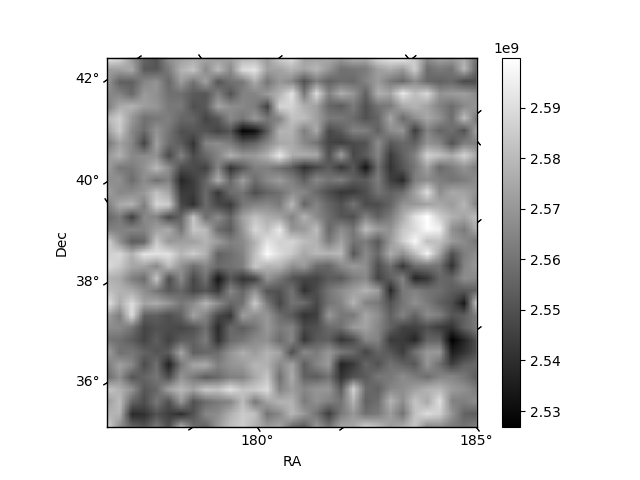
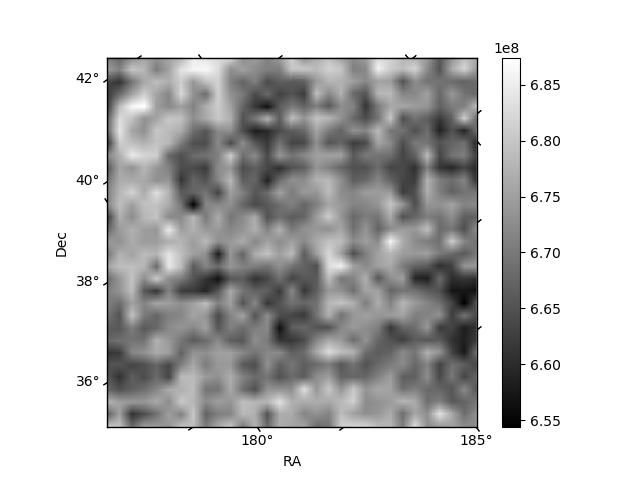
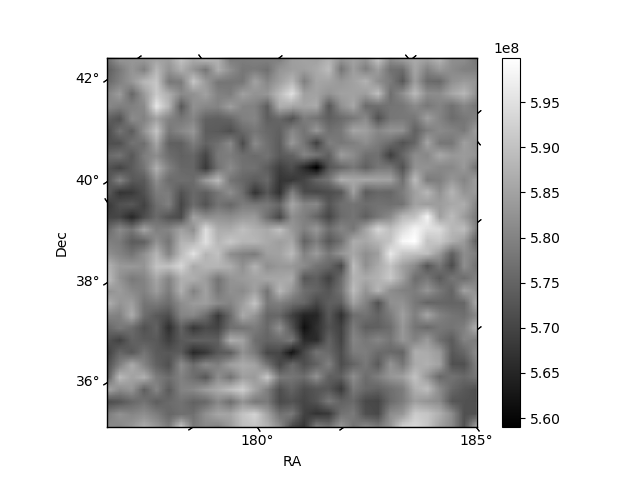
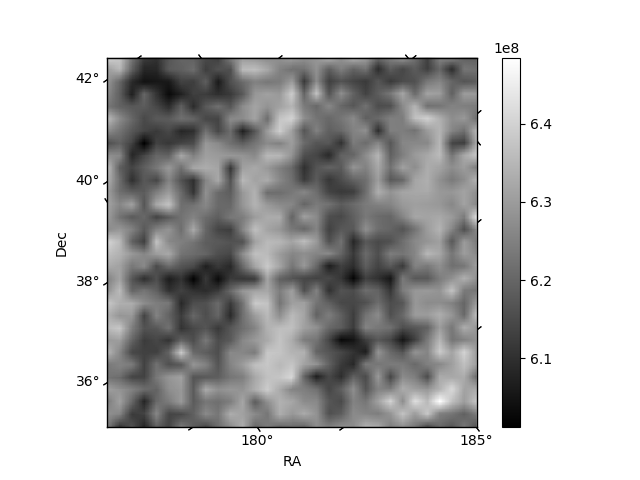
Histogram calculated using DETX and DETY for each event in the final _common_clean file
| Quadrant A | 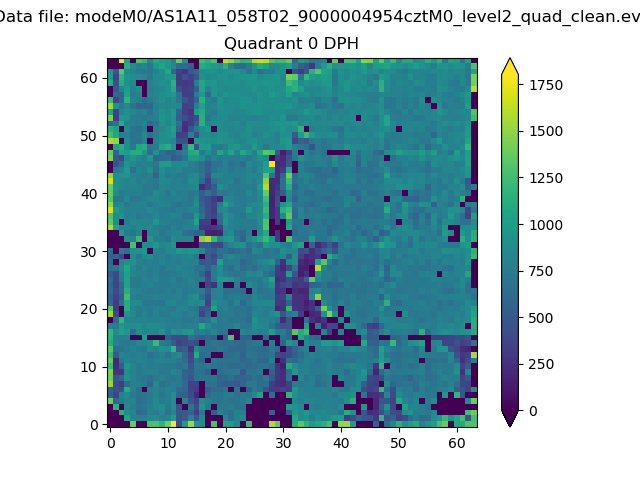 |
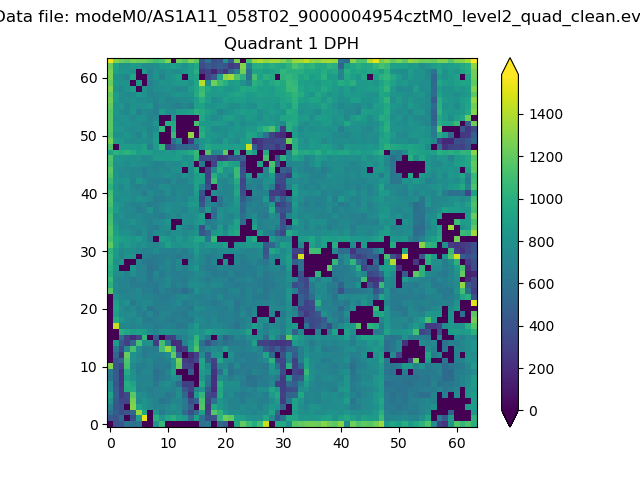 |
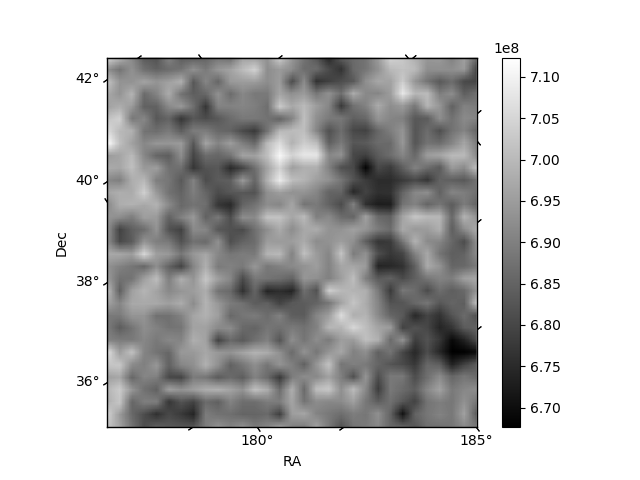
Quadrant B |
|---|---|---|---|
| Quadrant D | 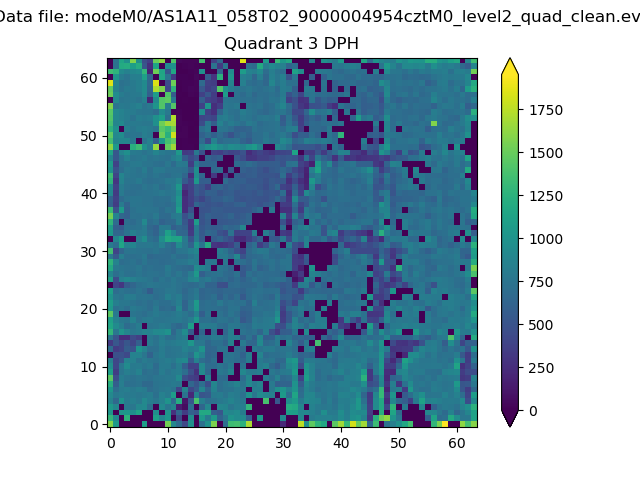 |
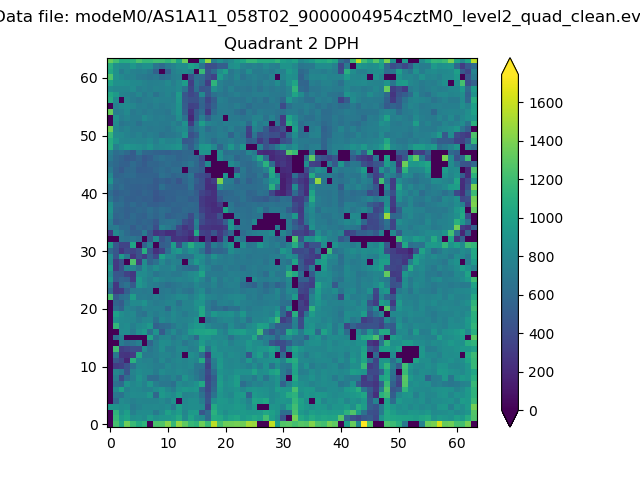 |
Quadrant C |
| Plot type | Count rate plots | Images |
|---|---|---|
| Comparison with Poisson distribution Blue bars denote a histogram of data divided into 1 sec bins. Red curve is a Poisson curve with rate = median count rate of data. |
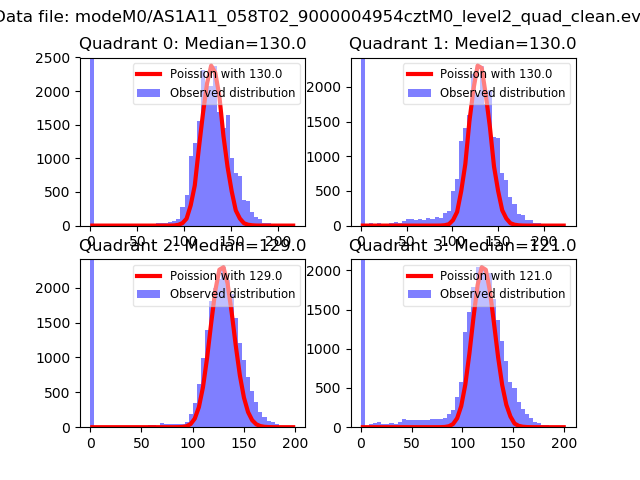 |
 |
| Quadrant-wise count rates Data is divided into 100 sec bins |
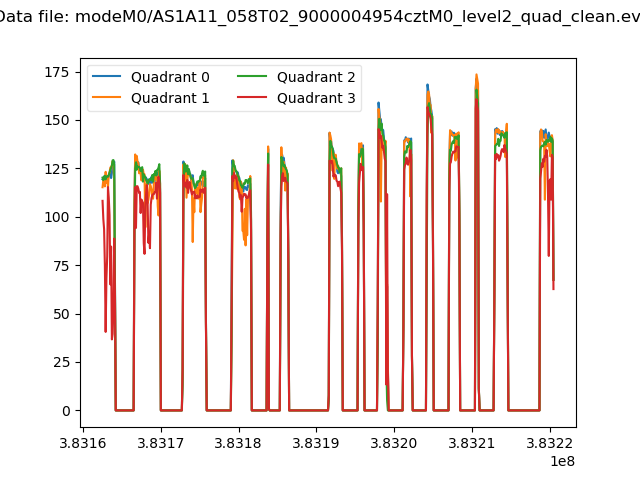 |
|
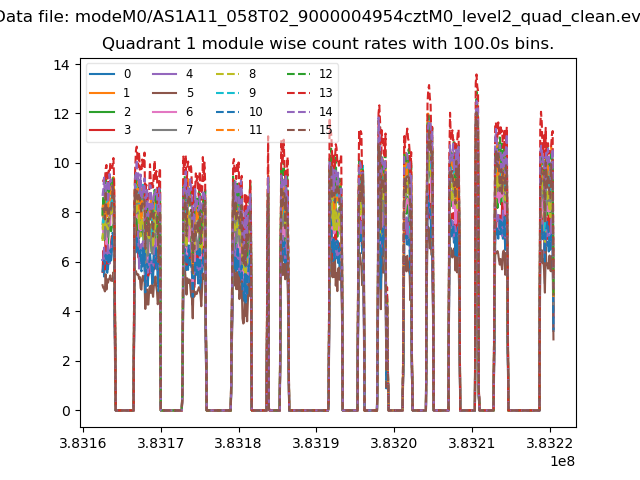
| Module-wise count rates for Quadrant A Data is divided into 100 sec bins |
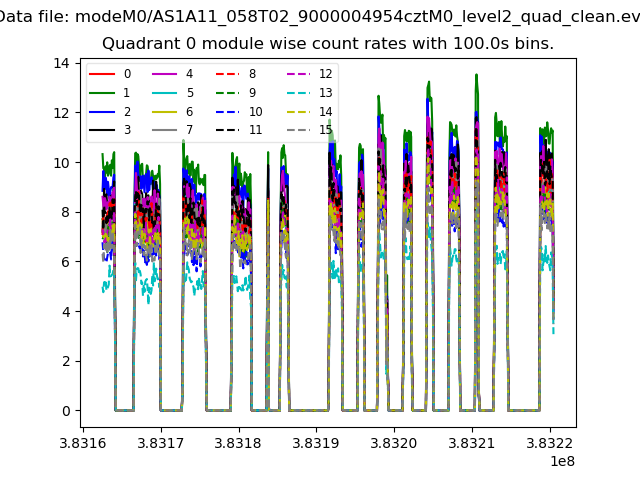 |
 |
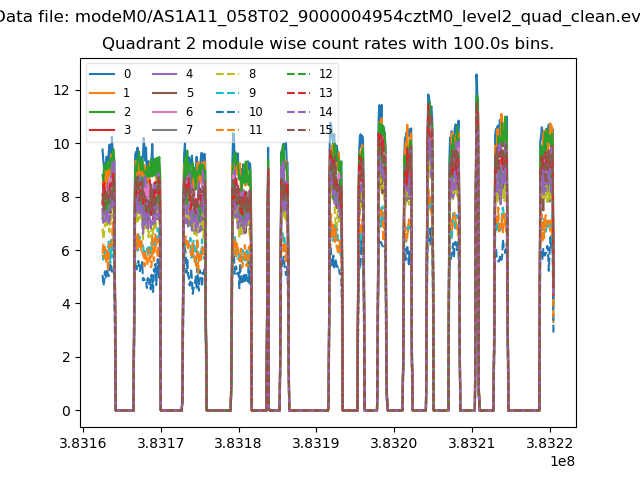
| Module-wise count rates for Quadrant B Data is divided into 100 sec bins |
 |
 |
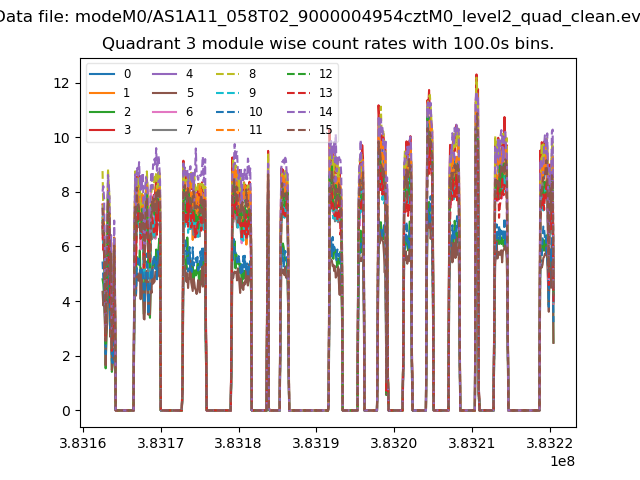
| Module-wise count rates for Quadrant C Data is divided into 100 sec bins |
 |
 |
| Module-wise count rates for Quadrant D Data is divided into 100 sec bins |
 |
 |
| Parameter | Plot |
|---|---|
| CZT HV Monitor | 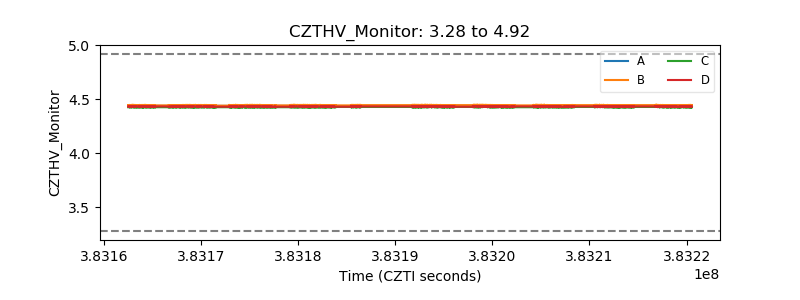 |
| D_VDD | 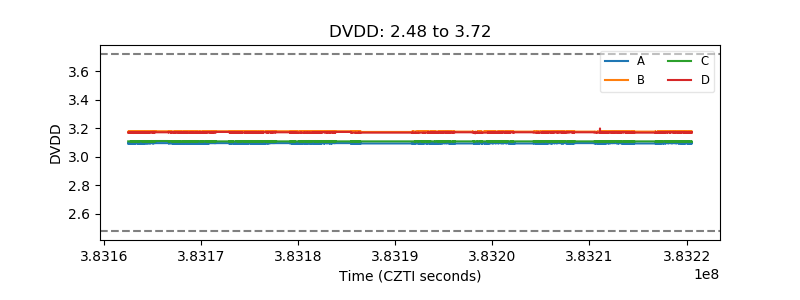 |
| Temperature 1 | 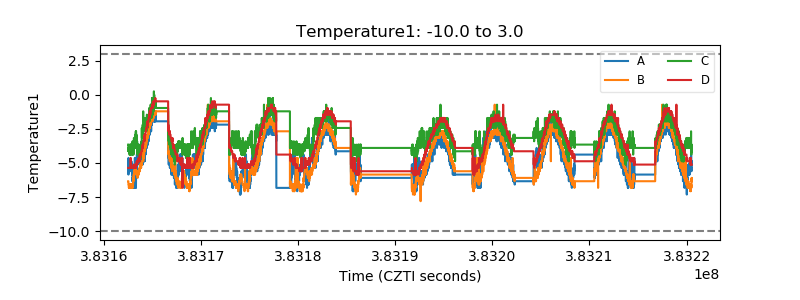 |
| Veto HV Monitor | 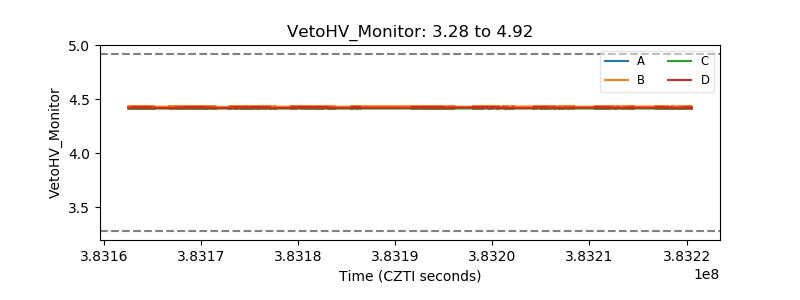 |
| Veto LLD | 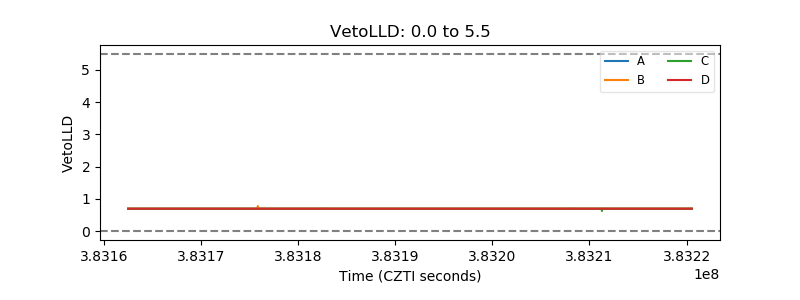 |
| Alpha Counter | 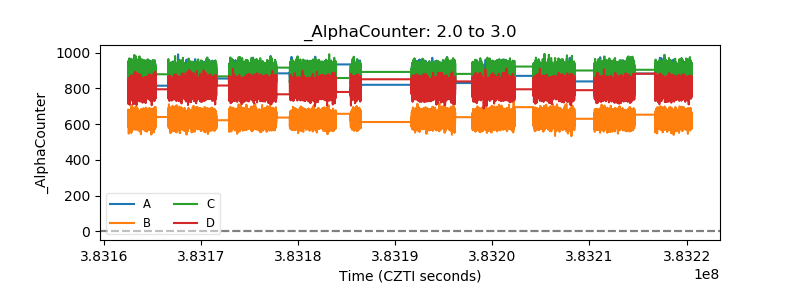 |
| _CPM_Rate | 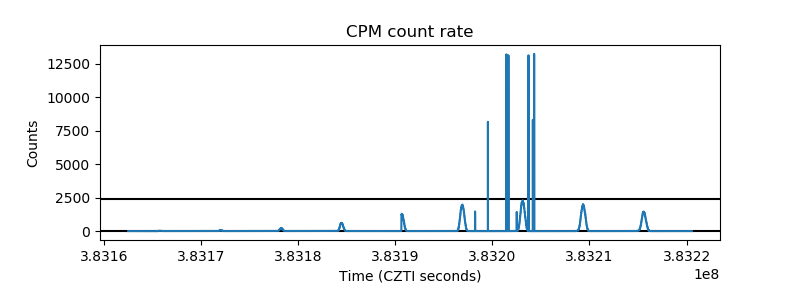 |
| CZT Counter | 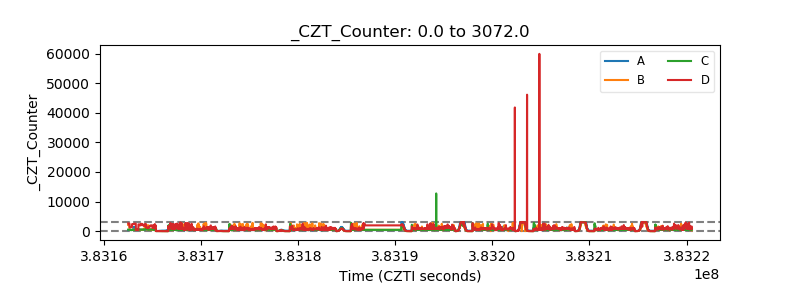 |
| +2.5 Volts monitor | 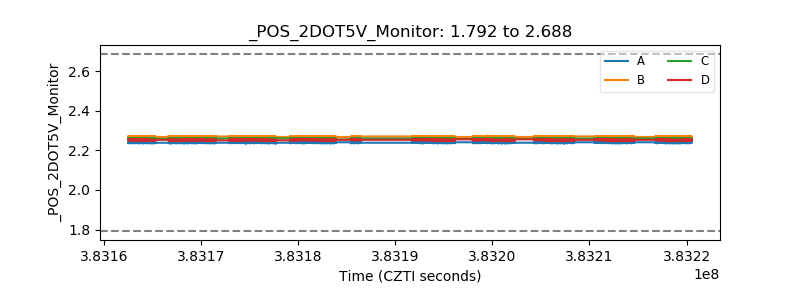 |
| +5 Volts monitor | 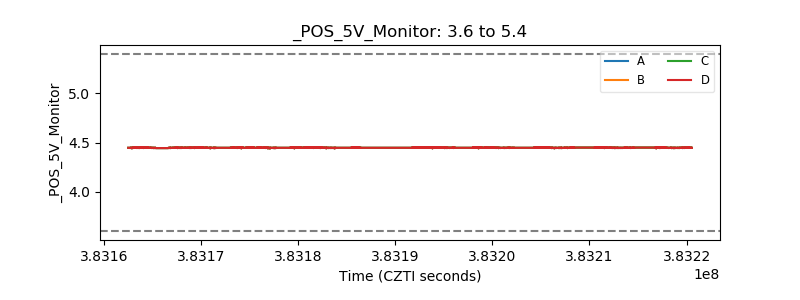 |
| _ROLL_ROT | 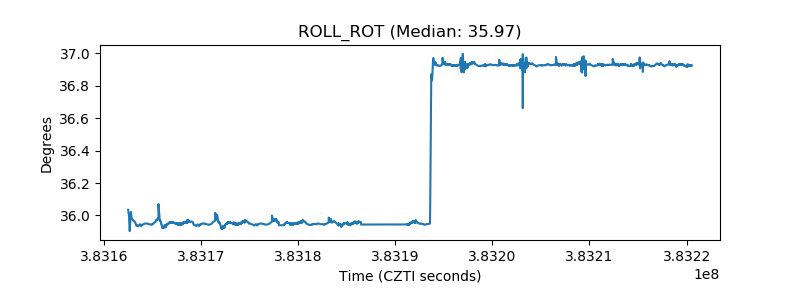 |
| _Roll_DEC | 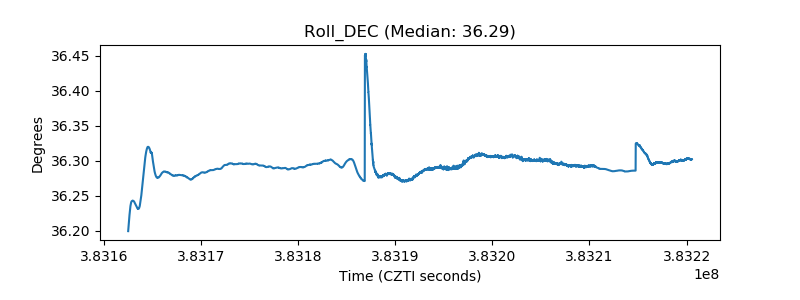 |
| _Roll_RA | 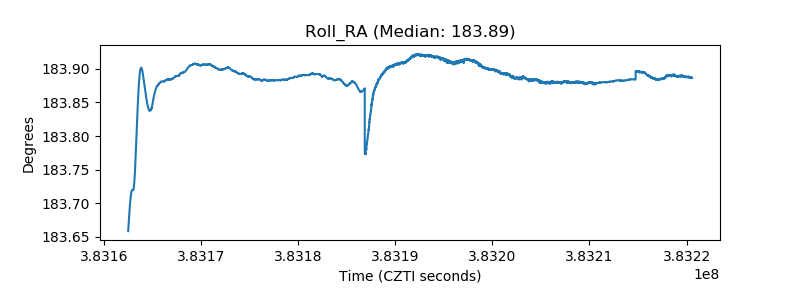 |
| Veto Counter | 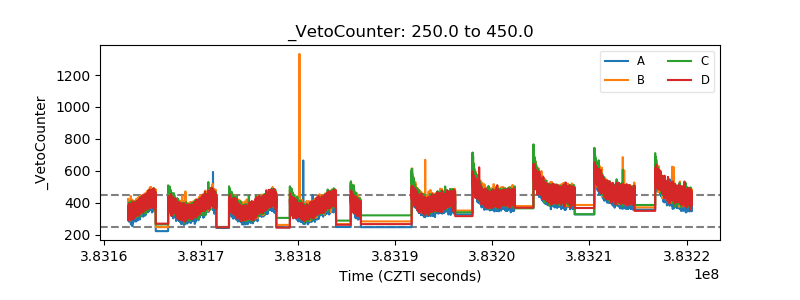 |