| Param | Original file | Final file |
|---|---|---|
| Filename | modeM0/AS1A11_046T09_9000004952_34616cztM0_level2.evt | modeM0/AS1A11_046T09_9000004952_34616cztM0_level2_quad_clean.evt |
| Size (bytes) | 156,896,640 | 29,194,560 |
| Size | 149.6 MB | 27.8 MB |
| Events in quadrant A | 876,299 | 195,552 |
| Events in quadrant B | 1,362,079 | 186,192 |
| Events in quadrant C | 945,435 | 191,684 |
| Events in quadrant D | 1,447,814 | 183,142 |
| Mode SS | |||
|---|---|---|---|
| Quadrant | BADHDUFLAG | Total packets | Discarded packets |
| A | 0 | 34 | 0 |
| B | 0 | 34 | 0 |
| C | 0 | 34 | 0 |
| D | 0 | 34 | 0 |
| Mode M9 | |||
|---|---|---|---|
| Quadrant | BADHDUFLAG | Total packets | Discarded packets |
| A | 0 | 10 | 0 |
| B | 0 | 10 | 0 |
| C | 0 | 10 | 0 |
| D | 0 | 11 | 0 |
| Mode M0 | |||
|---|---|---|---|
| Quadrant | BADHDUFLAG | Total packets | Discarded packets |
| A | 0 | 3793 | 1 |
| B | 0 | 5195 | 1 |
| C | 0 | 3820 | 1 |
| D | 0 | 5470 | 1 |
| Quadrant | Total seconds | Saturated seconds | Saturation percentage |
|---|---|---|---|
| A | 1733 | 14 | 0.807848% |
| B | 1733 | 174 | 10.040392% |
| C | 1733 | 41 | 2.365840% |
| D | 1733 | 58 | 3.346797% |
Noise dominated data is calculated using 1-second bins in cleaned event files. If a bin has >2000 counts, and if more than 50% of those come from <1% of pixels, then it is considered to be noise-dominated and hence unusable.
| Quadrant | # 1 sec bins | Bins with >0 counts | Bins with >2000 counts | High rate bins dominated by noise | Noise dominated (total time) | Noise dominated (detector-on time) | Marked lightcurve |
|---|---|---|---|---|---|---|---|
| A | 1733 | 1733 | 11 | 11 | 0.63% | 0.63% | 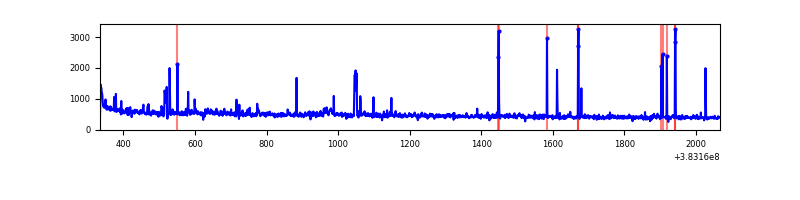 |
| B | 1733 | 1733 | 118 | 118 | 6.81% | 6.81% | 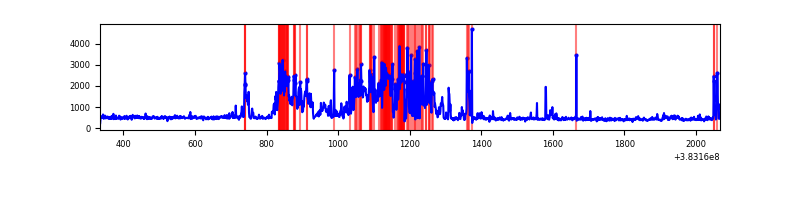 |
| C | 1733 | 1733 | 27 | 27 | 1.56% | 1.56% | 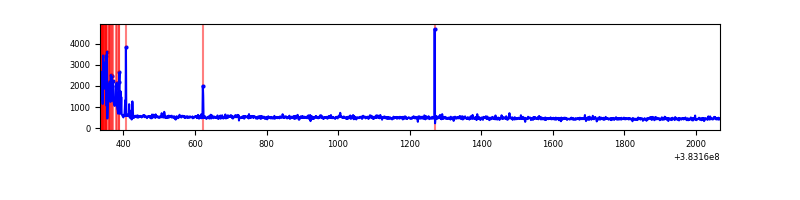 |
| D | 1733 | 1733 | 50 | 50 | 2.89% | 2.89% | 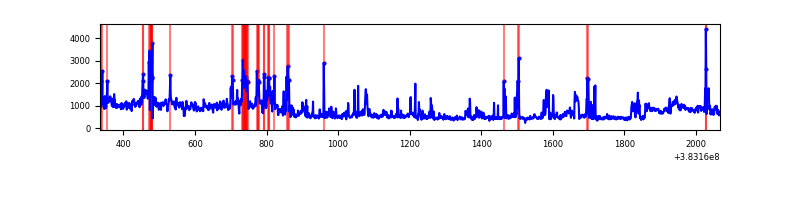 |
Top three noisy pixels from each quadrant. If the there are fewer than three noisy pixels in the level2.evt file, extra rows are filled as -1
| Pixel properties | Quadrant properties | ||||||
|---|---|---|---|---|---|---|---|
| Quadrant | DetID | PixID | Counts | Sigma | Mean | Median | Sigma |
| A | 15 | 169 | 80377 | 1928.53 | 196 | 192 | 41.6 |
| A | 10 | 83 | 21457 | 511.44 | 196 | 192 | 41.6 |
| A | 9 | 143 | 6667 | 155.73 | 196 | 192 | 41.6 |
| B | 5 | 172 | 547274 | 14017.45 | 191 | 187 | 39.0 |
| B | 4 | 232 | 29970 | 763.1 | 191 | 187 | 39.0 |
| B | 5 | 255 | 17005 | 430.91 | 191 | 187 | 39.0 |
| C | 0 | 10 | 90979 | 1947.44 | 193 | 195 | 46.6 |
| C | 15 | 214 | 74024 | 1583.74 | 193 | 195 | 46.6 |
| C | 0 | 207 | 15498 | 328.27 | 193 | 195 | 46.6 |
| D | 8 | 195 | 335815 | 6692.11 | 191 | 186 | 50.2 |
| D | 10 | 230 | 85337 | 1697.83 | 191 | 186 | 50.2 |
| D | 2 | 250 | 60714 | 1206.87 | 191 | 186 | 50.2 |
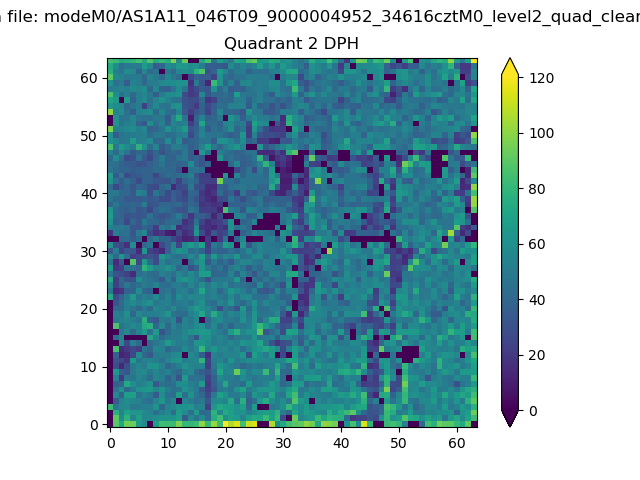
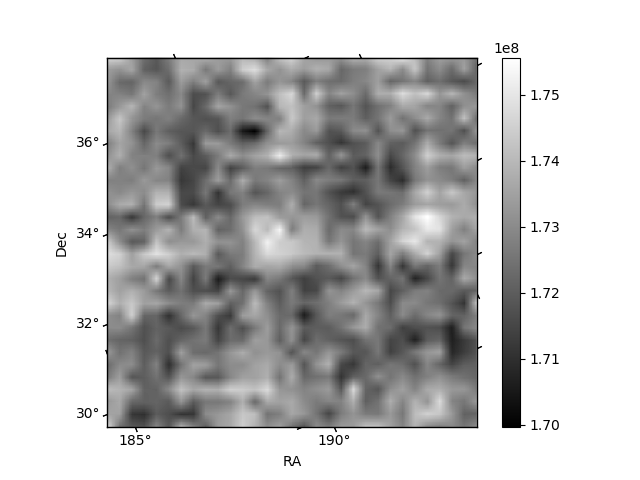
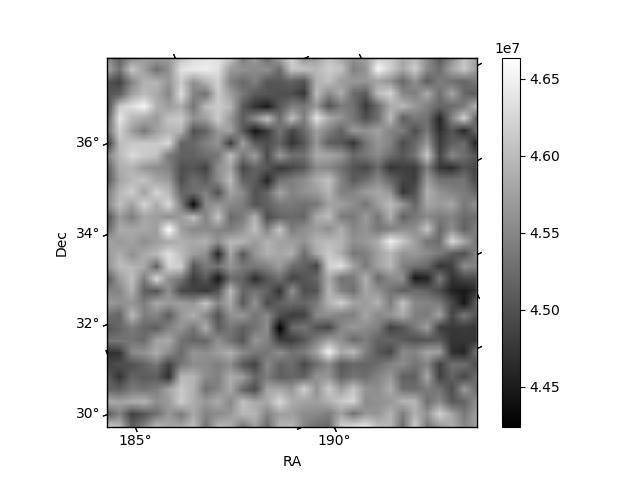
Histogram calculated using DETX and DETY for each event in the final _common_clean file
| Quadrant A | 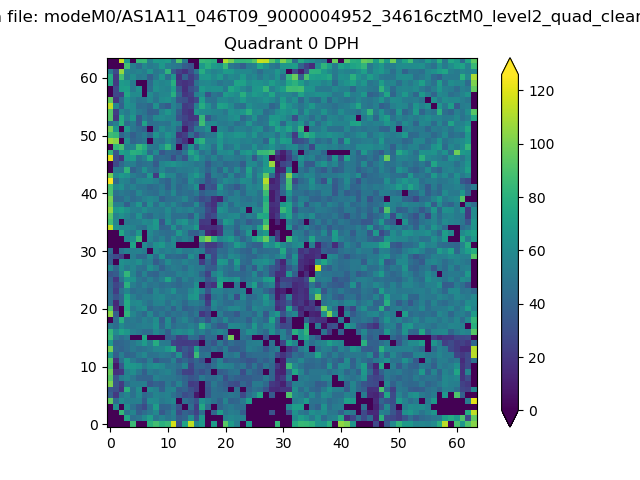 |
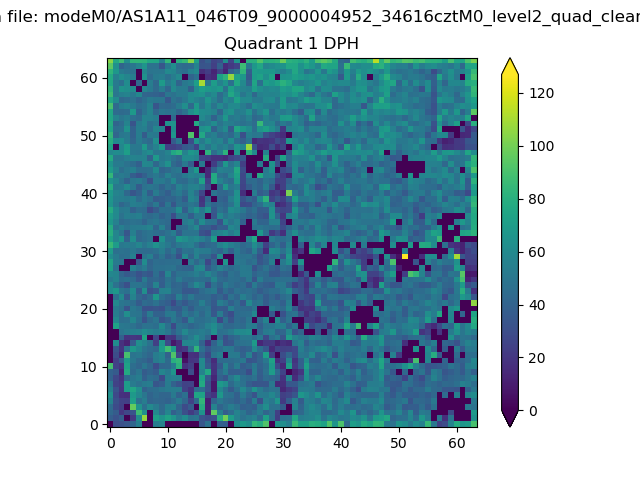 |
Quadrant B |
|---|---|---|---|
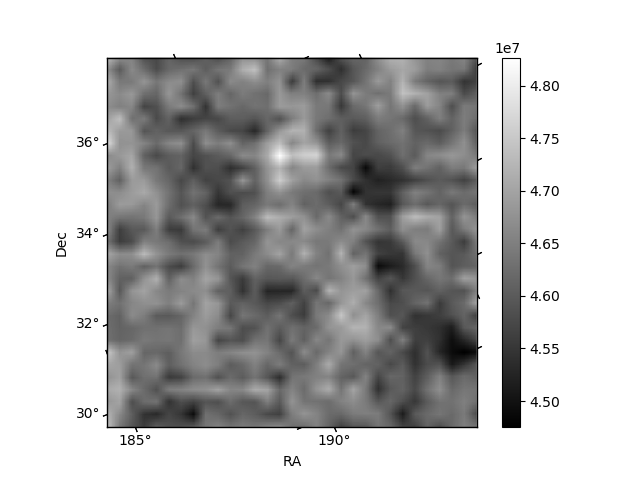
| Quadrant D | 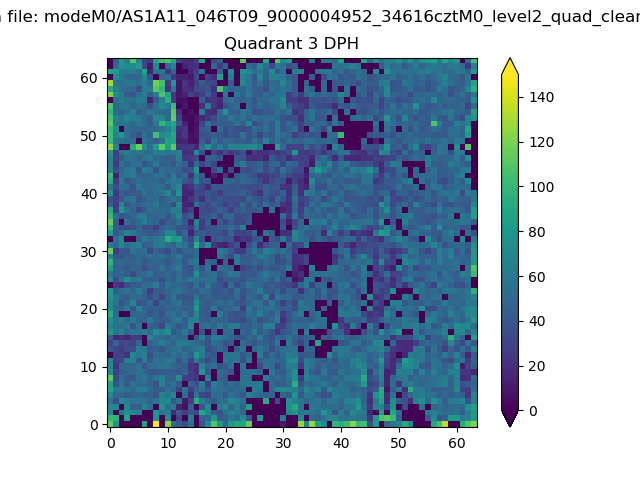 |
 |
Quadrant C |
| Plot type | Count rate plots | Images |
|---|---|---|
| Comparison with Poisson distribution Blue bars denote a histogram of data divided into 1 sec bins. Red curve is a Poisson curve with rate = median count rate of data. |
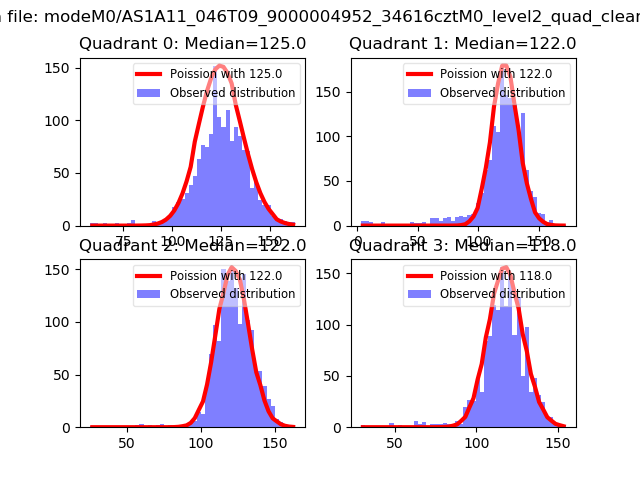 |
 |
| Quadrant-wise count rates Data is divided into 100 sec bins |
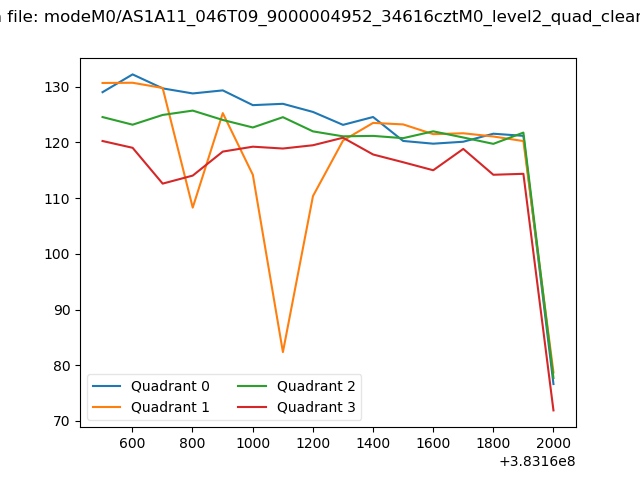 |
|
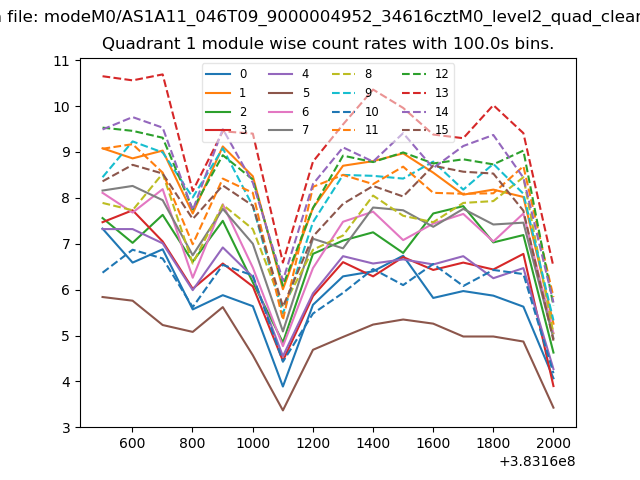
| Module-wise count rates for Quadrant A Data is divided into 100 sec bins |
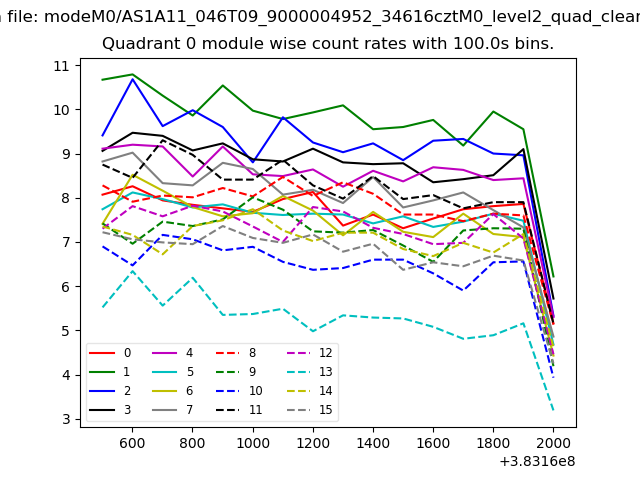 |
 |
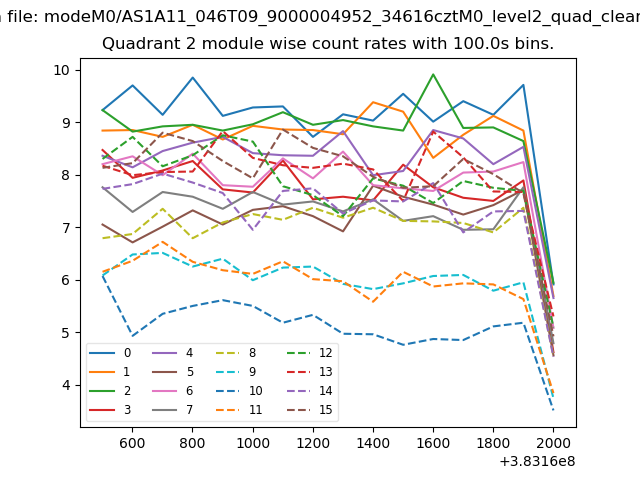
| Module-wise count rates for Quadrant B Data is divided into 100 sec bins |
 |
 |
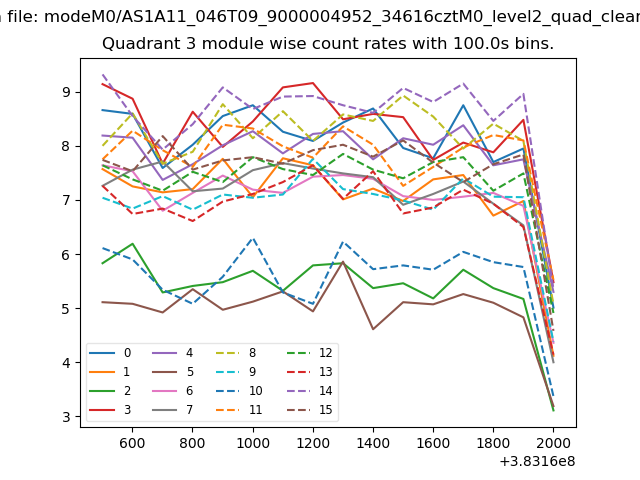
| Module-wise count rates for Quadrant C Data is divided into 100 sec bins |
 |
 |
| Module-wise count rates for Quadrant D Data is divided into 100 sec bins |
 |
 |
| Parameter | Plot |
|---|---|
| CZT HV Monitor |  |
| D_VDD | 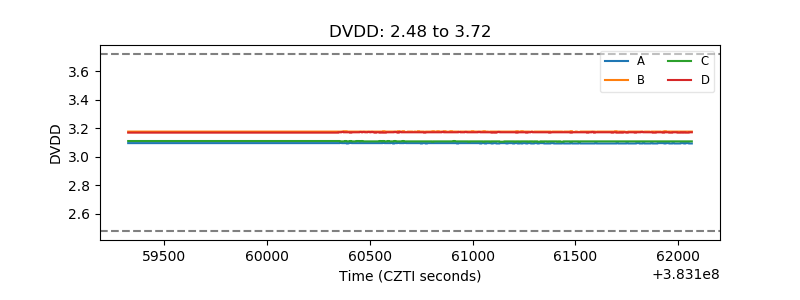 |
| Temperature 1 | 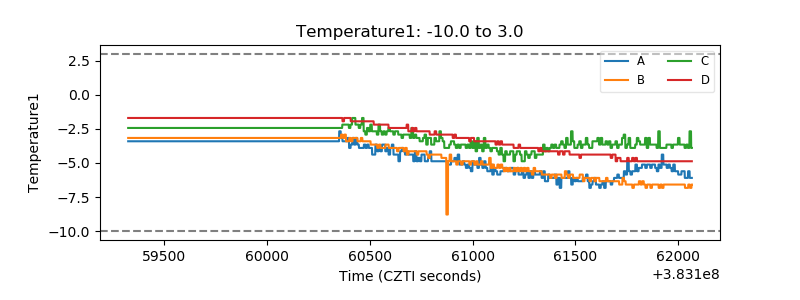 |
| Veto HV Monitor | 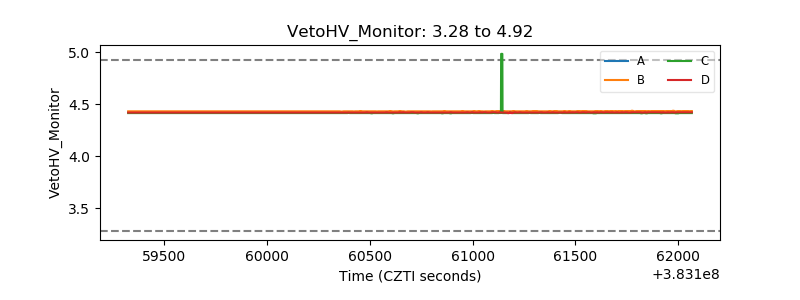 |
| Veto LLD | 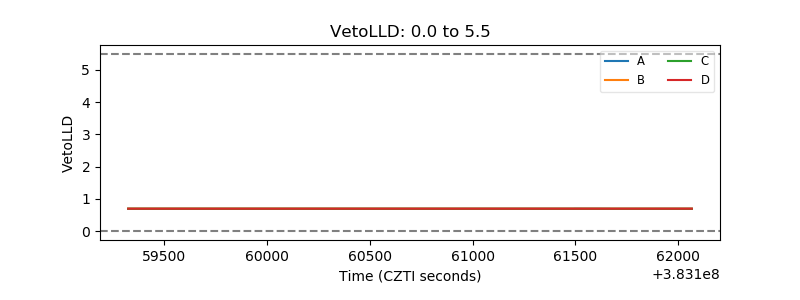 |
| Alpha Counter | 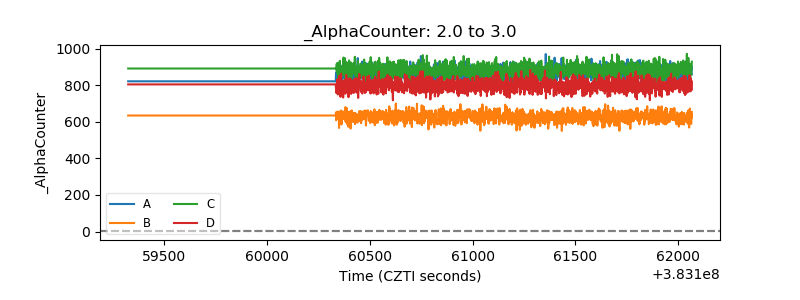 |
| _CPM_Rate | 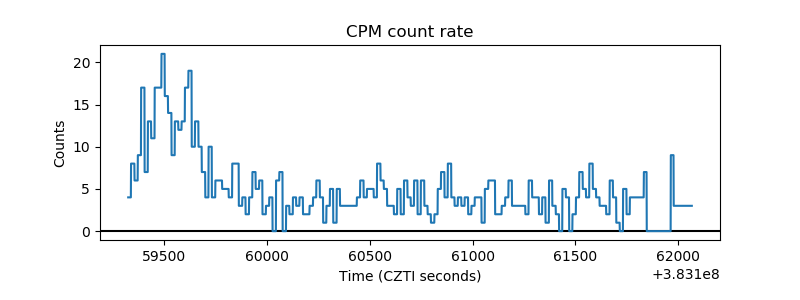 |
| CZT Counter | 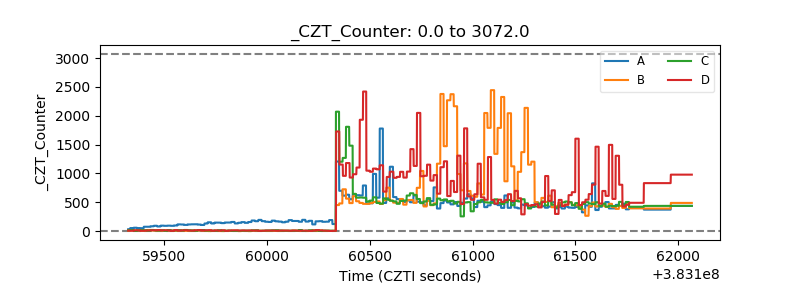 |
| +2.5 Volts monitor | 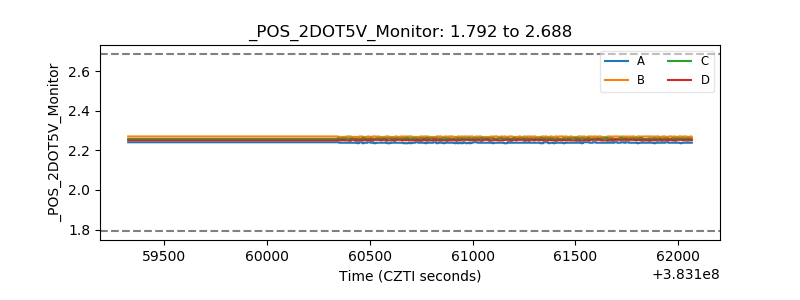 |
| +5 Volts monitor | 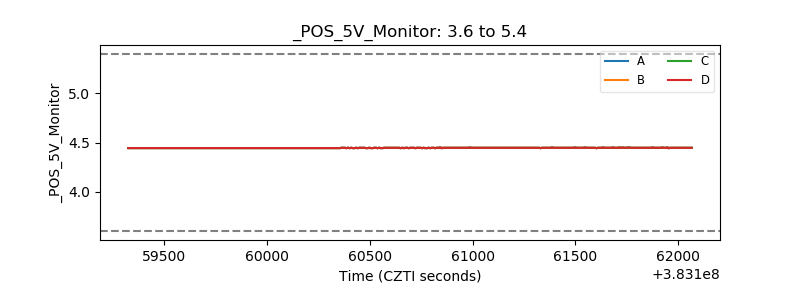 |
| _ROLL_ROT | 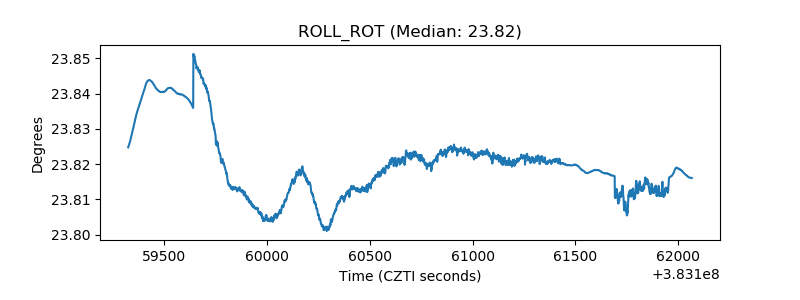 |
| _Roll_DEC | 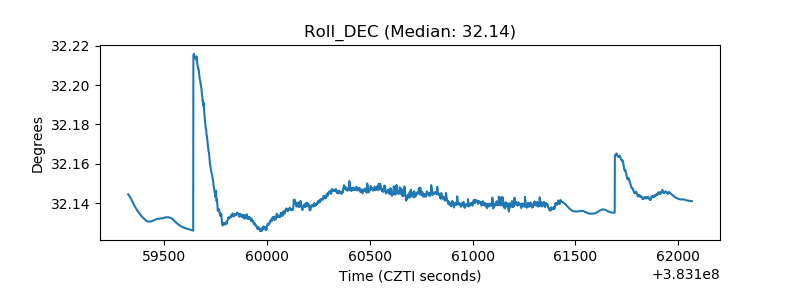 |
| _Roll_RA |  |
| Veto Counter | 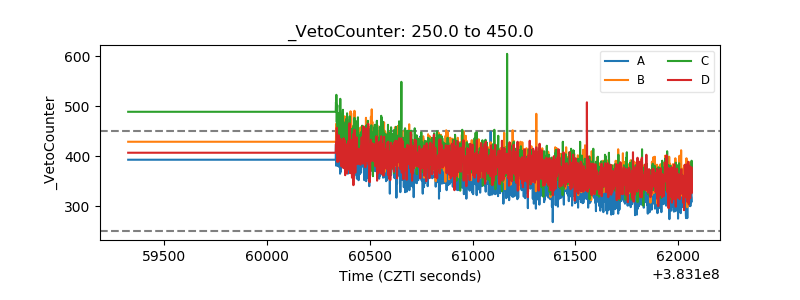 |