| Param | Original file | Final file |
|---|---|---|
| Filename | modeM0/AS1A11_046T09_9000004952_34610cztM0_level2.evt | modeM0/AS1A11_046T09_9000004952_34610cztM0_level2_quad_clean.evt |
| Size (bytes) | 148,193,280 | 16,401,600 |
| Size | 141.3 MB | 15.6 MB |
| Events in quadrant A | 826,117 | 100,255 |
| Events in quadrant B | 1,167,171 | 98,914 |
| Events in quadrant C | 885,212 | 97,321 |
| Events in quadrant D | 1,507,018 | 89,950 |
| Mode SS | |||
|---|---|---|---|
| Quadrant | BADHDUFLAG | Total packets | Discarded packets |
| A | 0 | 30 | 0 |
| B | 0 | 30 | 0 |
| C | 0 | 30 | 0 |
| D | 0 | 30 | 0 |
| Mode M9 | |||
|---|---|---|---|
| Quadrant | BADHDUFLAG | Total packets | Discarded packets |
| A | 0 | 21 | 0 |
| B | 0 | 21 | 0 |
| C | 0 | 21 | 0 |
| D | 0 | 21 | 0 |
| Mode M0 | |||
|---|---|---|---|
| Quadrant | BADHDUFLAG | Total packets | Discarded packets |
| A | 0 | 3303 | 2 |
| B | 0 | 4400 | 1 |
| C | 0 | 3484 | 1 |
| D | 0 | 5532 | 1 |
| Quadrant | Total seconds | Saturated seconds | Saturation percentage |
|---|---|---|---|
| A | 1482 | 8 | 0.539811% |
| B | 1482 | 123 | 8.299595% |
| C | 1482 | 19 | 1.282051% |
| D | 1482 | 74 | 4.993252% |
Noise dominated data is calculated using 1-second bins in cleaned event files. If a bin has >2000 counts, and if more than 50% of those come from <1% of pixels, then it is considered to be noise-dominated and hence unusable.
| Quadrant | # 1 sec bins | Bins with >0 counts | Bins with >2000 counts | High rate bins dominated by noise | Noise dominated (total time) | Noise dominated (detector-on time) | Marked lightcurve |
|---|---|---|---|---|---|---|---|
| A | 3545 | 1483 | 2 | 2 | 0.06% | 0.13% | 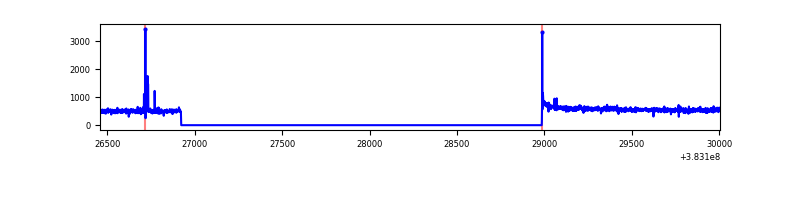 |
| B | 3545 | 1482 | 81 | 81 | 2.28% | 5.47% | 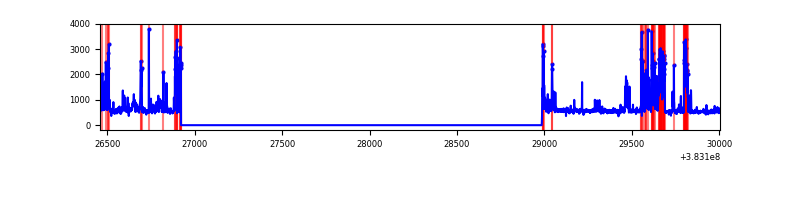 |
| C | 3545 | 1483 | 10 | 10 | 0.28% | 0.67% | 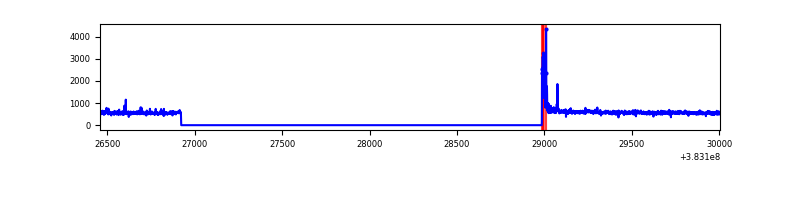 |
| D | 3545 | 1483 | 72 | 72 | 2.03% | 4.86% | 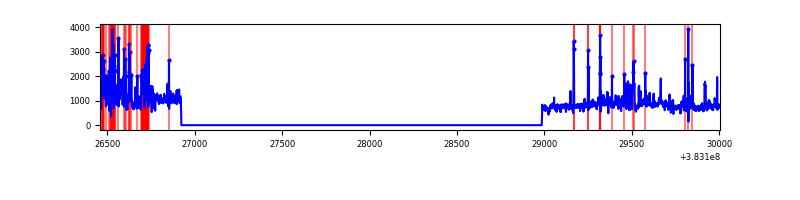 |
Top three noisy pixels from each quadrant. If the there are fewer than three noisy pixels in the level2.evt file, extra rows are filled as -1
| Pixel properties | Quadrant properties | ||||||
|---|---|---|---|---|---|---|---|
| Quadrant | DetID | PixID | Counts | Sigma | Mean | Median | Sigma |
| A | 10 | 83 | 18924 | 445.84 | 204 | 201 | 42.0 |
| A | 9 | 143 | 13036 | 305.63 | 204 | 201 | 42.0 |
| A | 15 | 169 | 3542 | 79.56 | 204 | 201 | 42.0 |
| B | 5 | 172 | 345846 | 8970.88 | 195 | 191 | 38.5 |
| B | 4 | 232 | 36708 | 947.74 | 195 | 191 | 38.5 |
| B | 10 | 245 | 4941 | 123.28 | 195 | 191 | 38.5 |
| C | 15 | 214 | 64871 | 1418.85 | 193 | 195 | 45.6 |
| C | 0 | 10 | 49638 | 1084.67 | 193 | 195 | 45.6 |
| C | 14 | 67 | 10598 | 228.22 | 193 | 195 | 45.6 |
| D | 8 | 195 | 534648 | 11077.47 | 192 | 187 | 48.2 |
| D | 10 | 118 | 113506 | 2348.7 | 192 | 187 | 48.2 |
| D | 7 | 38 | 35977 | 741.8 | 192 | 187 | 48.2 |
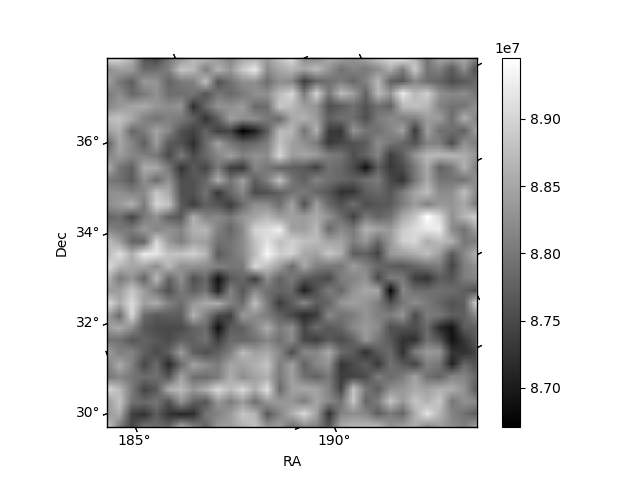
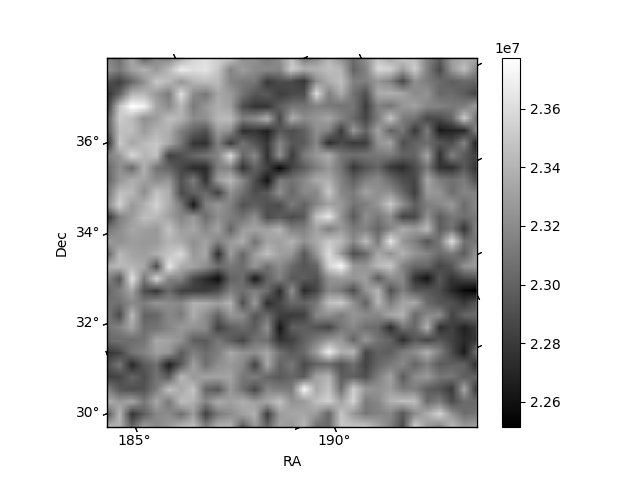
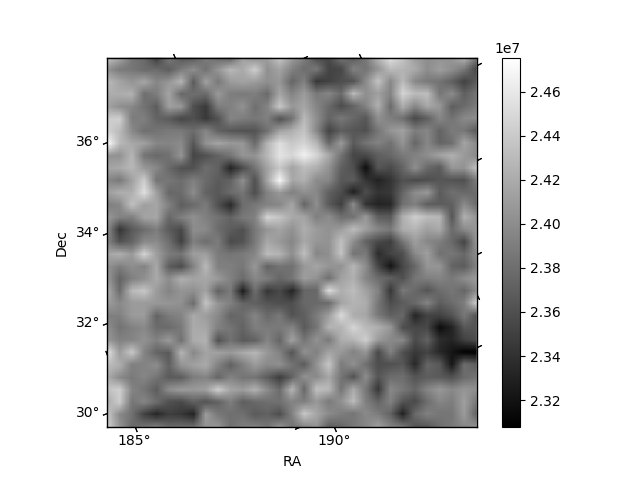
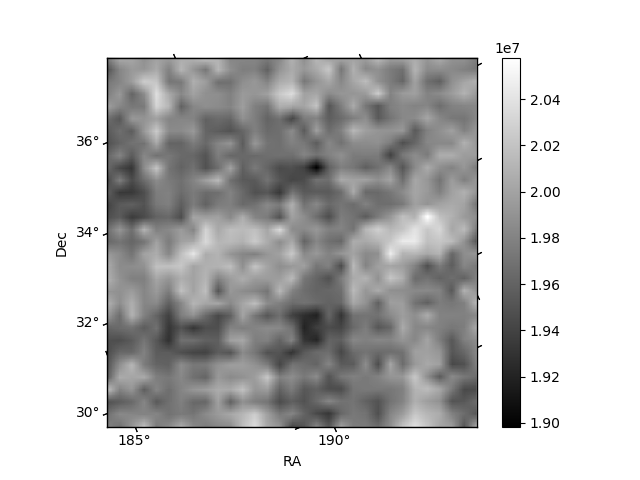
Histogram calculated using DETX and DETY for each event in the final _common_clean file
| Quadrant A | 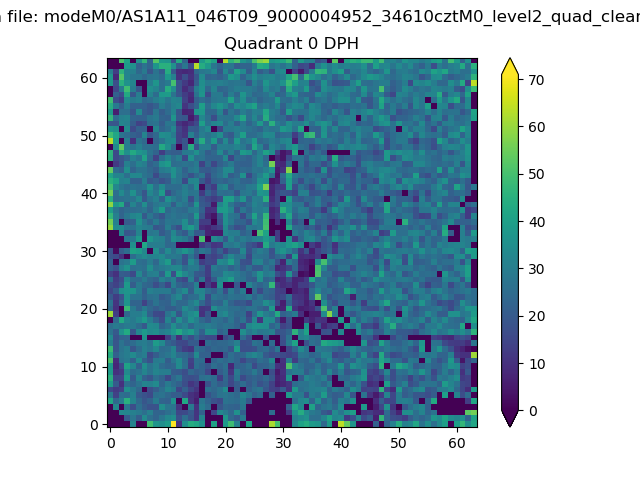 |
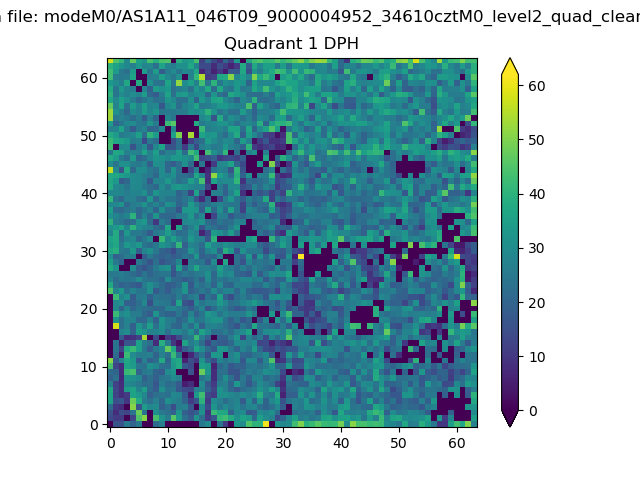 |
Quadrant B |
|---|---|---|---|
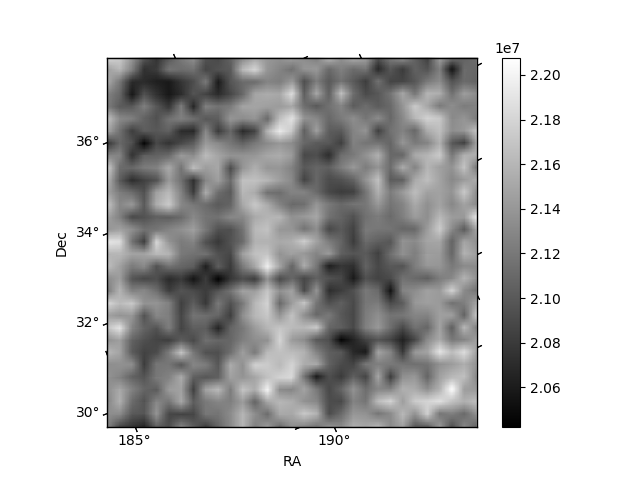
| Quadrant D | 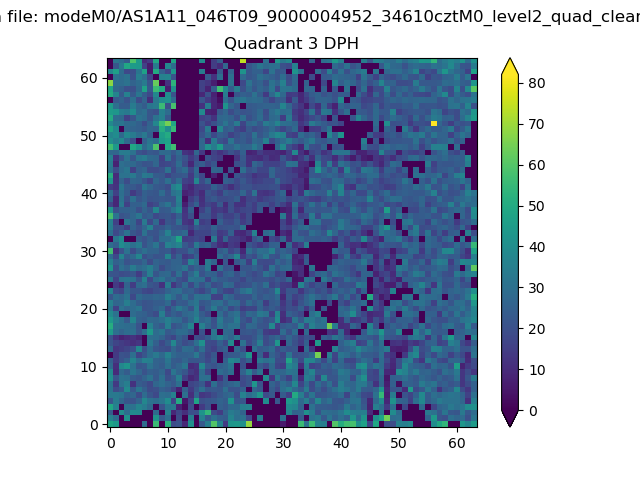 |
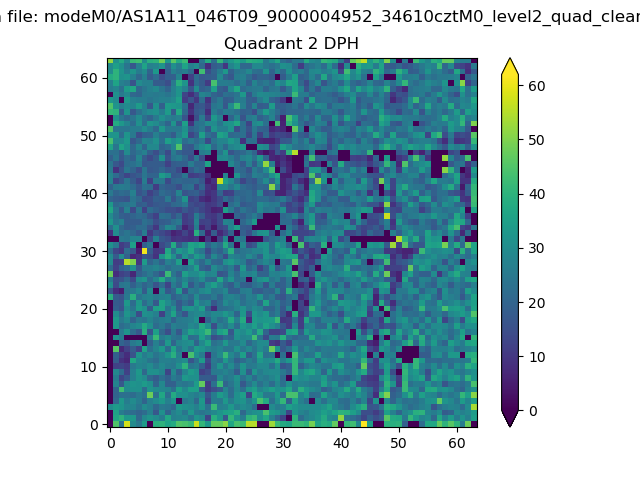 |
Quadrant C |
| Plot type | Count rate plots | Images |
|---|---|---|
| Comparison with Poisson distribution Blue bars denote a histogram of data divided into 1 sec bins. Red curve is a Poisson curve with rate = median count rate of data. |
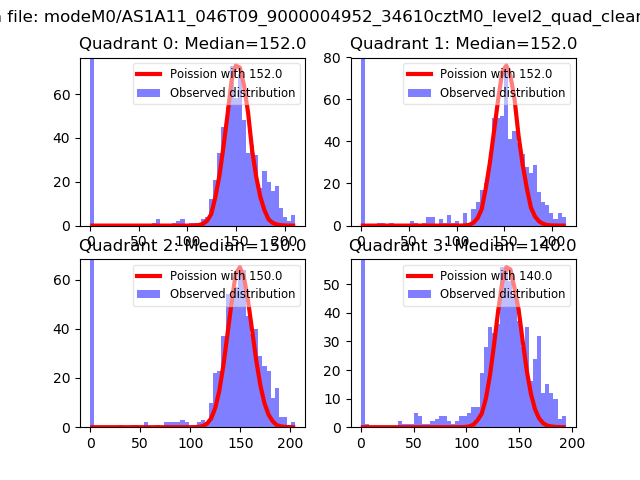 |
 |
| Quadrant-wise count rates Data is divided into 100 sec bins |
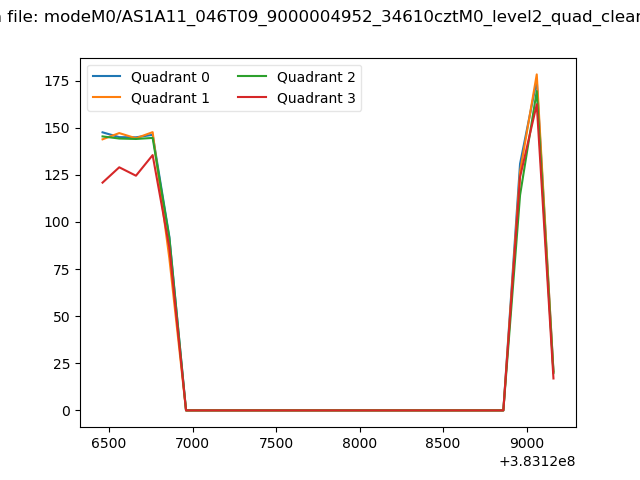 |
|
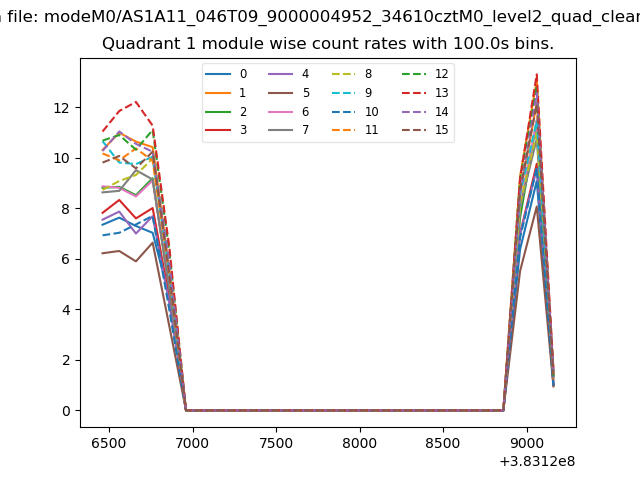
| Module-wise count rates for Quadrant A Data is divided into 100 sec bins |
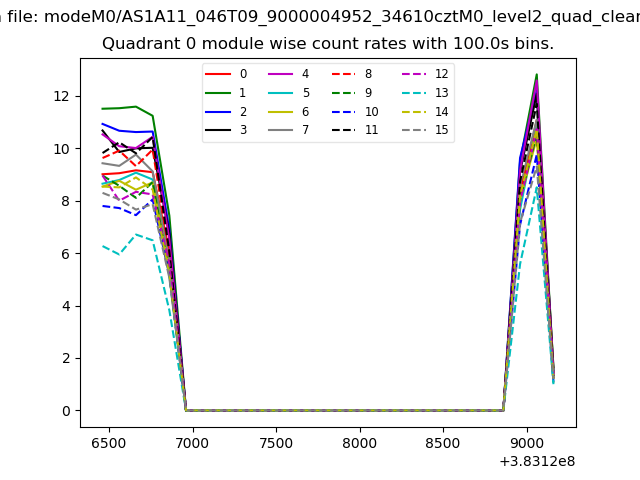 |
 |
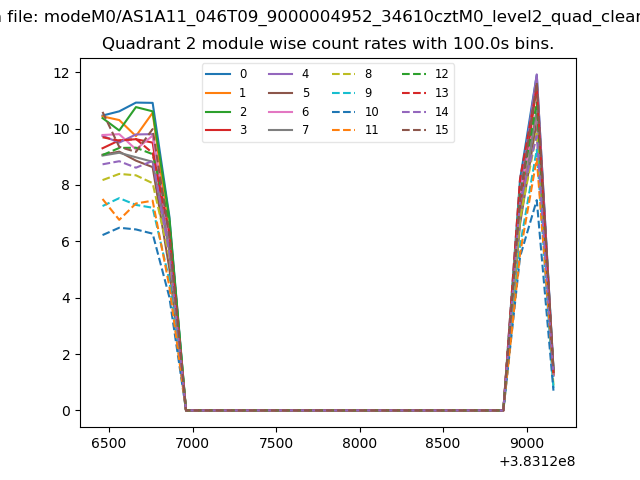
| Module-wise count rates for Quadrant B Data is divided into 100 sec bins |
 |
 |
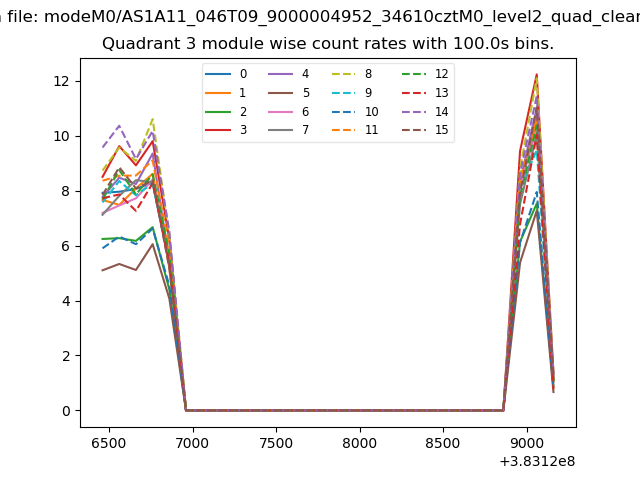
| Module-wise count rates for Quadrant C Data is divided into 100 sec bins |
 |
 |
| Module-wise count rates for Quadrant D Data is divided into 100 sec bins |
 |
 |
| Parameter | Plot |
|---|---|
| CZT HV Monitor | 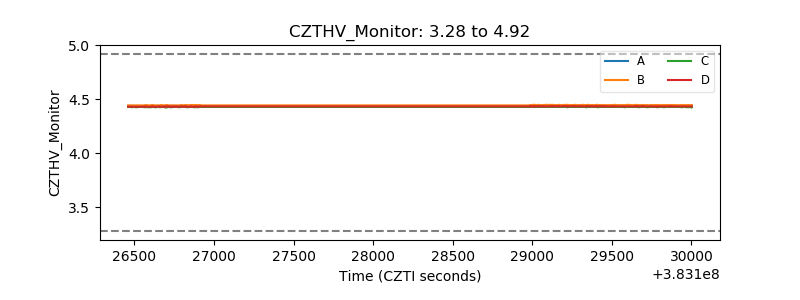 |
| D_VDD | 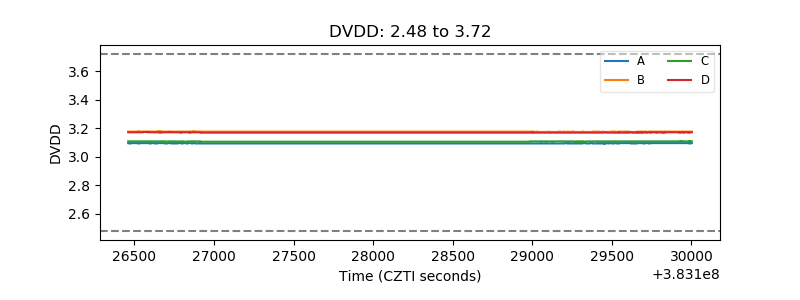 |
| Temperature 1 | 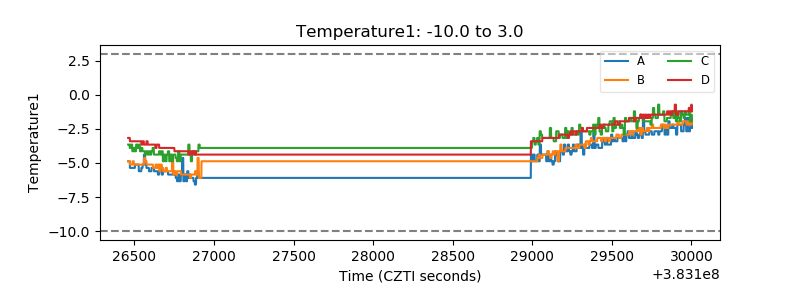 |
| Veto HV Monitor | 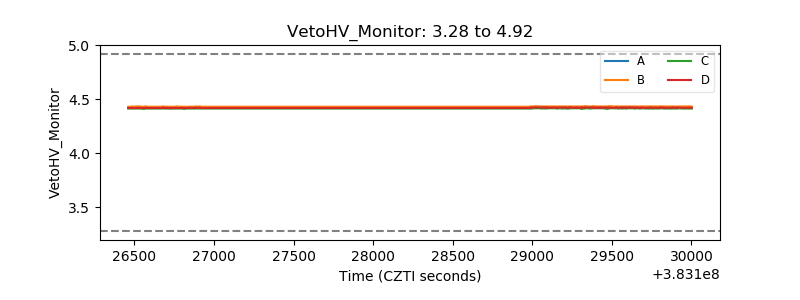 |
| Veto LLD | 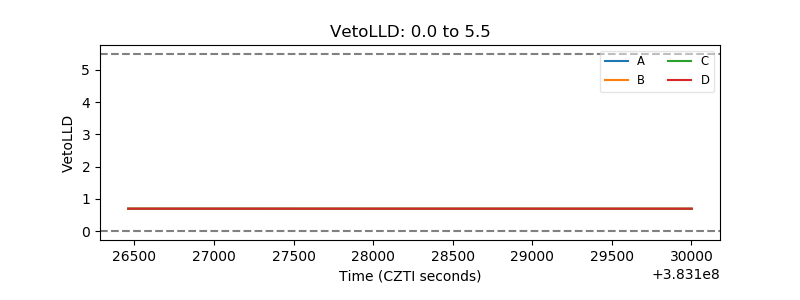 |
| Alpha Counter | 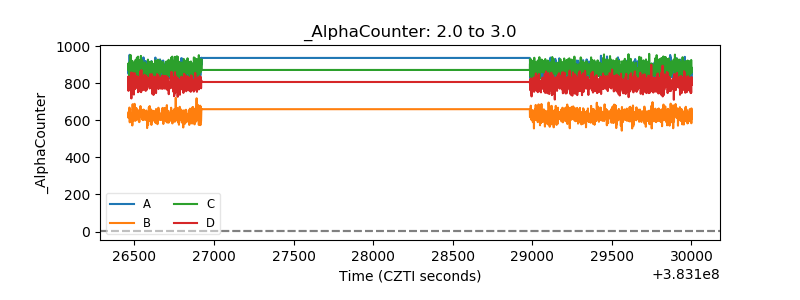 |
| _CPM_Rate | 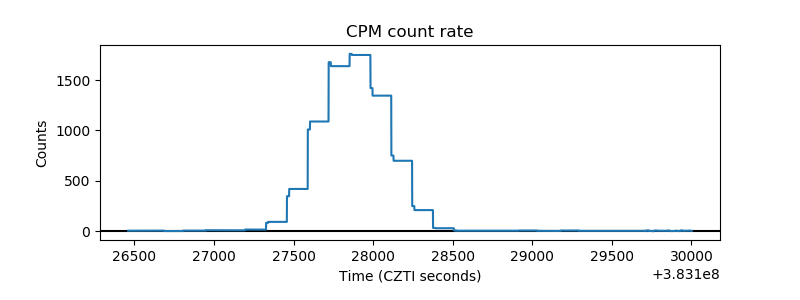 |
| CZT Counter | 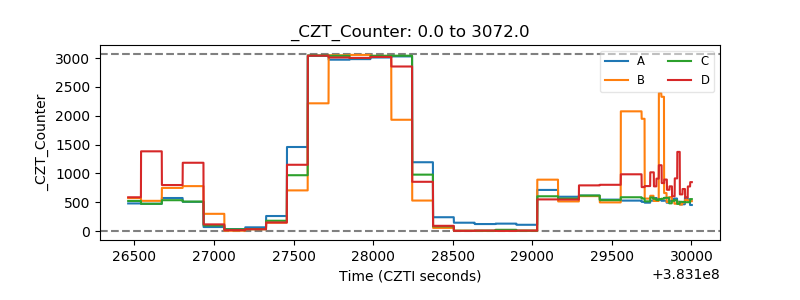 |
| +2.5 Volts monitor | 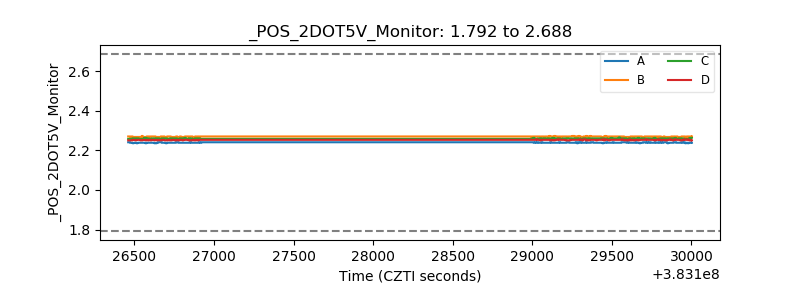 |
| +5 Volts monitor | 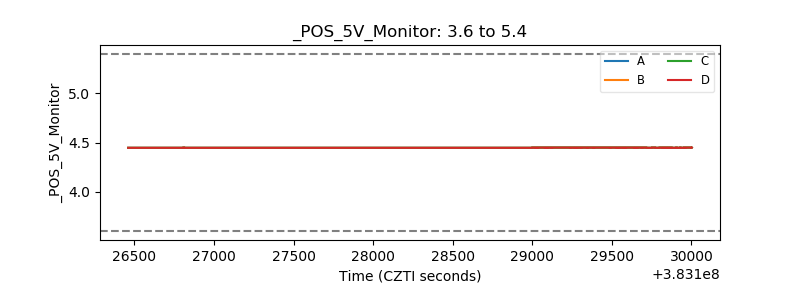 |
| _ROLL_ROT | 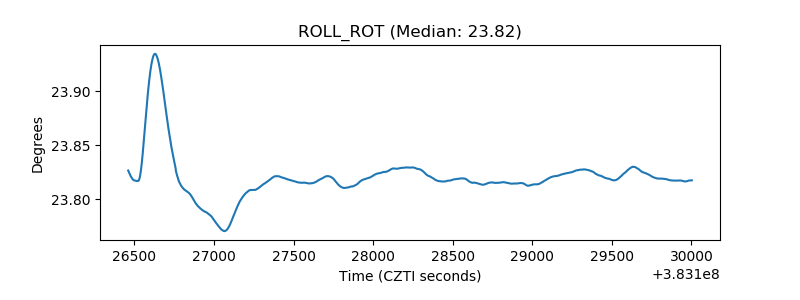 |
| _Roll_DEC | 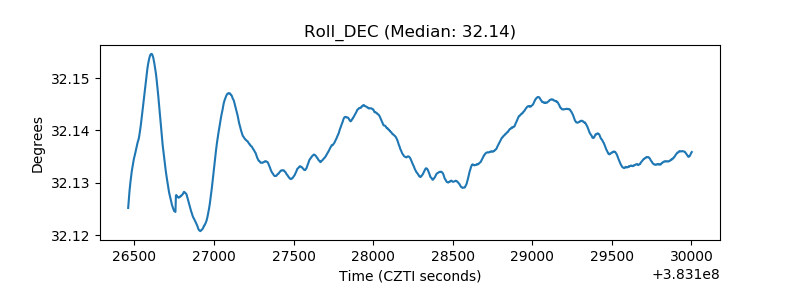 |
| _Roll_RA | 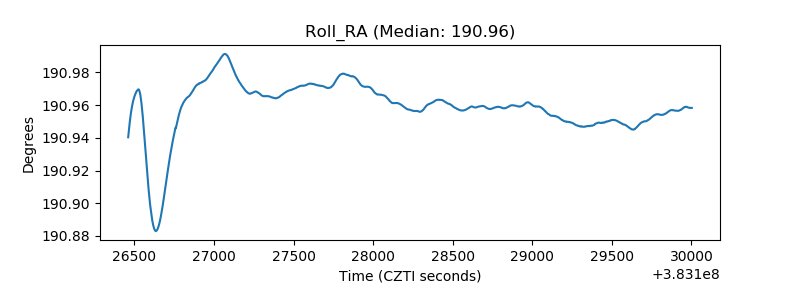 |
| Veto Counter | 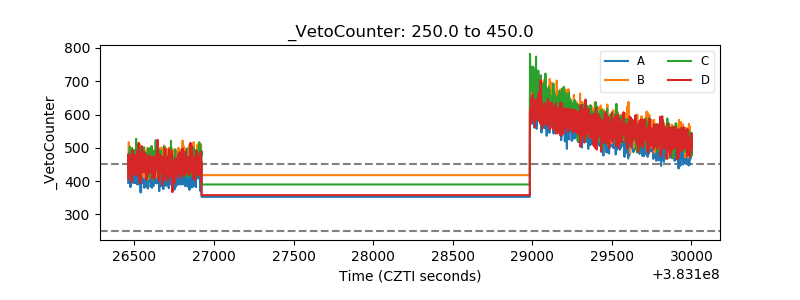 |