| Param | Original file | Final file |
|---|---|---|
| Filename | modeM0/AS1C07_014T01_9000004950_34604cztM0_level2.evt | modeM0/AS1C07_014T01_9000004950_34604cztM0_level2_quad_clean.evt |
| Size (bytes) | 1,537,891,200 | 187,899,840 |
| Size | 1.4 GB | 179.2 MB |
| Events in quadrant A | 7,909,935 | 1,203,492 |
| Events in quadrant B | 11,281,021 | 1,171,995 |
| Events in quadrant C | 8,330,034 | 1,190,671 |
| Events in quadrant D | 18,003,580 | 1,046,006 |
| Mode SS | |||
|---|---|---|---|
| Quadrant | BADHDUFLAG | Total packets | Discarded packets |
| A | 0 | 316 | 0 |
| B | 0 | 316 | 0 |
| C | 0 | 316 | 0 |
| D | 0 | 316 | 0 |
| Mode M9 | |||
|---|---|---|---|
| Quadrant | BADHDUFLAG | Total packets | Discarded packets |
| A | 0 | 44 | 0 |
| B | 0 | 44 | 0 |
| C | 0 | 44 | 0 |
| D | 0 | 45 | 0 |
| Mode M0 | |||
|---|---|---|---|
| Quadrant | BADHDUFLAG | Total packets | Discarded packets |
| A | 0 | 33703 | 4 |
| B | 0 | 43711 | 3 |
| C | 0 | 33992 | 3 |
| D | 0 | 64607 | 3 |
| Quadrant | Total seconds | Saturated seconds | Saturation percentage |
|---|---|---|---|
| A | 15628 | 197 | 1.260558% |
| B | 15628 | 1136 | 7.269004% |
| C | 15628 | 123 | 0.787049% |
| D | 15628 | 1557 | 9.962887% |
Noise dominated data is calculated using 1-second bins in cleaned event files. If a bin has >2000 counts, and if more than 50% of those come from <1% of pixels, then it is considered to be noise-dominated and hence unusable.
| Quadrant | # 1 sec bins | Bins with >0 counts | Bins with >2000 counts | High rate bins dominated by noise | Noise dominated (total time) | Noise dominated (detector-on time) | Marked lightcurve |
|---|---|---|---|---|---|---|---|
| A | 19806 | 15631 | 152 | 152 | 0.77% | 0.97% | 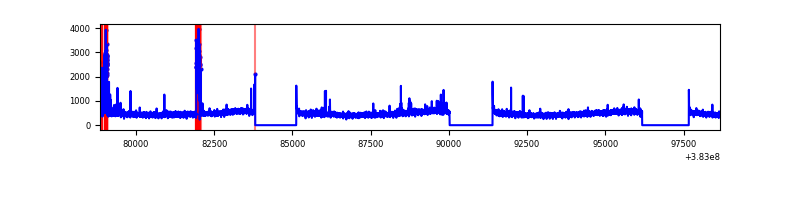 |
| B | 19806 | 15631 | 764 | 764 | 3.86% | 4.89% | 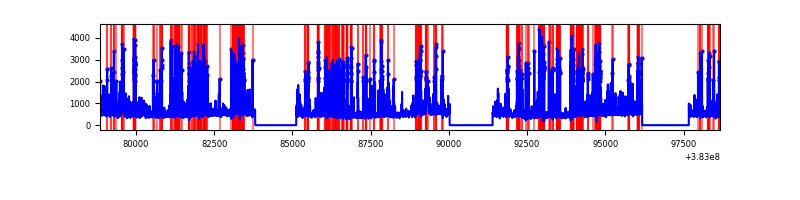 |
| C | 19806 | 15631 | 80 | 80 | 0.40% | 0.51% | 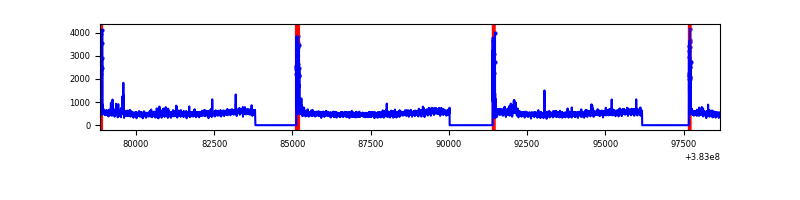 |
| D | 19806 | 15631 | 1411 | 1411 | 7.12% | 9.03% | 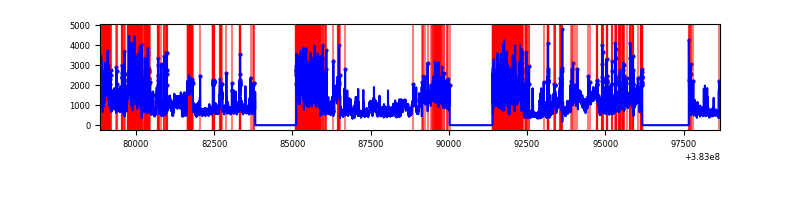 |
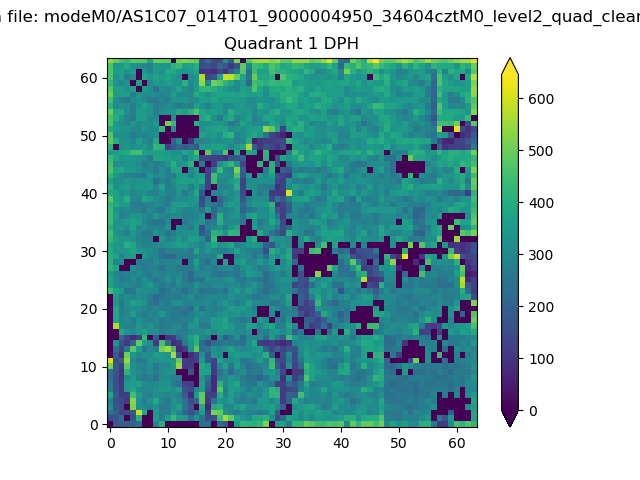
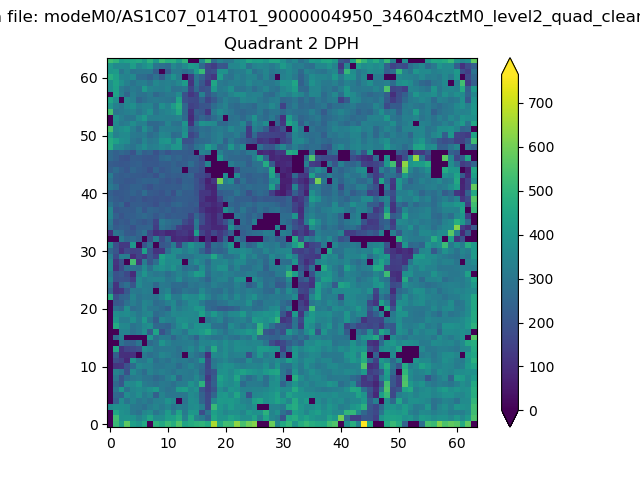
Top three noisy pixels from each quadrant. If the there are fewer than three noisy pixels in the level2.evt file, extra rows are filled as -1
| Pixel properties | Quadrant properties | ||||||
|---|---|---|---|---|---|---|---|
| Quadrant | DetID | PixID | Counts | Sigma | Mean | Median | Sigma |
| A | 15 | 169 | 480143 | 1269.62 | 1867 | 1833 | 376.7 |
| A | 10 | 83 | 100525 | 261.97 | 1867 | 1833 | 376.7 |
| A | 9 | 143 | 44284 | 112.68 | 1867 | 1833 | 376.7 |
| B | 5 | 172 | 2947133 | 8526.5 | 1812 | 1768 | 345.4 |
| B | 0 | 189 | 491434 | 1417.53 | 1812 | 1768 | 345.4 |
| B | 4 | 171 | 251173 | 722.0 | 1812 | 1768 | 345.4 |
| C | 15 | 214 | 644238 | 1523.38 | 1817 | 1837 | 421.7 |
| C | 0 | 10 | 351411 | 828.97 | 1817 | 1837 | 421.7 |
| C | 14 | 67 | 139304 | 325.99 | 1817 | 1837 | 421.7 |
| D | 8 | 195 | 7265307 | 15260.84 | 1749 | 1720 | 476.0 |
| D | 7 | 223 | 974532 | 2043.88 | 1749 | 1720 | 476.0 |
| D | 7 | 38 | 924824 | 1939.45 | 1749 | 1720 | 476.0 |
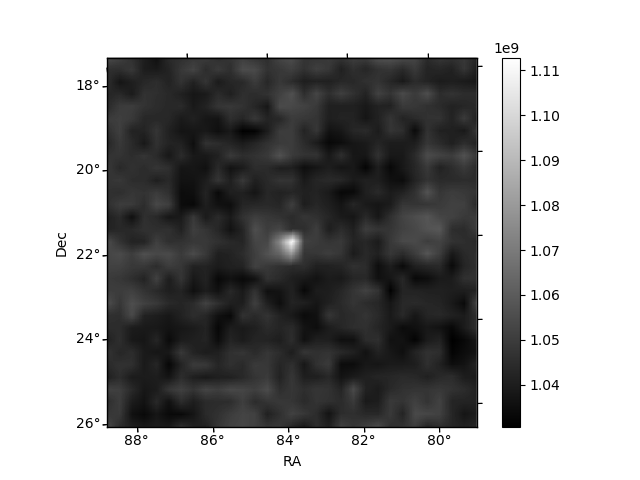
Histogram calculated using DETX and DETY for each event in the final _common_clean file
| Quadrant A | 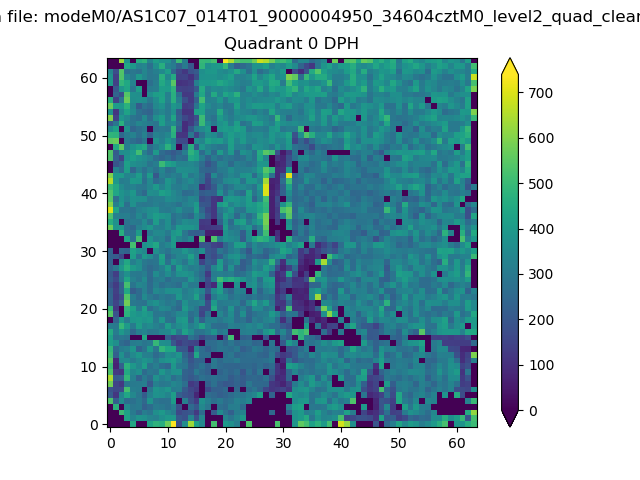 |
 |
Quadrant B |
|---|---|---|---|
| Quadrant D | 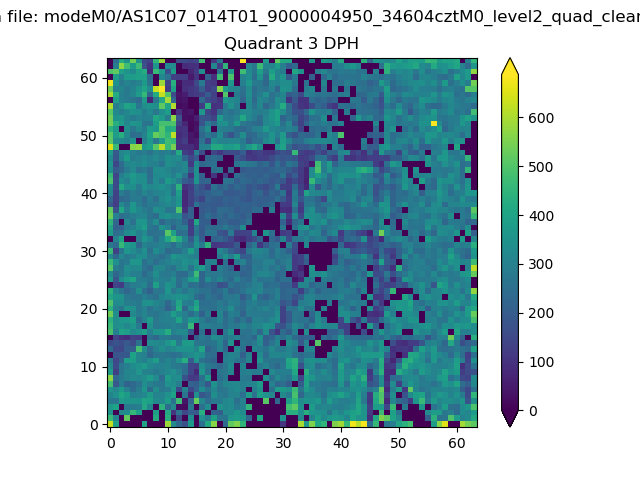 |
 |
Quadrant C |
| Plot type | Count rate plots | Images |
|---|---|---|
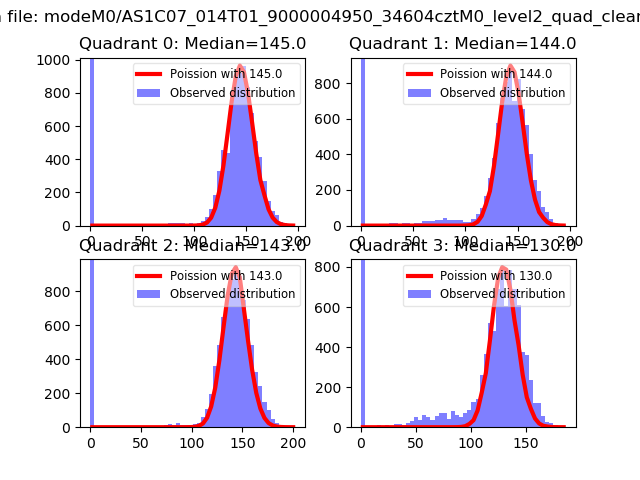
| Comparison with Poisson distribution Blue bars denote a histogram of data divided into 1 sec bins. Red curve is a Poisson curve with rate = median count rate of data. |
 |
 |
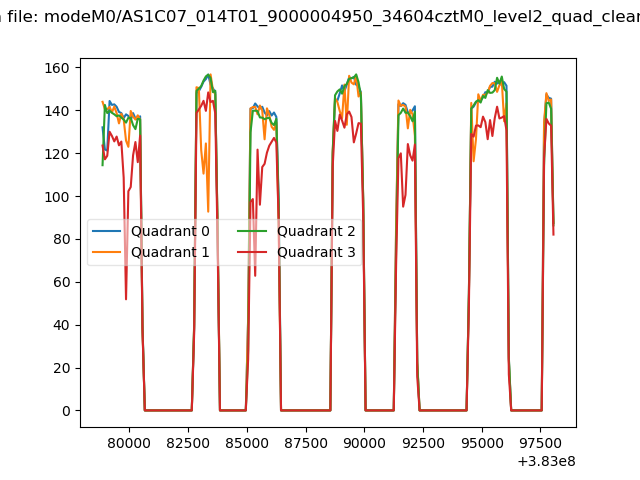
| Quadrant-wise count rates Data is divided into 100 sec bins |
 |
|
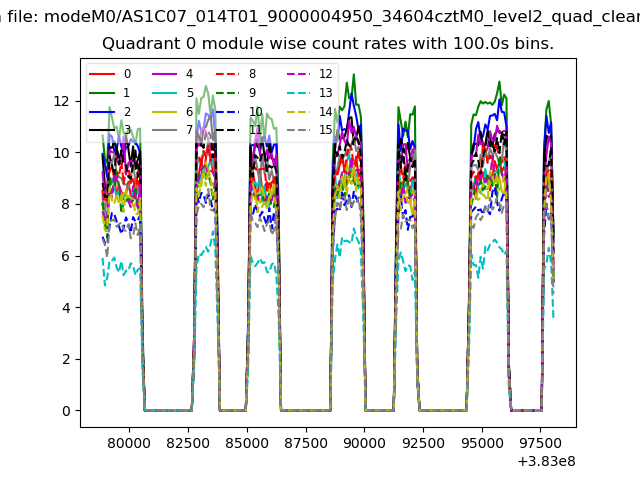
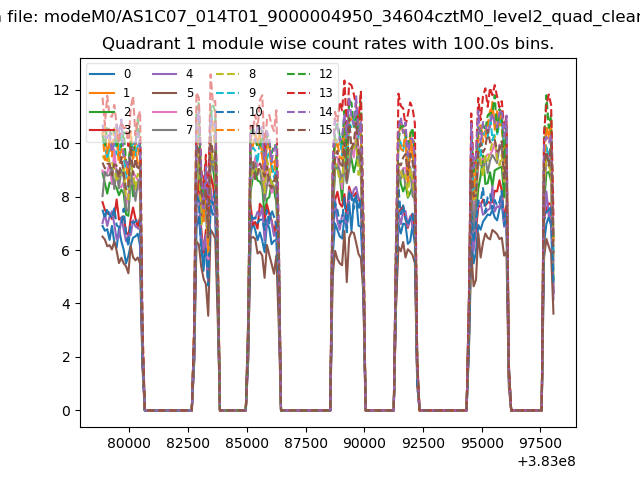
| Module-wise count rates for Quadrant A Data is divided into 100 sec bins |
 |
 |
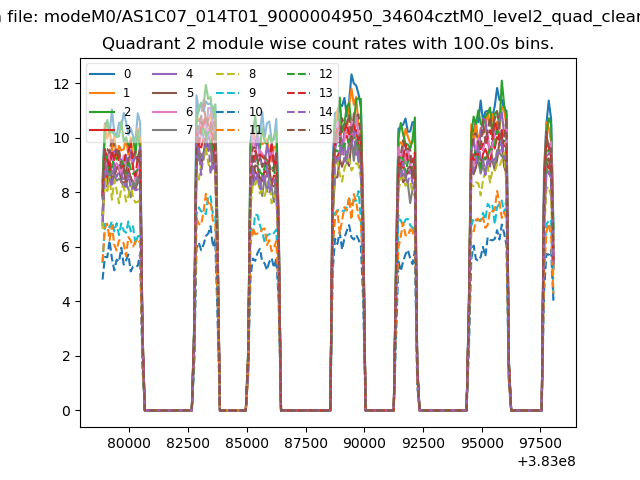
| Module-wise count rates for Quadrant B Data is divided into 100 sec bins |
 |
 |
| Module-wise count rates for Quadrant C Data is divided into 100 sec bins |
 |
 |
| Module-wise count rates for Quadrant D Data is divided into 100 sec bins |
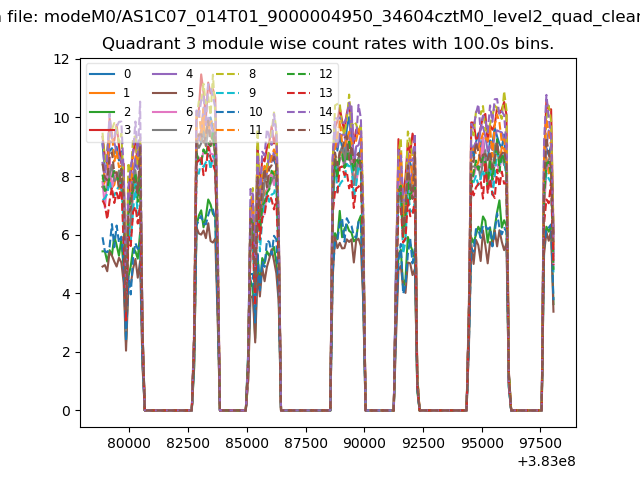 |
 |
| Parameter | Plot |
|---|---|
| CZT HV Monitor | 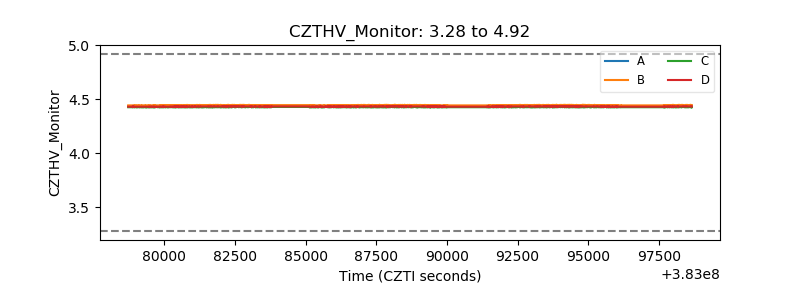 |
| D_VDD | 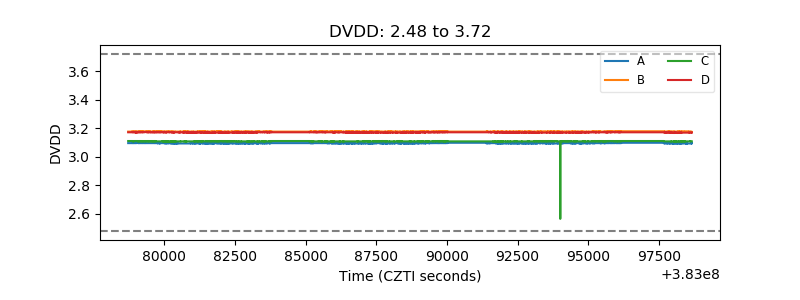 |
| Temperature 1 | 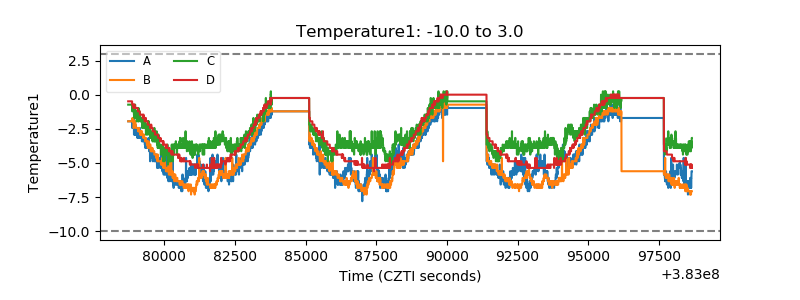 |
| Veto HV Monitor | 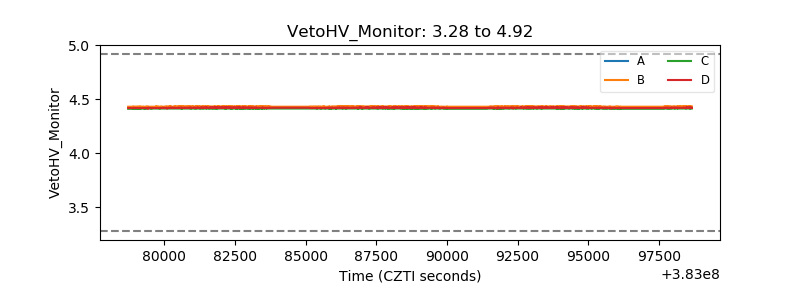 |
| Veto LLD | 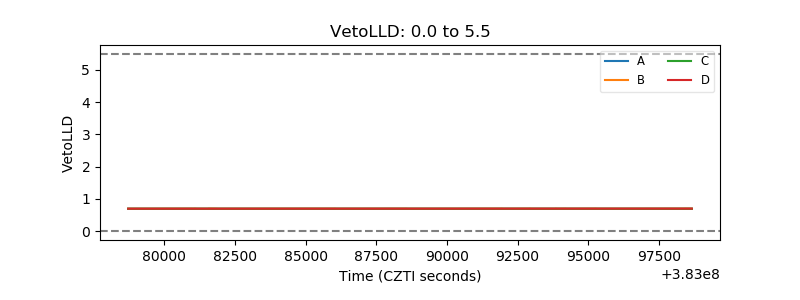 |
| Alpha Counter | 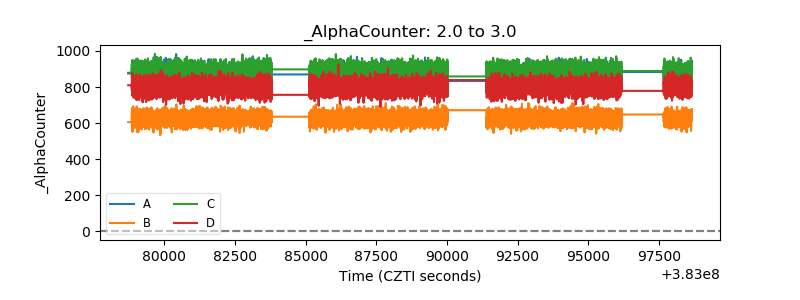 |
| _CPM_Rate | 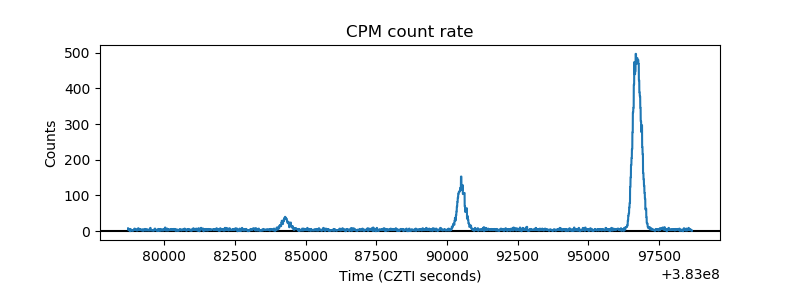 |
| CZT Counter | 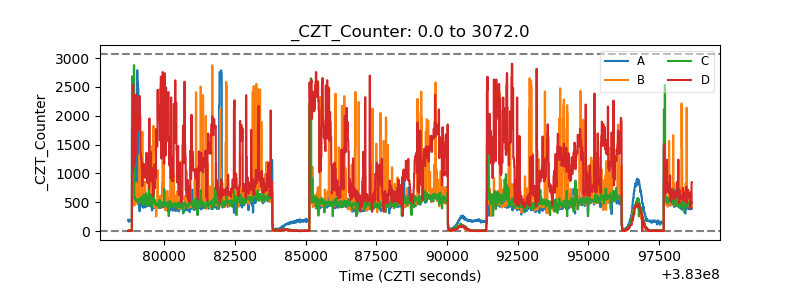 |
| +2.5 Volts monitor | 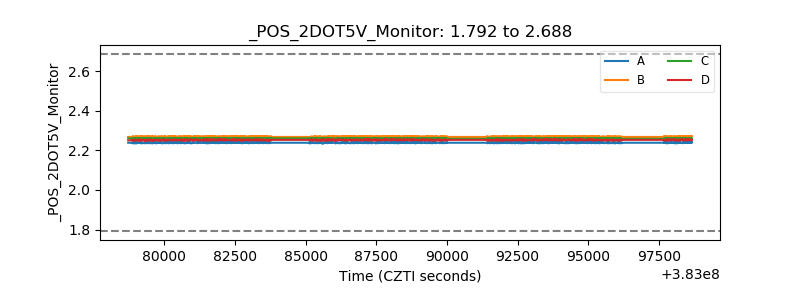 |
| +5 Volts monitor | 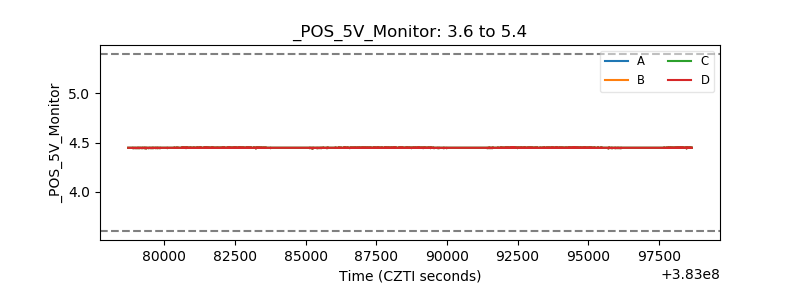 |
| _ROLL_ROT | 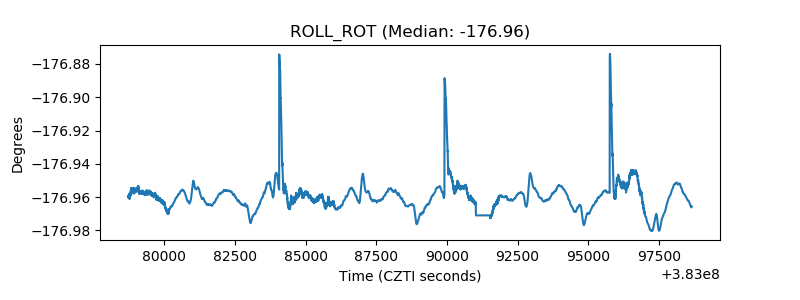 |
| _Roll_DEC | 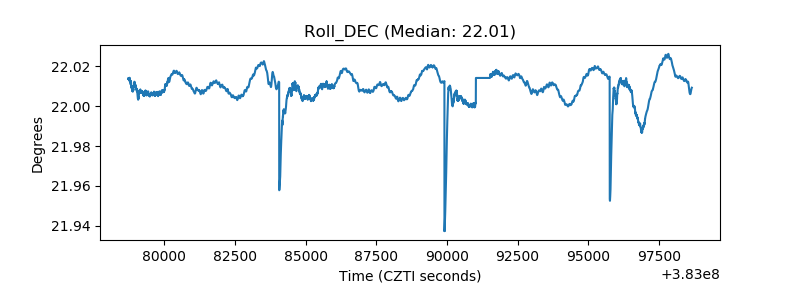 |
| _Roll_RA | 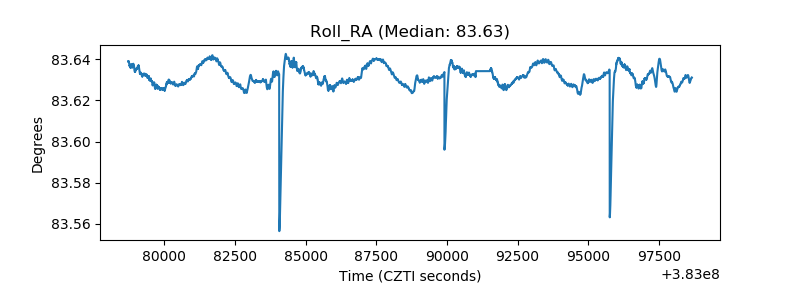 |
| Veto Counter | 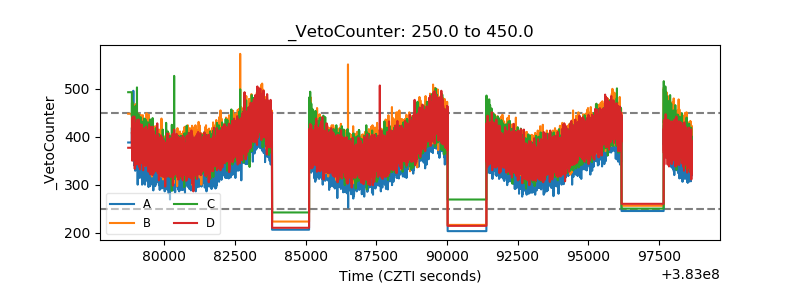 |