| Param | Original file | Final file |
|---|---|---|
| Filename | modeM0/AS1C07_014T01_9000004950_34598cztM0_level2.evt | modeM0/AS1C07_014T01_9000004950_34598cztM0_level2_quad_clean.evt |
| Size (bytes) | 505,670,400 | 94,717,440 |
| Size | 482.2 MB | 90.3 MB |
| Events in quadrant A | 2,566,524 | 657,966 |
| Events in quadrant B | 3,504,459 | 641,150 |
| Events in quadrant C | 2,872,691 | 638,479 |
| Events in quadrant D | 6,031,633 | 579,591 |
| Mode SS | |||
|---|---|---|---|
| Quadrant | BADHDUFLAG | Total packets | Discarded packets |
| A | 0 | 102 | 0 |
| B | 0 | 102 | 0 |
| C | 0 | 102 | 0 |
| D | 0 | 102 | 0 |
| Mode M9 | |||
|---|---|---|---|
| Quadrant | BADHDUFLAG | Total packets | Discarded packets |
| A | 0 | 35 | 0 |
| B | 0 | 35 | 0 |
| C | 0 | 35 | 0 |
| D | 0 | 36 | 0 |
| Mode M0 | |||
|---|---|---|---|
| Quadrant | BADHDUFLAG | Total packets | Discarded packets |
| A | 0 | 10563 | 3 |
| B | 0 | 13484 | 2 |
| C | 0 | 11377 | 2 |
| D | 0 | 21595 | 2 |
| Quadrant | Total seconds | Saturated seconds | Saturation percentage |
|---|---|---|---|
| A | 5008 | 18 | 0.359425% |
| B | 5008 | 310 | 6.190096% |
| C | 5008 | 45 | 0.898562% |
| D | 5008 | 354 | 7.068690% |
Noise dominated data is calculated using 1-second bins in cleaned event files. If a bin has >2000 counts, and if more than 50% of those come from <1% of pixels, then it is considered to be noise-dominated and hence unusable.
| Quadrant | # 1 sec bins | Bins with >0 counts | Bins with >2000 counts | High rate bins dominated by noise | Noise dominated (total time) | Noise dominated (detector-on time) | Marked lightcurve |
|---|---|---|---|---|---|---|---|
| A | 7072 | 5009 | 8 | 8 | 0.11% | 0.16% | 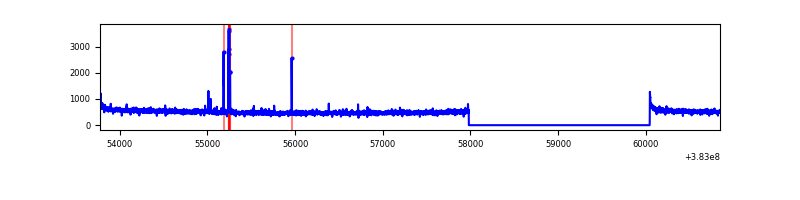 |
| B | 7072 | 5009 | 220 | 220 | 3.11% | 4.39% | 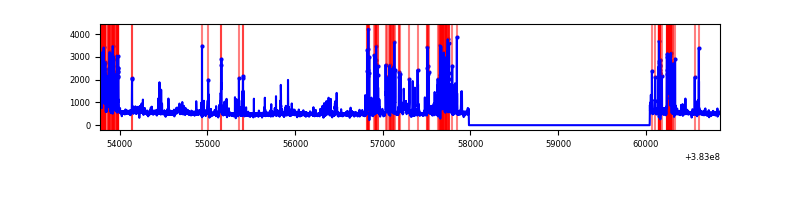 |
| C | 7072 | 5009 | 35 | 35 | 0.49% | 0.70% | 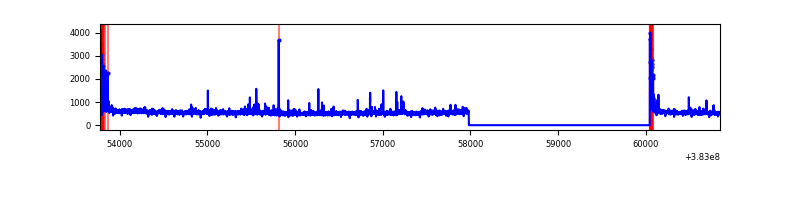 |
| D | 7072 | 5009 | 409 | 409 | 5.78% | 8.17% | 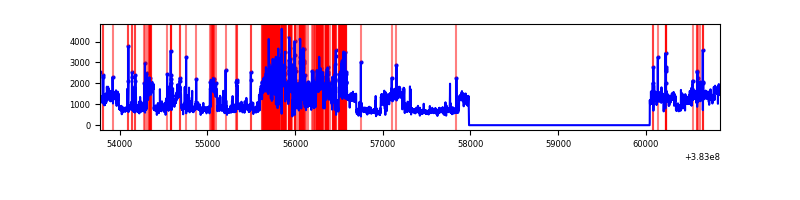 |
Top three noisy pixels from each quadrant. If the there are fewer than three noisy pixels in the level2.evt file, extra rows are filled as -1
| Pixel properties | Quadrant properties | ||||||
|---|---|---|---|---|---|---|---|
| Quadrant | DetID | PixID | Counts | Sigma | Mean | Median | Sigma |
| A | 9 | 143 | 46429 | 355.45 | 638 | 627 | 128.9 |
| A | 10 | 83 | 44719 | 342.18 | 638 | 627 | 128.9 |
| A | 13 | 254 | 9340 | 67.62 | 638 | 627 | 128.9 |
| B | 5 | 172 | 792646 | 6674.62 | 613 | 599 | 118.7 |
| B | 5 | 255 | 117050 | 981.34 | 613 | 599 | 118.7 |
| B | 0 | 189 | 88011 | 736.62 | 613 | 599 | 118.7 |
| C | 15 | 214 | 213954 | 1511.75 | 607 | 616 | 141.1 |
| C | 0 | 10 | 130299 | 918.95 | 607 | 616 | 141.1 |
| C | 0 | 207 | 59120 | 414.57 | 607 | 616 | 141.1 |
| D | 8 | 195 | 2708406 | 16429.35 | 598 | 589 | 164.8 |
| D | 7 | 38 | 554071 | 3358.18 | 598 | 589 | 164.8 |
| D | 13 | 249 | 141908 | 857.44 | 598 | 589 | 164.8 |
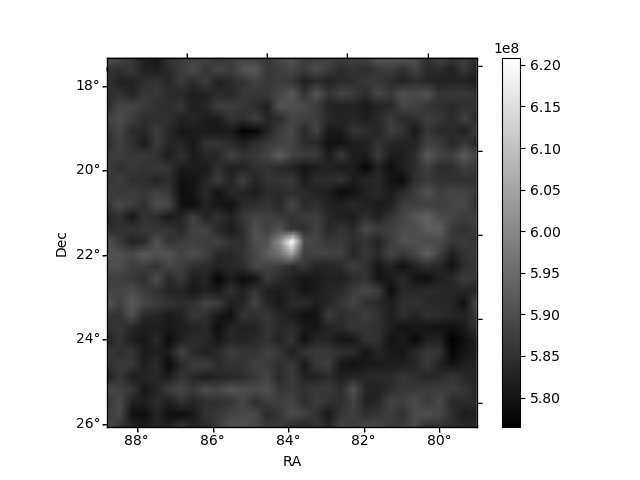
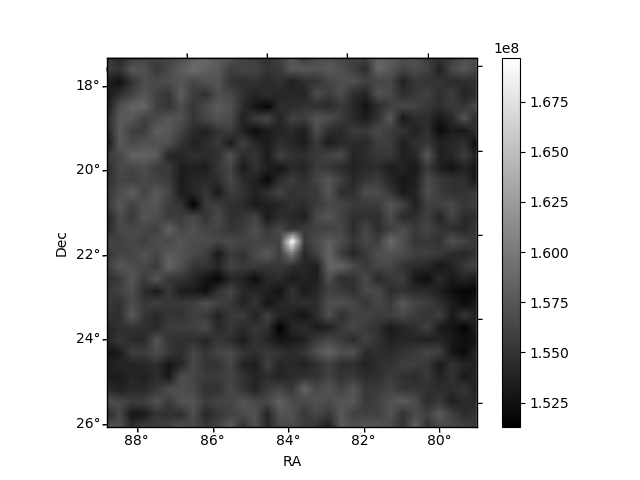
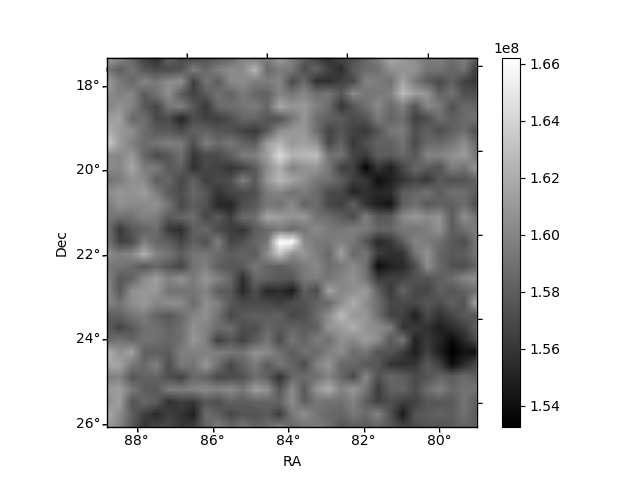
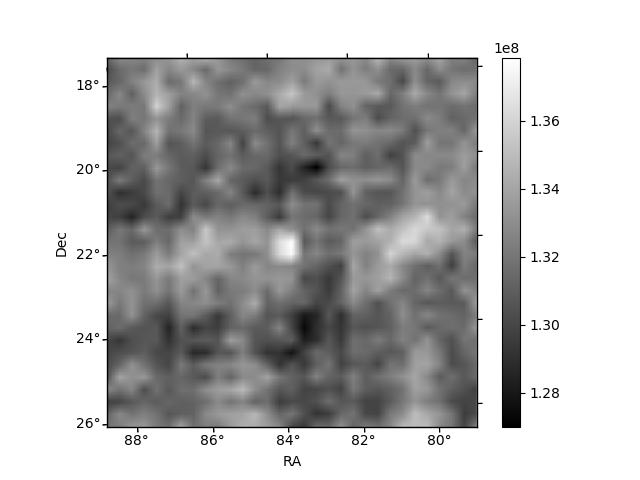
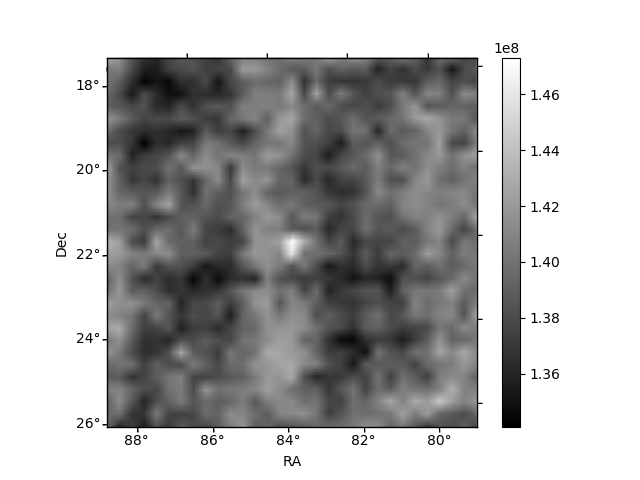
Histogram calculated using DETX and DETY for each event in the final _common_clean file
| Quadrant A | 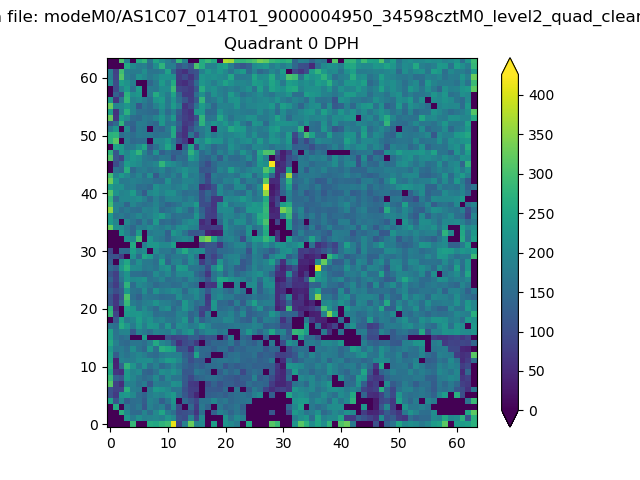 |
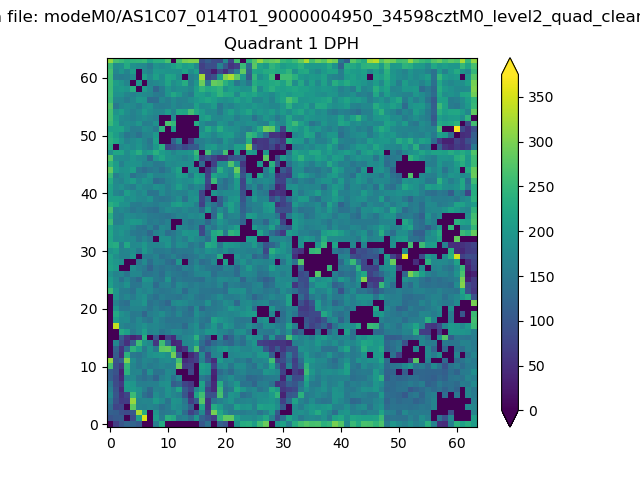 |
Quadrant B |
|---|---|---|---|
| Quadrant D | 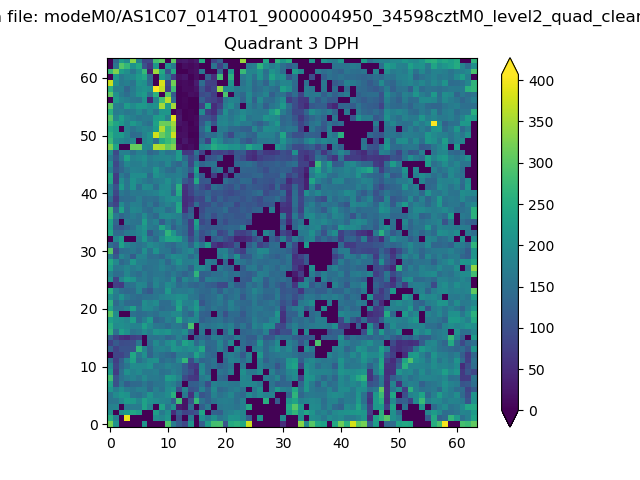 |
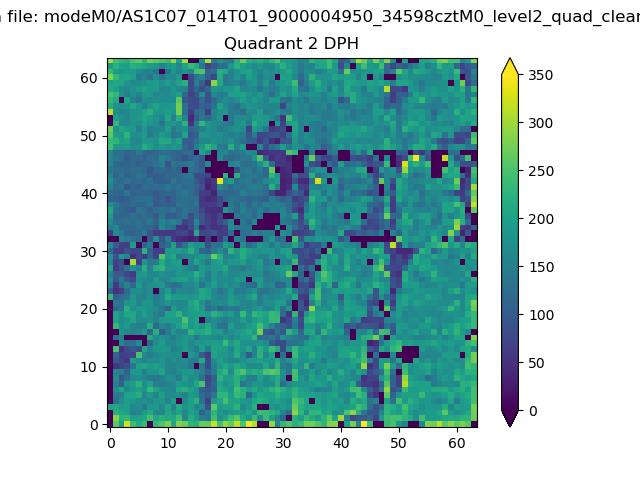 |
Quadrant C |
| Plot type | Count rate plots | Images |
|---|---|---|
| Comparison with Poisson distribution Blue bars denote a histogram of data divided into 1 sec bins. Red curve is a Poisson curve with rate = median count rate of data. |
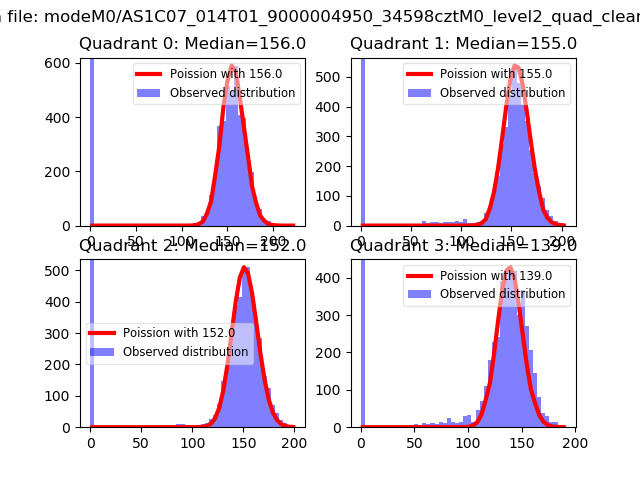 |
 |
| Quadrant-wise count rates Data is divided into 100 sec bins |
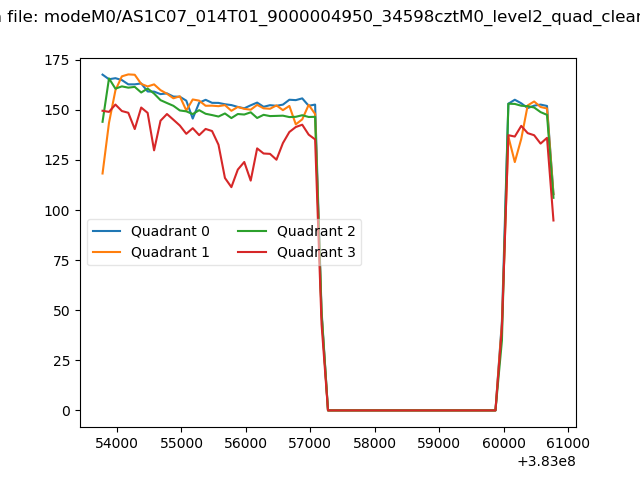 |
|
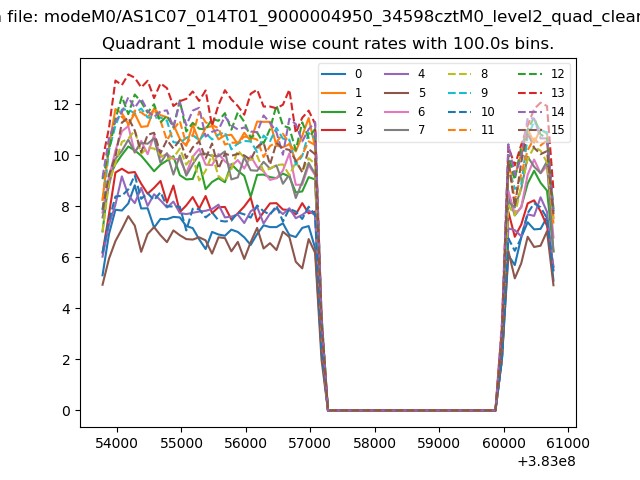
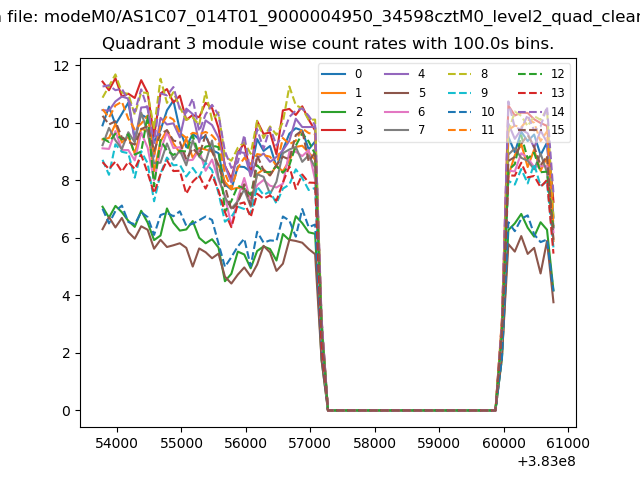
| Module-wise count rates for Quadrant A Data is divided into 100 sec bins |
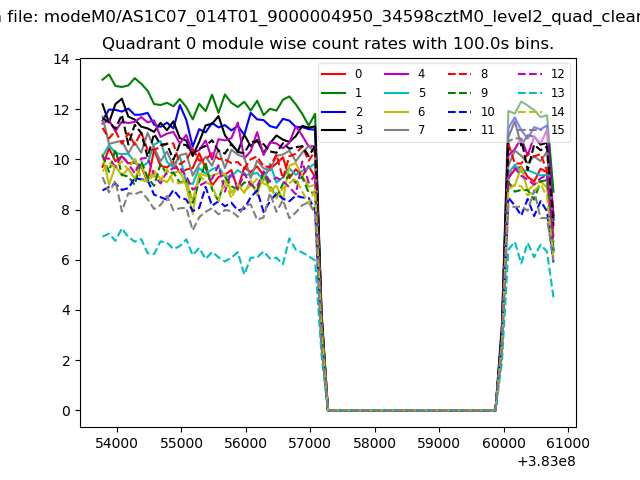 |
 |
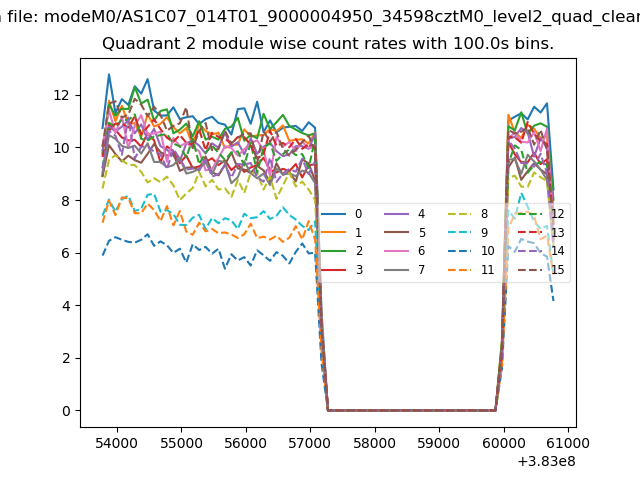
| Module-wise count rates for Quadrant B Data is divided into 100 sec bins |
 |
 |
| Module-wise count rates for Quadrant C Data is divided into 100 sec bins |
 |
 |
| Module-wise count rates for Quadrant D Data is divided into 100 sec bins |
 |
 |
| Parameter | Plot |
|---|---|
| CZT HV Monitor | 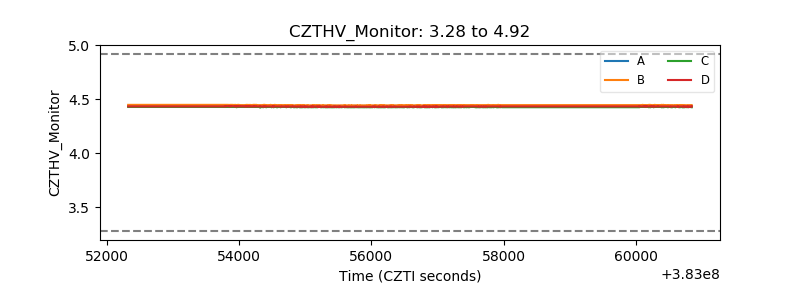 |
| D_VDD | 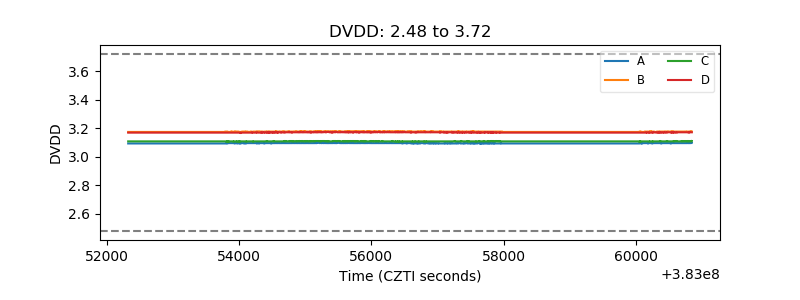 |
| Temperature 1 | 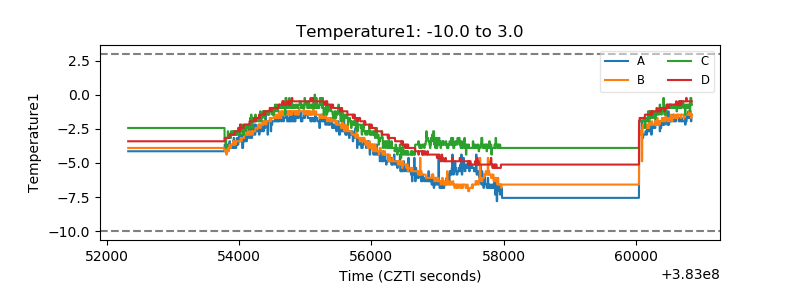 |
| Veto HV Monitor | 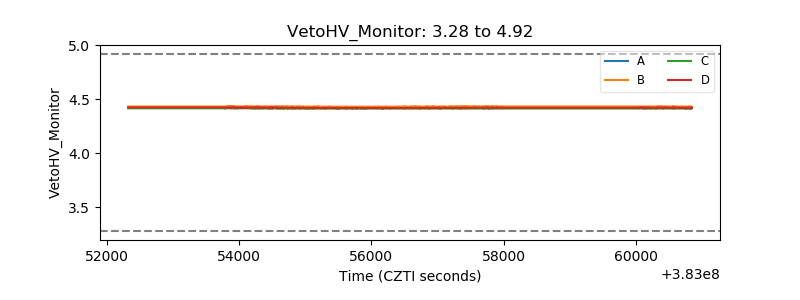 |
| Veto LLD | 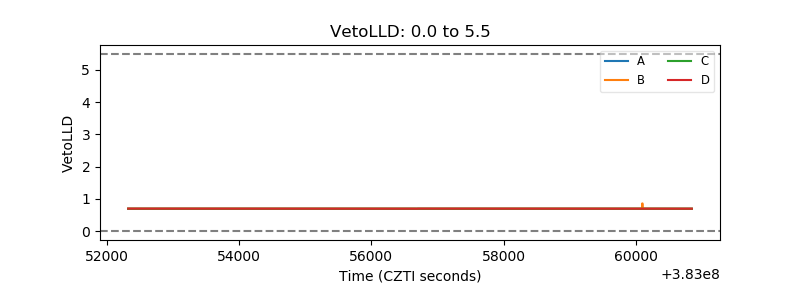 |
| Alpha Counter | 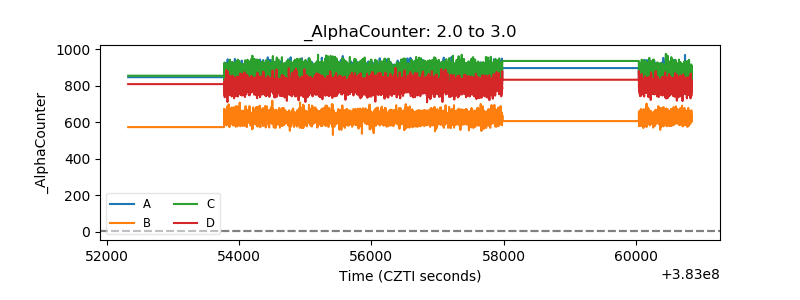 |
| _CPM_Rate | 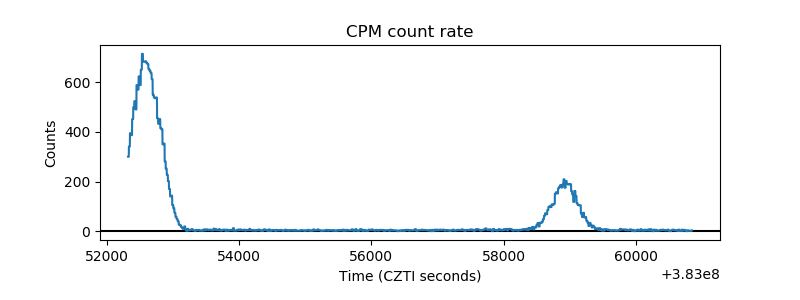 |
| CZT Counter | 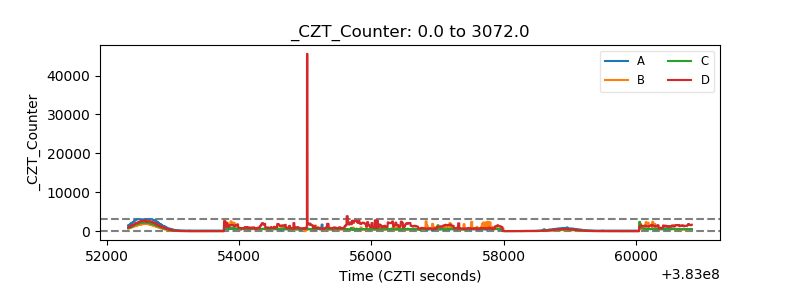 |
| +2.5 Volts monitor | 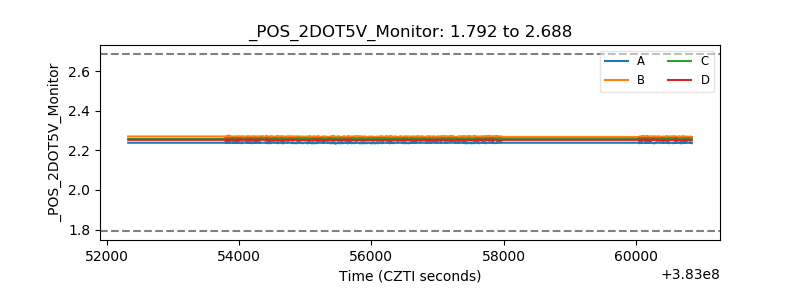 |
| +5 Volts monitor | 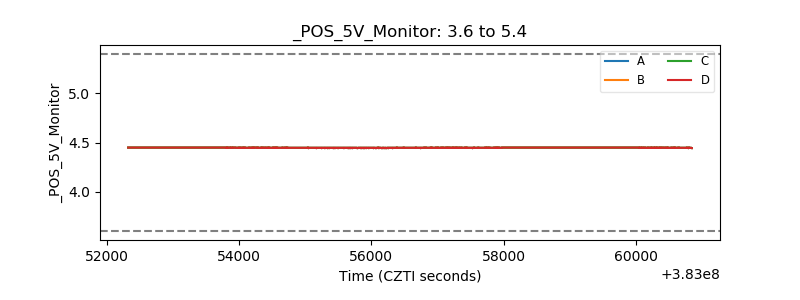 |
| _ROLL_ROT | 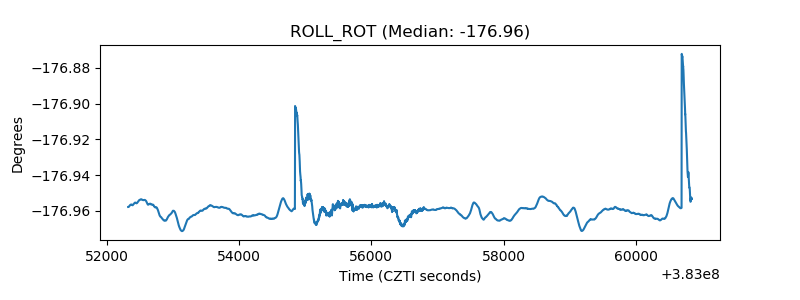 |
| _Roll_DEC | 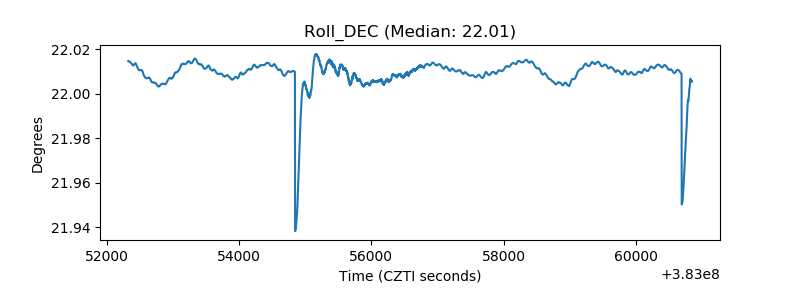 |
| _Roll_RA | 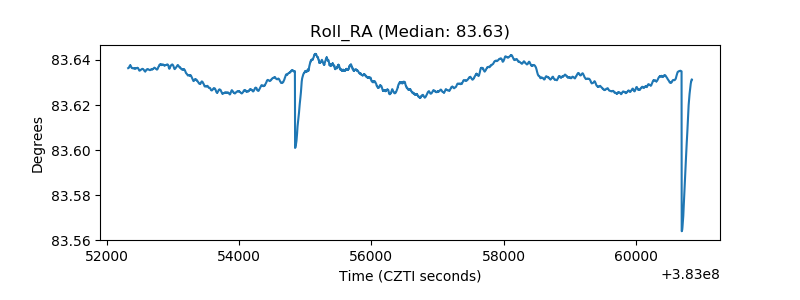 |
| Veto Counter | 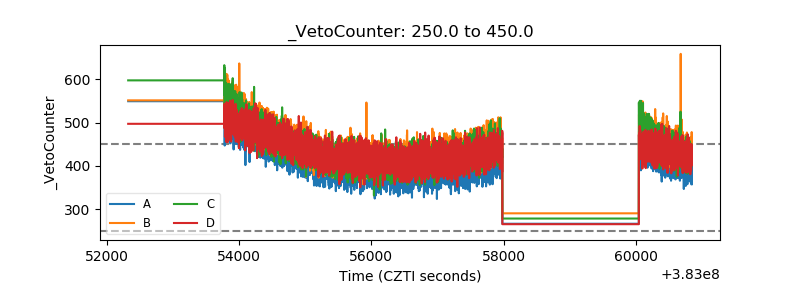 |