| Param | Original file | Final file |
|---|---|---|
| Filename | modeM0/AS1A09_038T43_9000004946_34585cztM0_level2.evt | modeM0/AS1A09_038T43_9000004946_34585cztM0_level2_quad_clean.evt |
| Size (bytes) | 222,552,000 | 43,145,280 |
| Size | 212.2 MB | 41.1 MB |
| Events in quadrant A | 1,086,815 | 295,016 |
| Events in quadrant B | 1,338,509 | 292,584 |
| Events in quadrant C | 1,188,062 | 290,381 |
| Events in quadrant D | 2,972,538 | 266,161 |
| Mode M0 | |||
|---|---|---|---|
| Quadrant | BADHDUFLAG | Total packets | Discarded packets |
| A | 0 | 4598 | 2 |
| B | 0 | 5326 | 1 |
| C | 0 | 4773 | 1 |
| D | 0 | 10433 | 1 |
| Mode SS | |||
|---|---|---|---|
| Quadrant | BADHDUFLAG | Total packets | Discarded packets |
| A | 0 | 46 | 0 |
| B | 0 | 46 | 0 |
| C | 0 | 46 | 0 |
| D | 0 | 46 | 0 |
| Mode M9 | |||
|---|---|---|---|
| Quadrant | BADHDUFLAG | Total packets | Discarded packets |
| A | 0 | 16 | 0 |
| B | 0 | 16 | 0 |
| C | 0 | 16 | 0 |
| D | 0 | 16 | 0 |
| Quadrant | Total seconds | Saturated seconds | Saturation percentage |
|---|---|---|---|
| A | 2246 | 6 | 0.267142% |
| B | 2246 | 70 | 3.116652% |
| C | 2246 | 14 | 0.623330% |
| D | 2246 | 183 | 8.147818% |
Noise dominated data is calculated using 1-second bins in cleaned event files. If a bin has >2000 counts, and if more than 50% of those come from <1% of pixels, then it is considered to be noise-dominated and hence unusable.
| Quadrant | # 1 sec bins | Bins with >0 counts | Bins with >2000 counts | High rate bins dominated by noise | Noise dominated (total time) | Noise dominated (detector-on time) | Marked lightcurve |
|---|---|---|---|---|---|---|---|
| A | 3859 | 2247 | 1 | 1 | 0.03% | 0.04% | 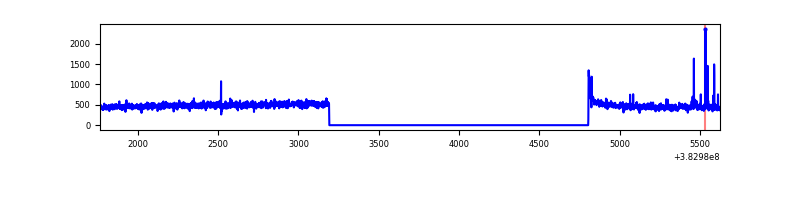 |
| B | 3859 | 2247 | 49 | 49 | 1.27% | 2.18% | 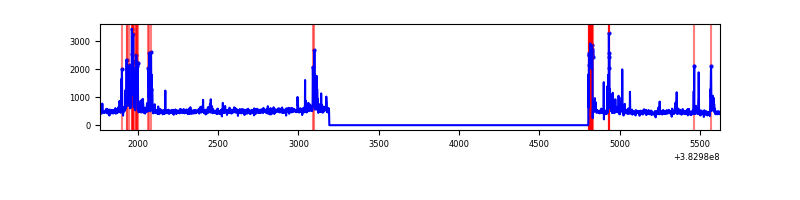 |
| C | 3859 | 2247 | 10 | 10 | 0.26% | 0.45% | 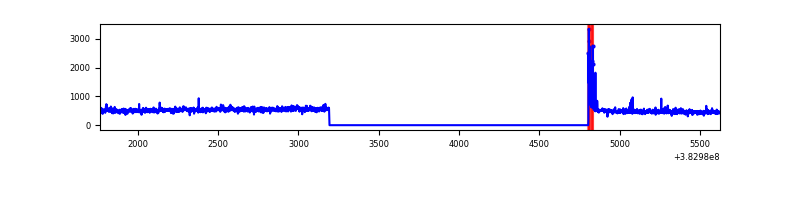 |
| D | 3859 | 2247 | 208 | 208 | 5.39% | 9.26% | 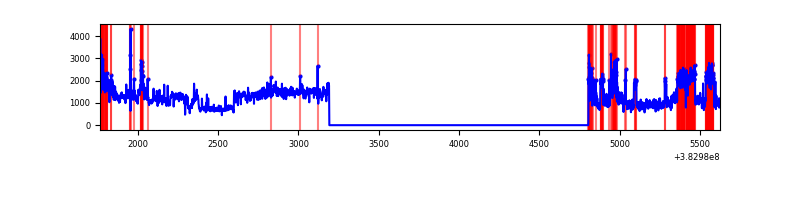 |
Top three noisy pixels from each quadrant. If the there are fewer than three noisy pixels in the level2.evt file, extra rows are filled as -1
| Pixel properties | Quadrant properties | ||||||
|---|---|---|---|---|---|---|---|
| Quadrant | DetID | PixID | Counts | Sigma | Mean | Median | Sigma |
| A | 10 | 83 | 22414 | 397.42 | 271 | 265 | 55.7 |
| A | 9 | 143 | 12116 | 212.64 | 271 | 265 | 55.7 |
| A | 13 | 254 | 5545 | 94.74 | 271 | 265 | 55.7 |
| B | 5 | 172 | 222481 | 4265.76 | 264 | 257 | 52.1 |
| B | 15 | 32 | 28117 | 534.79 | 264 | 257 | 52.1 |
| B | 0 | 189 | 22224 | 421.67 | 264 | 257 | 52.1 |
| C | 15 | 214 | 96793 | 1563.52 | 263 | 265 | 61.7 |
| C | 0 | 10 | 40850 | 657.38 | 263 | 265 | 61.7 |
| C | 14 | 67 | 14260 | 226.69 | 263 | 265 | 61.7 |
| D | 8 | 195 | 1641638 | 23656.72 | 257 | 252 | 69.4 |
| D | 7 | 223 | 77343 | 1111.09 | 257 | 252 | 69.4 |
| D | 13 | 249 | 54818 | 786.44 | 257 | 252 | 69.4 |
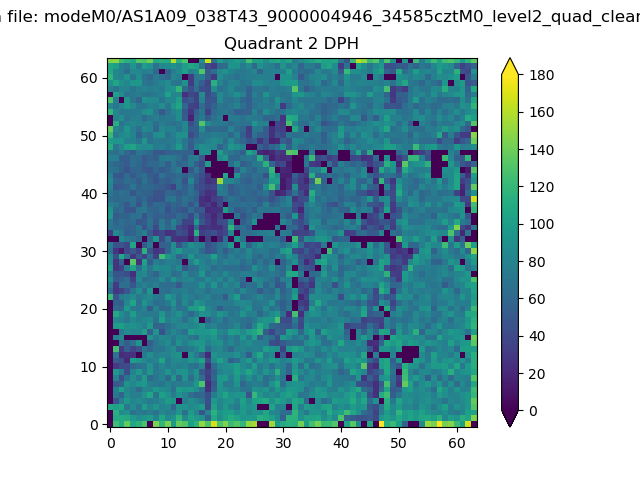
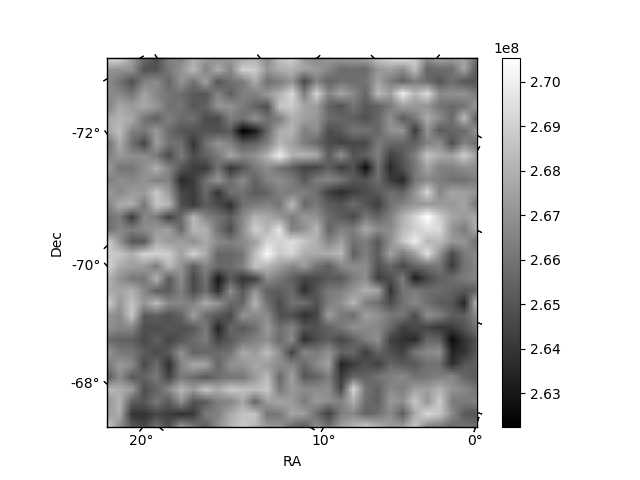
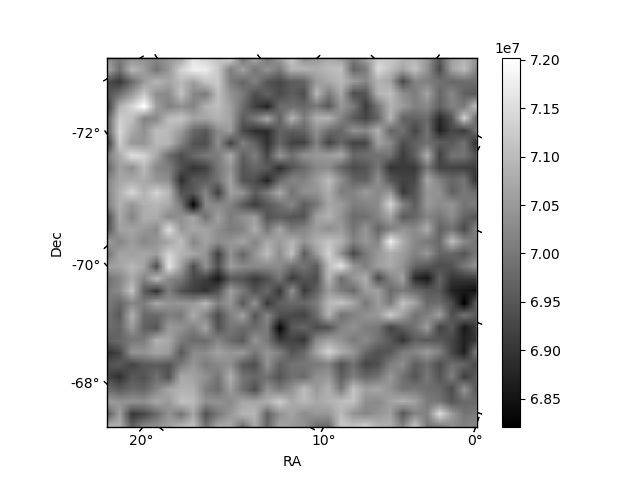
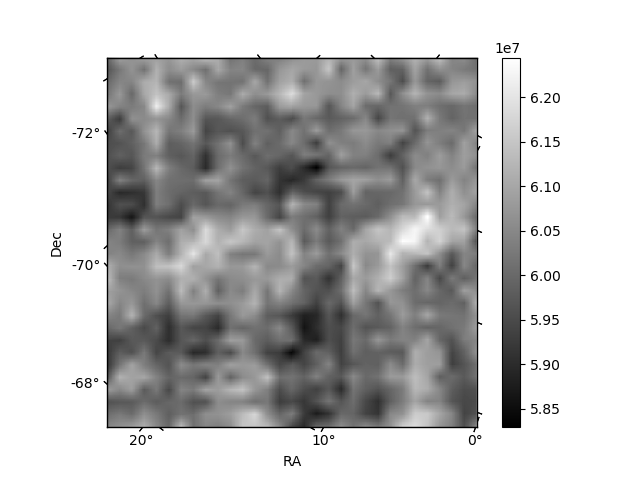
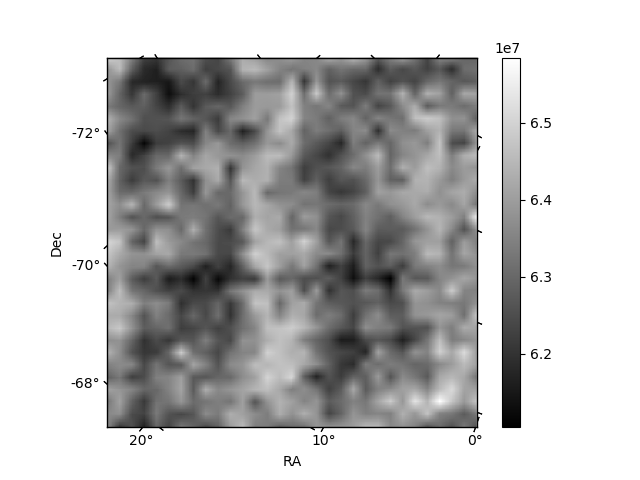
Histogram calculated using DETX and DETY for each event in the final _common_clean file
| Quadrant A | 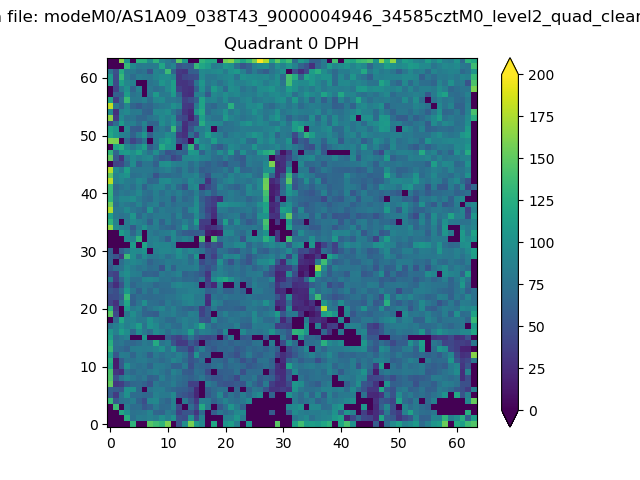 |
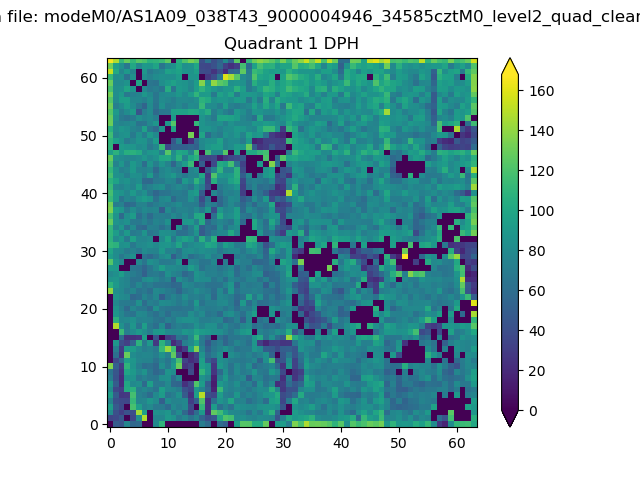 |
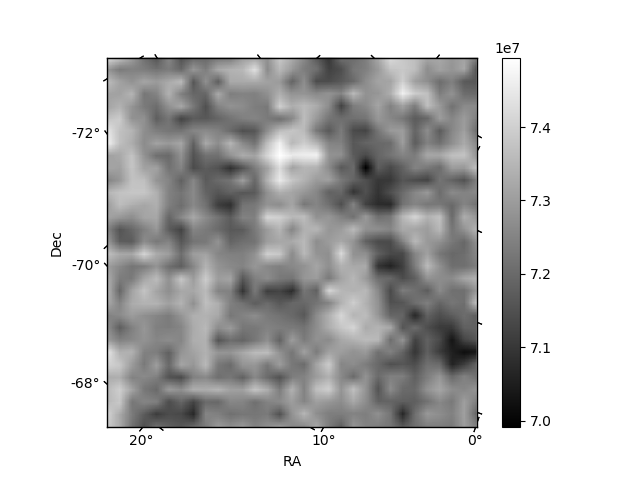
Quadrant B |
|---|---|---|---|
| Quadrant D | 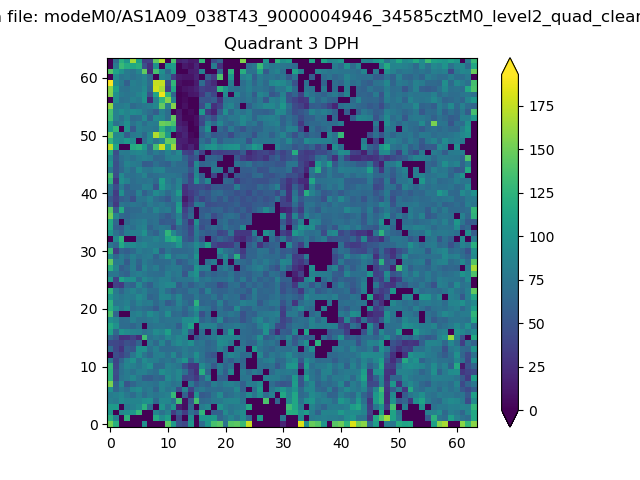 |
 |
Quadrant C |
| Plot type | Count rate plots | Images |
|---|---|---|
| Comparison with Poisson distribution Blue bars denote a histogram of data divided into 1 sec bins. Red curve is a Poisson curve with rate = median count rate of data. |
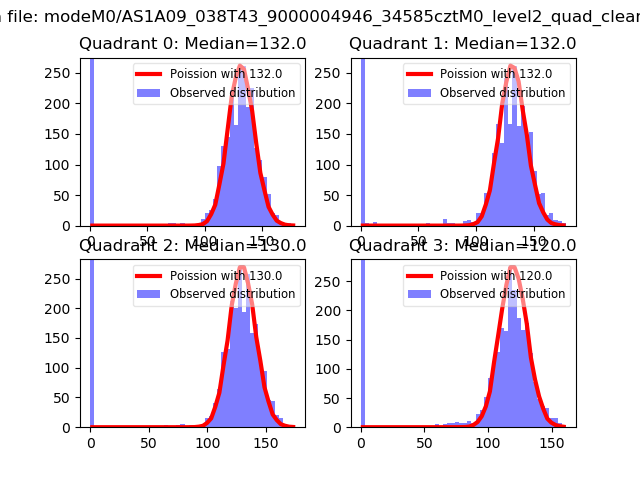 |
 |
| Quadrant-wise count rates Data is divided into 100 sec bins |
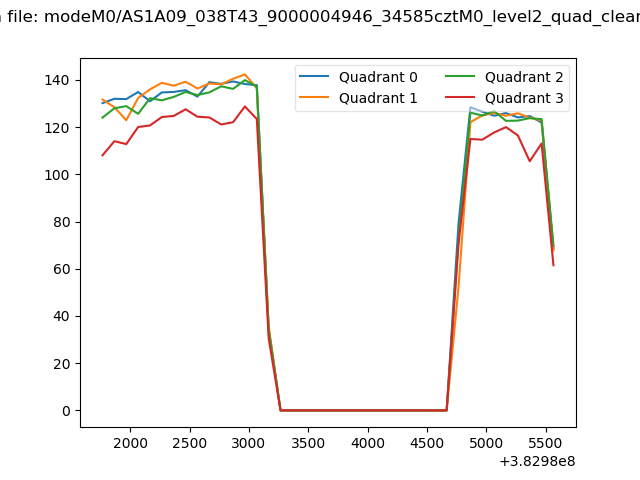 |
|
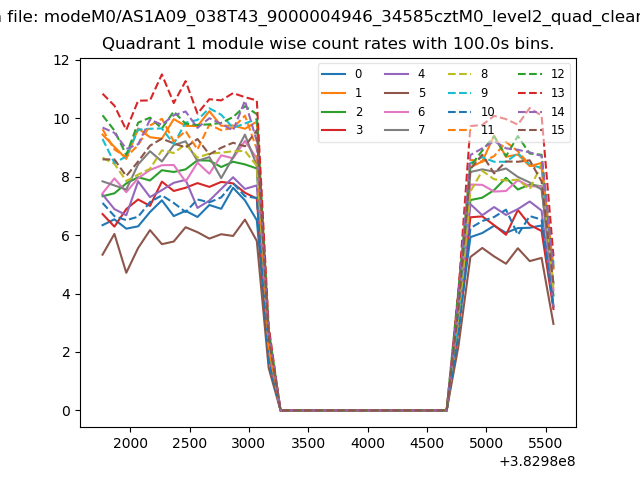
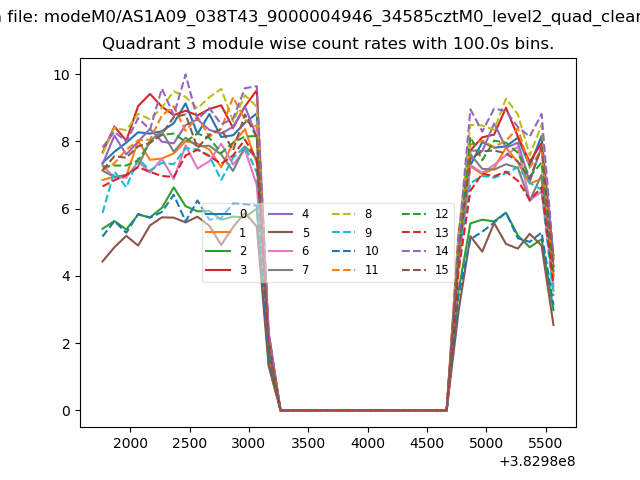
| Module-wise count rates for Quadrant A Data is divided into 100 sec bins |
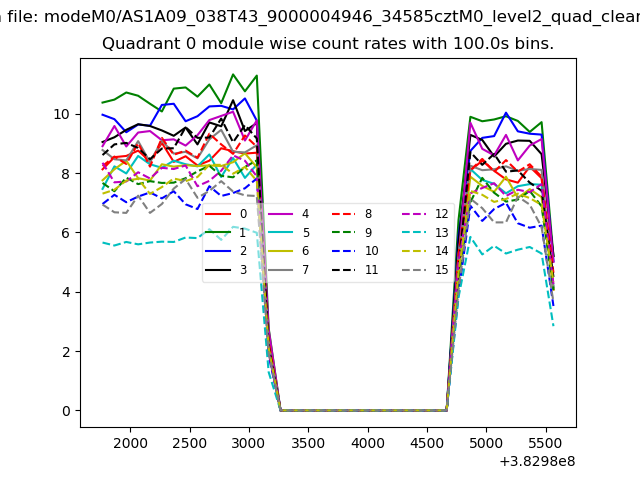 |
 |
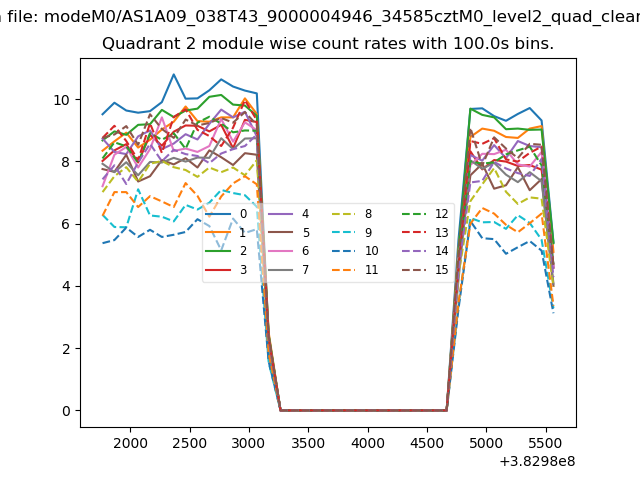
| Module-wise count rates for Quadrant B Data is divided into 100 sec bins |
 |
 |
| Module-wise count rates for Quadrant C Data is divided into 100 sec bins |
 |
 |
| Module-wise count rates for Quadrant D Data is divided into 100 sec bins |
 |
 |
| Parameter | Plot |
|---|---|
| CZT HV Monitor | 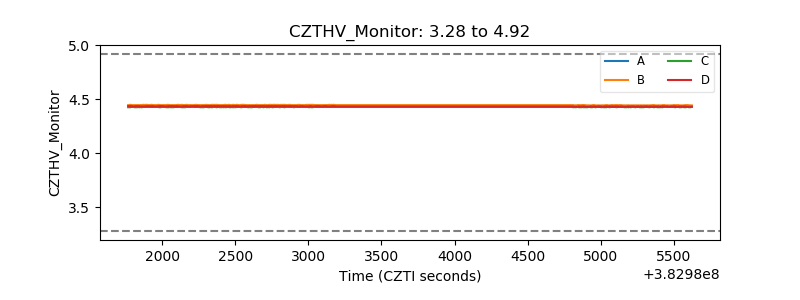 |
| D_VDD | 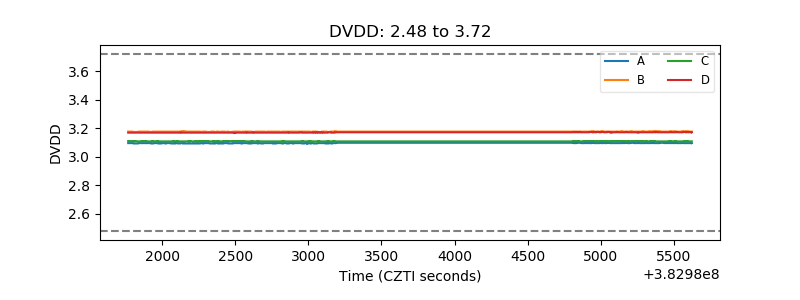 |
| Temperature 1 | 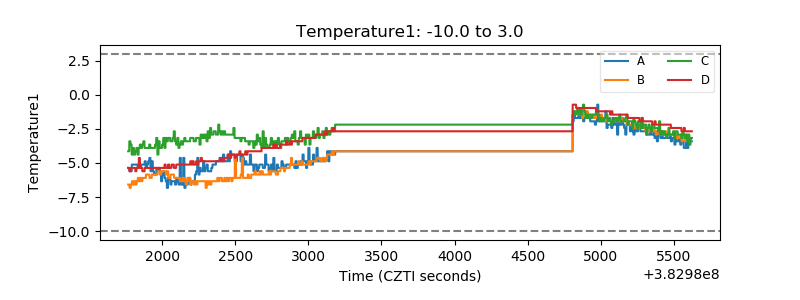 |
| Veto HV Monitor | 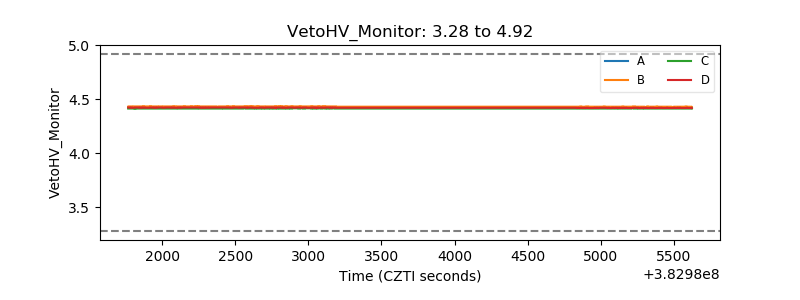 |
| Veto LLD | 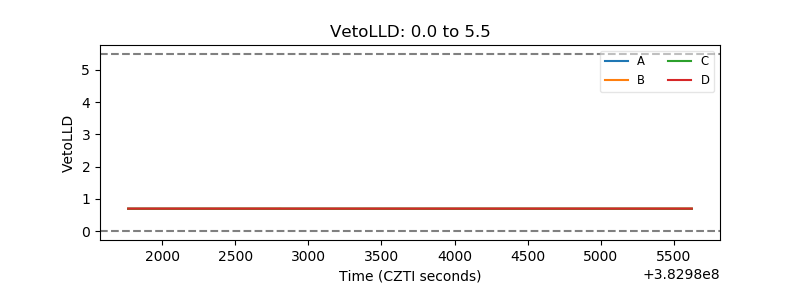 |
| Alpha Counter | 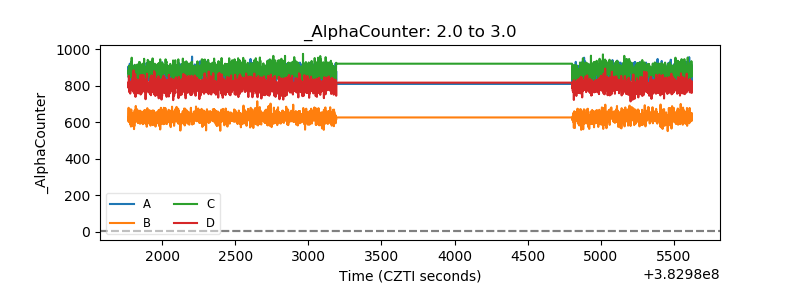 |
| _CPM_Rate | 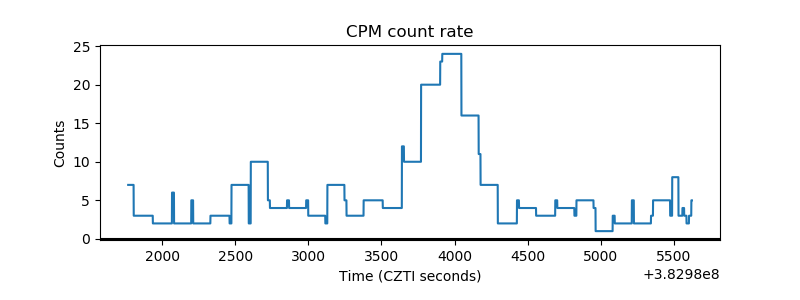 |
| CZT Counter | 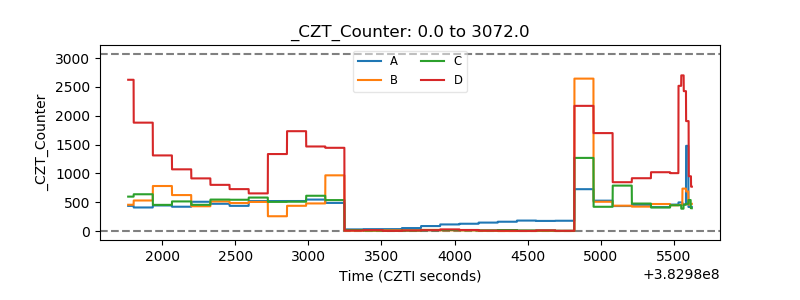 |
| +2.5 Volts monitor | 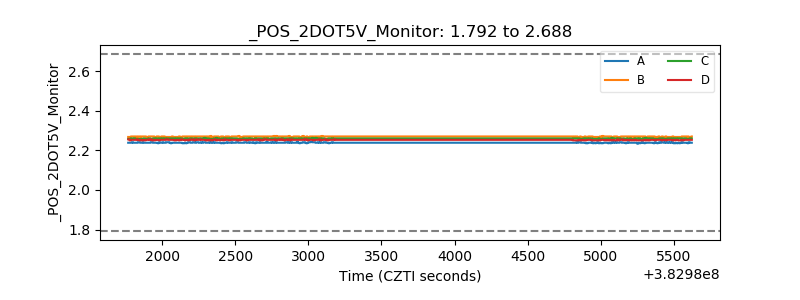 |
| +5 Volts monitor | 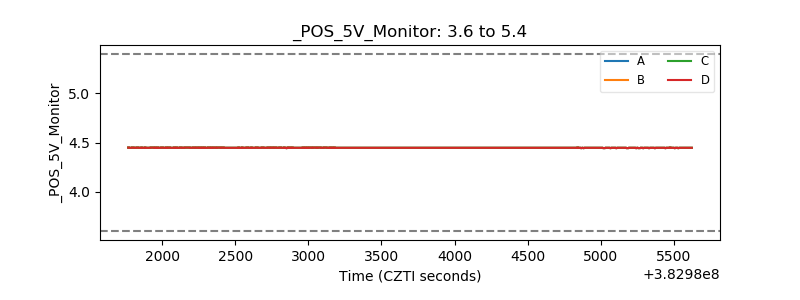 |
| _ROLL_ROT | 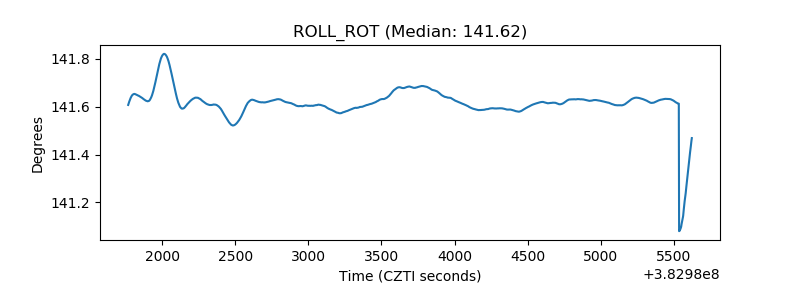 |
| _Roll_DEC | 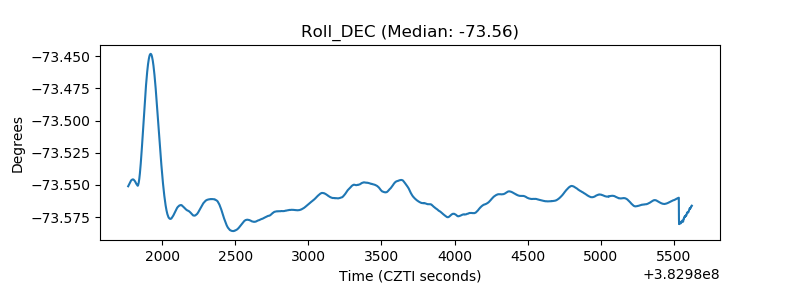 |
| _Roll_RA | 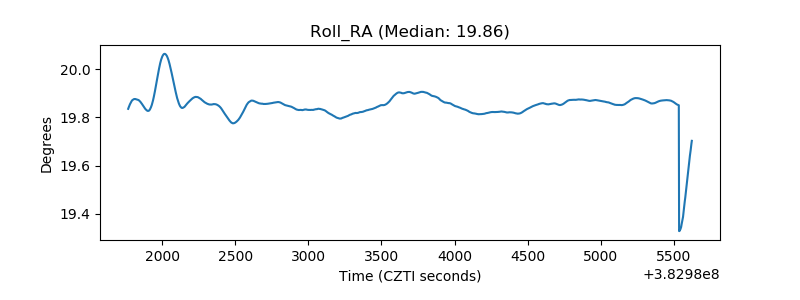 |
| Veto Counter | 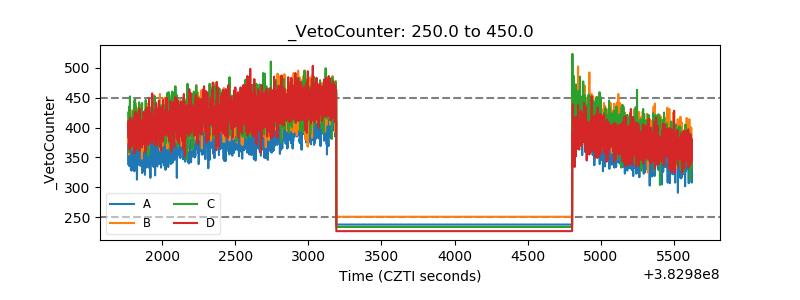 |