| Param | Original file | Final file |
|---|---|---|
| Filename | modeM0/AS1A05_167T01_9000004940_34581cztM0_level2.evt | modeM0/AS1A05_167T01_9000004940_34581cztM0_level2_quad_clean.evt |
| Size (bytes) | 356,307,840 | 40,800,960 |
| Size | 339.8 MB | 38.9 MB |
| Events in quadrant A | 1,958,718 | 245,315 |
| Events in quadrant B | 2,444,711 | 248,761 |
| Events in quadrant C | 2,238,275 | 243,594 |
| Events in quadrant D | 3,890,751 | 228,642 |
| Mode SS | |||
|---|---|---|---|
| Quadrant | BADHDUFLAG | Total packets | Discarded packets |
| A | 0 | 76 | 0 |
| B | 0 | 76 | 0 |
| C | 0 | 76 | 0 |
| D | 0 | 76 | 0 |
| Mode M9 | |||
|---|---|---|---|
| Quadrant | BADHDUFLAG | Total packets | Discarded packets |
| A | 0 | 8 | 0 |
| B | 0 | 8 | 0 |
| C | 0 | 8 | 0 |
| D | 0 | 9 | 0 |
| Mode M0 | |||
|---|---|---|---|
| Quadrant | BADHDUFLAG | Total packets | Discarded packets |
| A | 0 | 7866 | 1 |
| B | 0 | 9621 | 1 |
| C | 0 | 8782 | 1 |
| D | 0 | 14421 | 1 |
| Quadrant | Total seconds | Saturated seconds | Saturation percentage |
|---|---|---|---|
| A | 3802 | 2 | 0.052604% |
| B | 3802 | 69 | 1.814834% |
| C | 3802 | 24 | 0.631247% |
| D | 3802 | 100 | 2.630195% |
Noise dominated data is calculated using 1-second bins in cleaned event files. If a bin has >2000 counts, and if more than 50% of those come from <1% of pixels, then it is considered to be noise-dominated and hence unusable.
| Quadrant | # 1 sec bins | Bins with >0 counts | Bins with >2000 counts | High rate bins dominated by noise | Noise dominated (total time) | Noise dominated (detector-on time) | Marked lightcurve |
|---|---|---|---|---|---|---|---|
| A | 3802 | 3802 | 3 | 3 | 0.08% | 0.08% | 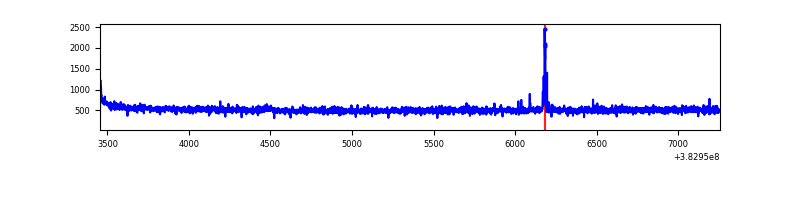 |
| B | 3802 | 3802 | 48 | 48 | 1.26% | 1.26% | 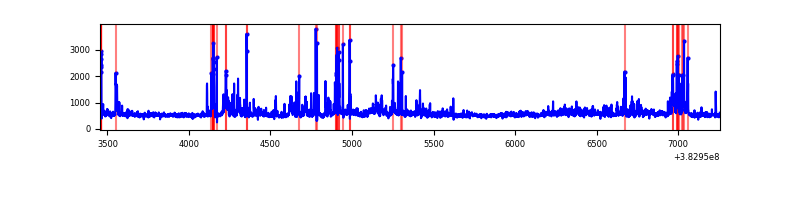 |
| C | 3802 | 3802 | 15 | 15 | 0.39% | 0.39% | 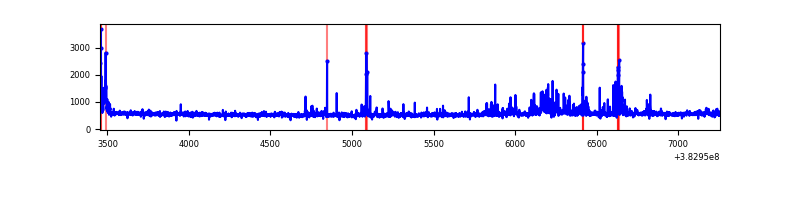 |
| D | 3802 | 3802 | 67 | 67 | 1.76% | 1.76% | 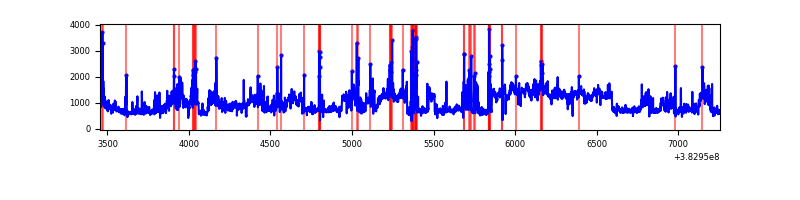 |
Top three noisy pixels from each quadrant. If the there are fewer than three noisy pixels in the level2.evt file, extra rows are filled as -1
| Pixel properties | Quadrant properties | ||||||
|---|---|---|---|---|---|---|---|
| Quadrant | DetID | PixID | Counts | Sigma | Mean | Median | Sigma |
| A | 10 | 83 | 23800 | 234.83 | 493 | 484 | 99.3 |
| A | 7 | 16 | 21740 | 214.08 | 493 | 484 | 99.3 |
| A | 13 | 254 | 6480 | 60.39 | 493 | 484 | 99.3 |
| B | 5 | 172 | 192982 | 2115.97 | 480 | 469 | 91.0 |
| B | 0 | 189 | 117355 | 1284.73 | 480 | 469 | 91.0 |
| B | 0 | 190 | 110139 | 1205.41 | 480 | 469 | 91.0 |
| C | 15 | 214 | 160949 | 1459.62 | 473 | 477 | 109.9 |
| C | 3 | 233 | 155000 | 1405.51 | 473 | 477 | 109.9 |
| C | 0 | 10 | 38108 | 342.28 | 473 | 477 | 109.9 |
| D | 8 | 195 | 1412095 | 12107.7 | 474 | 461 | 116.6 |
| D | 1 | 52 | 232877 | 1993.45 | 474 | 461 | 116.6 |
| D | 2 | 249 | 134556 | 1150.14 | 474 | 461 | 116.6 |
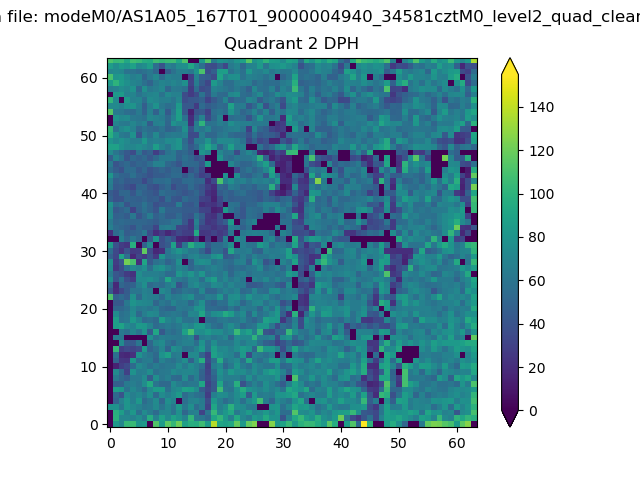
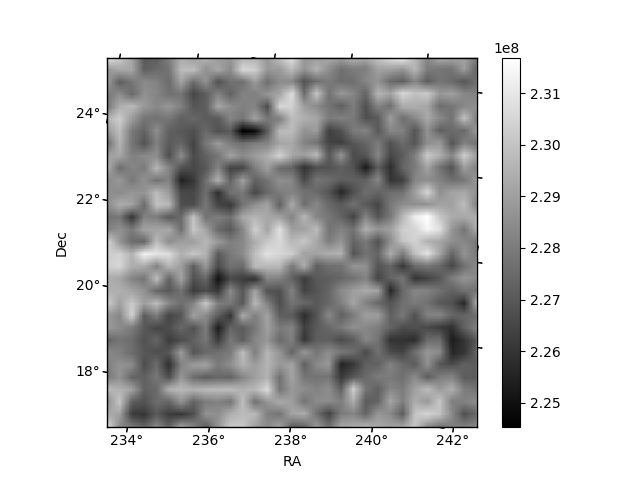
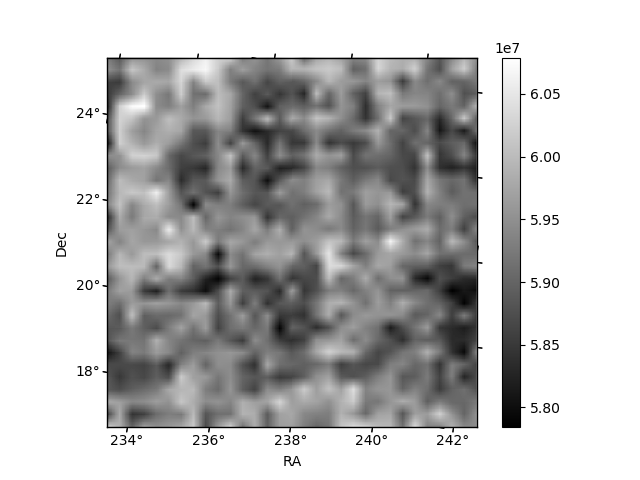
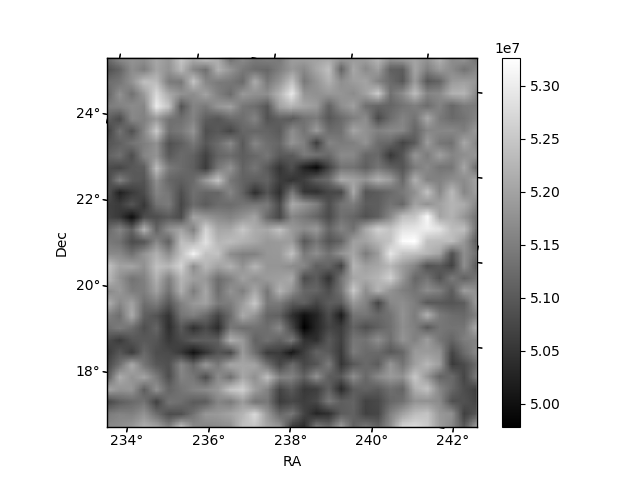
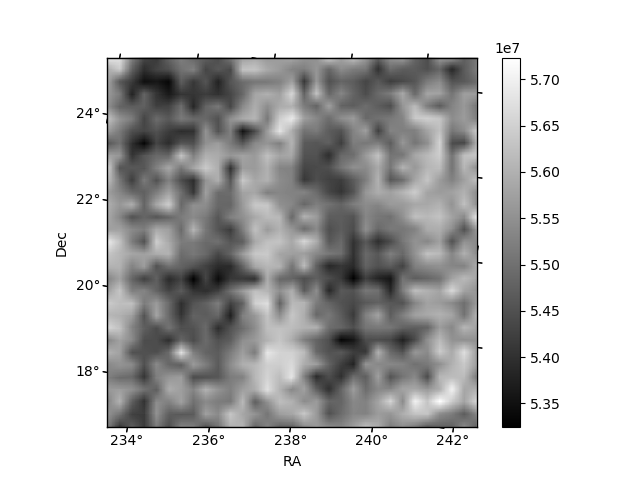
Histogram calculated using DETX and DETY for each event in the final _common_clean file
| Quadrant A | 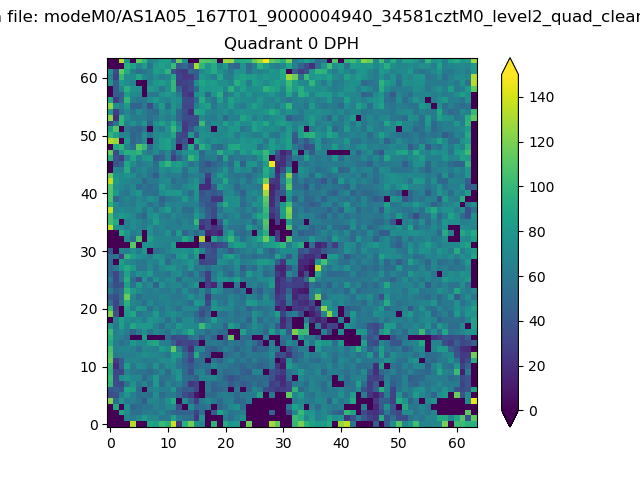 |
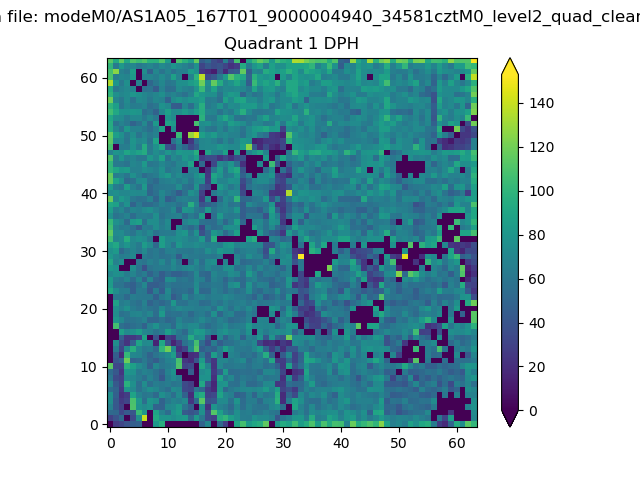 |
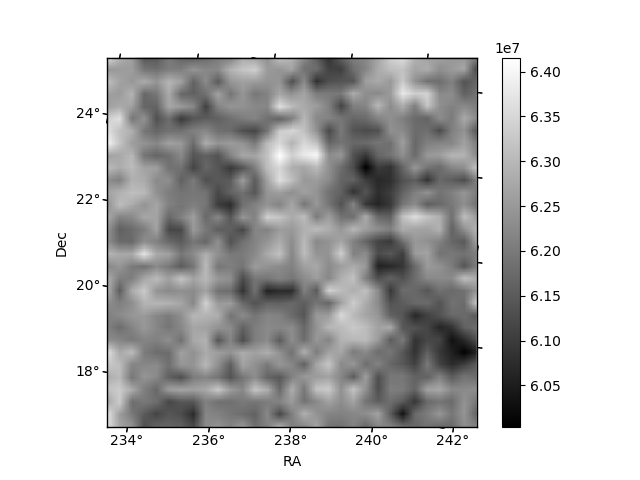
Quadrant B |
|---|---|---|---|
| Quadrant D | 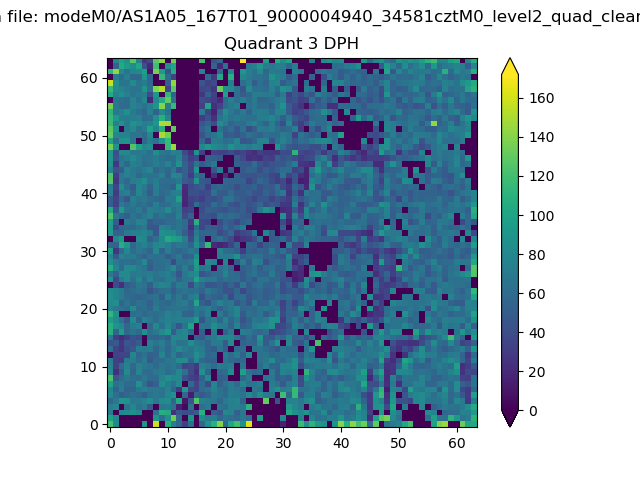 |
 |
Quadrant C |
| Plot type | Count rate plots | Images |
|---|---|---|
| Comparison with Poisson distribution Blue bars denote a histogram of data divided into 1 sec bins. Red curve is a Poisson curve with rate = median count rate of data. |
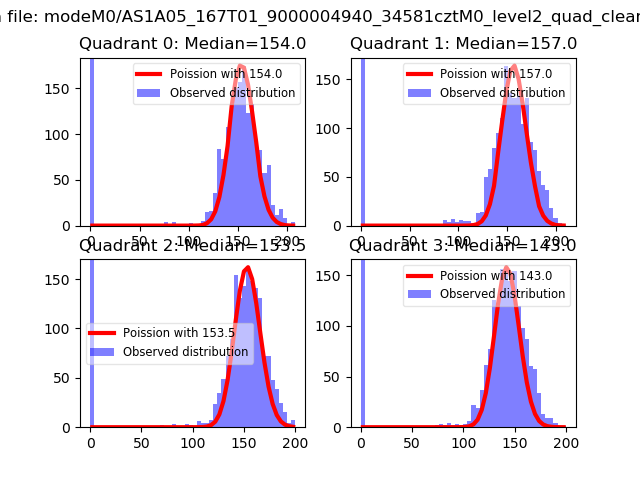 |
 |
| Quadrant-wise count rates Data is divided into 100 sec bins |
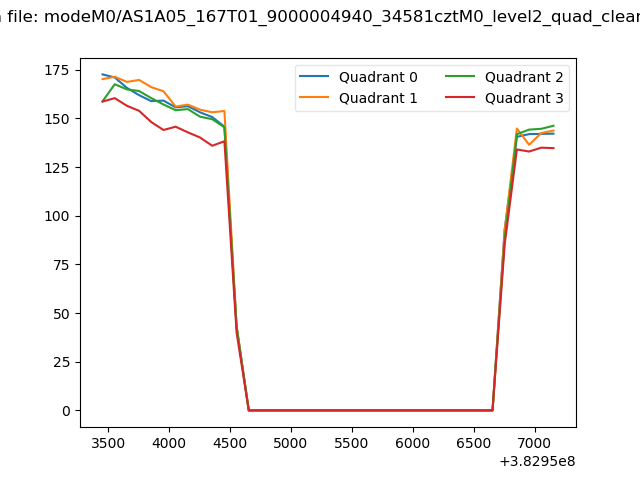 |
|
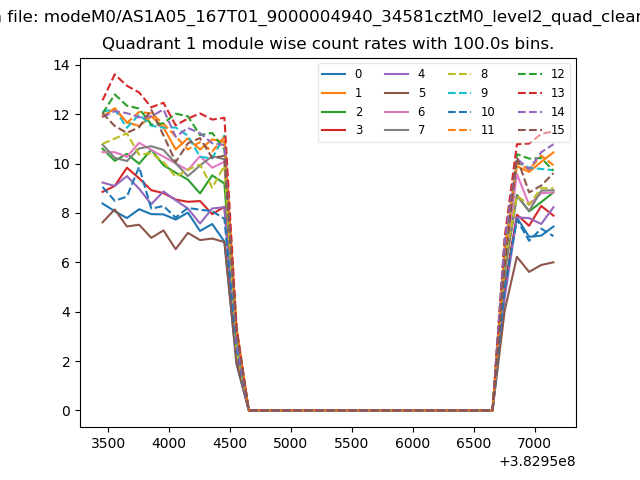
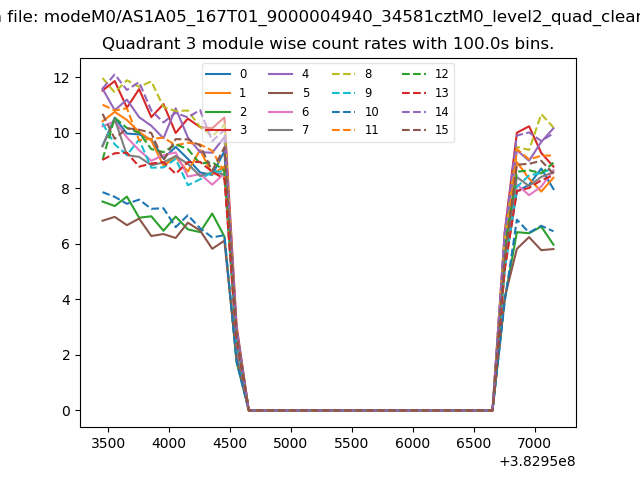
| Module-wise count rates for Quadrant A Data is divided into 100 sec bins |
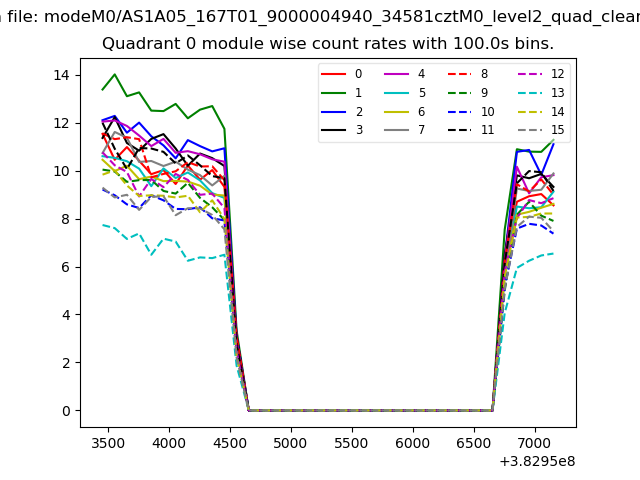 |
 |
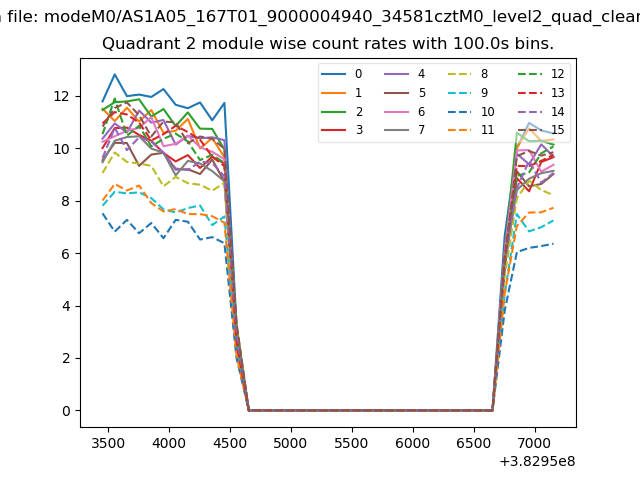
| Module-wise count rates for Quadrant B Data is divided into 100 sec bins |
 |
 |
| Module-wise count rates for Quadrant C Data is divided into 100 sec bins |
 |
 |
| Module-wise count rates for Quadrant D Data is divided into 100 sec bins |
 |
 |
| Parameter | Plot |
|---|---|
| CZT HV Monitor | 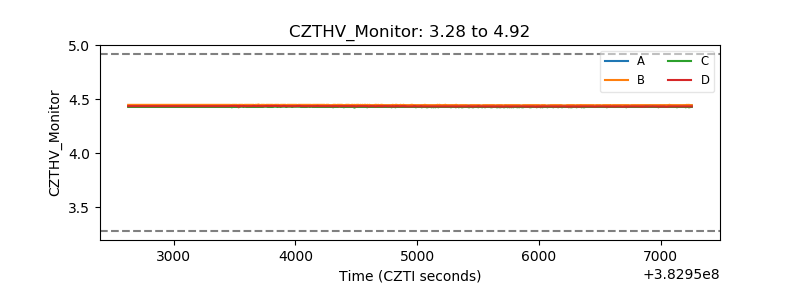 |
| D_VDD | 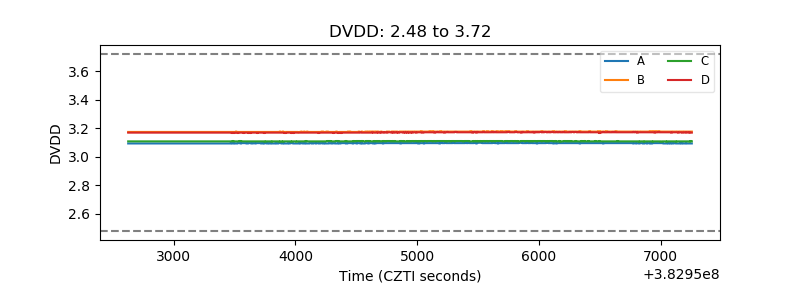 |
| Temperature 1 | 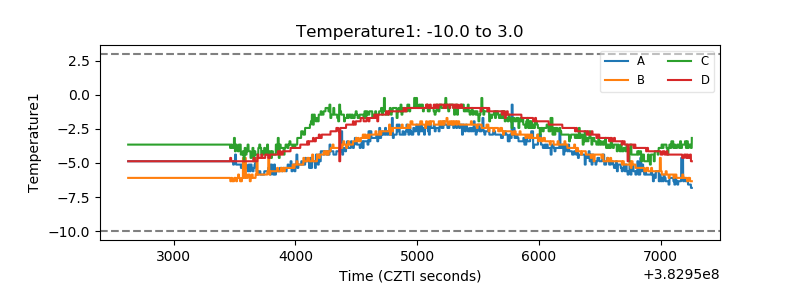 |
| Veto HV Monitor | 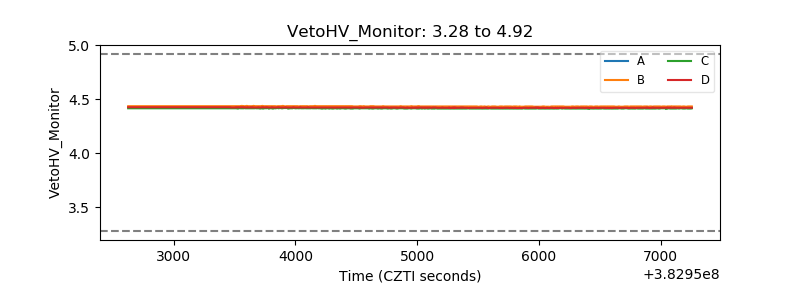 |
| Veto LLD | 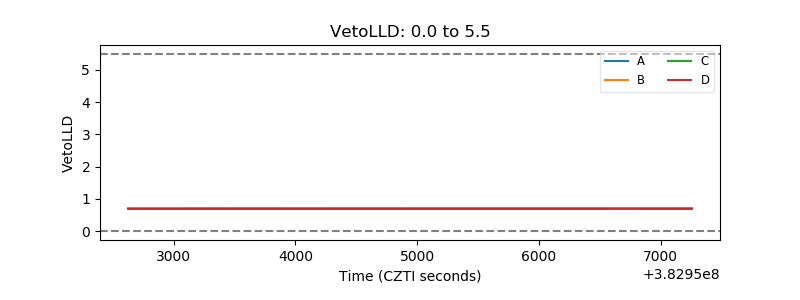 |
| Alpha Counter | 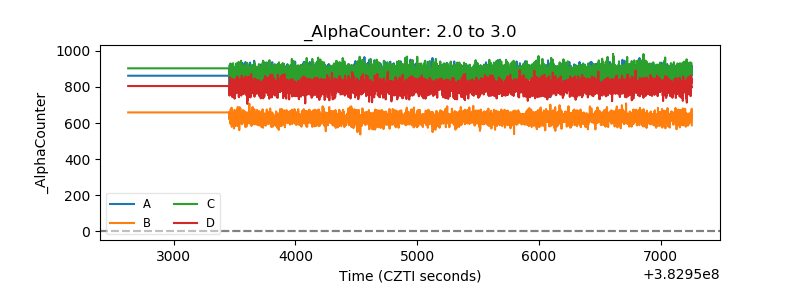 |
| _CPM_Rate | 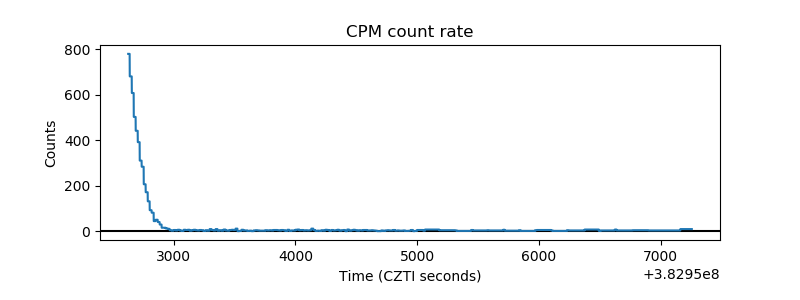 |
| CZT Counter | 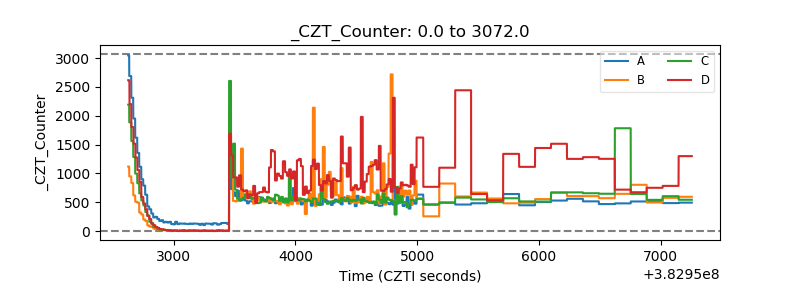 |
| +2.5 Volts monitor | 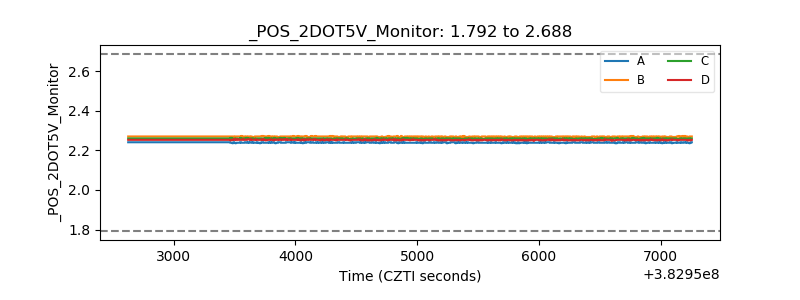 |
| +5 Volts monitor | 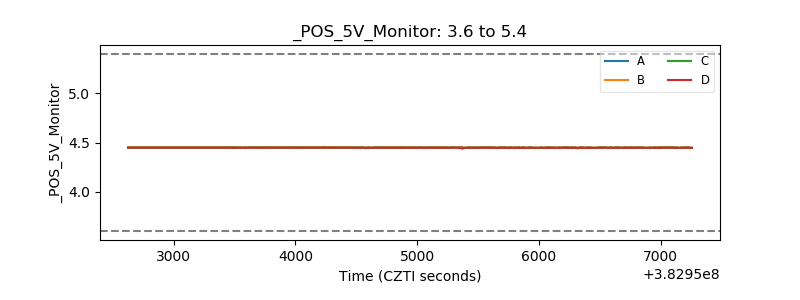 |
| _ROLL_ROT | 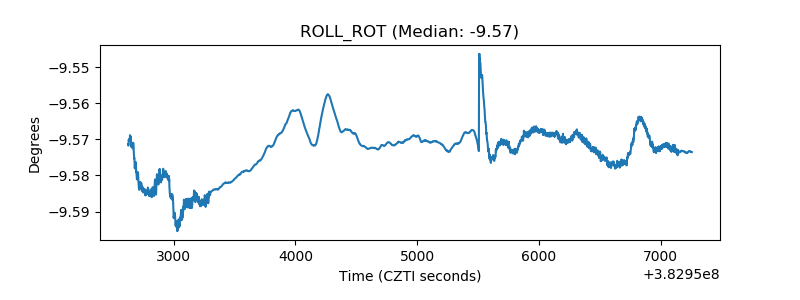 |
| _Roll_DEC | 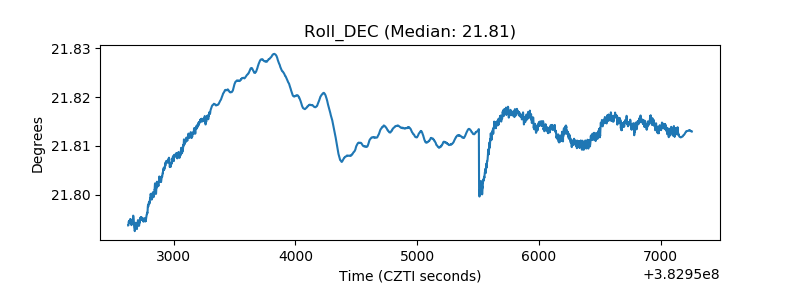 |
| _Roll_RA | 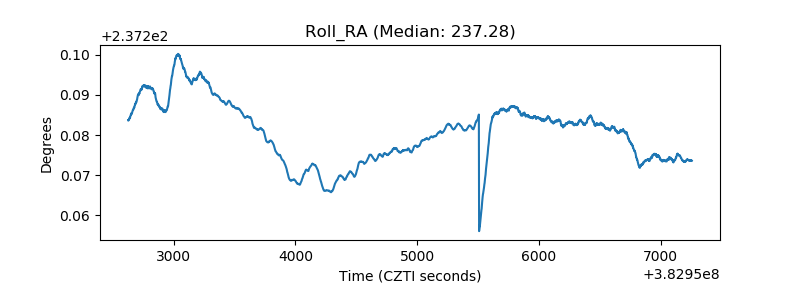 |
| Veto Counter | 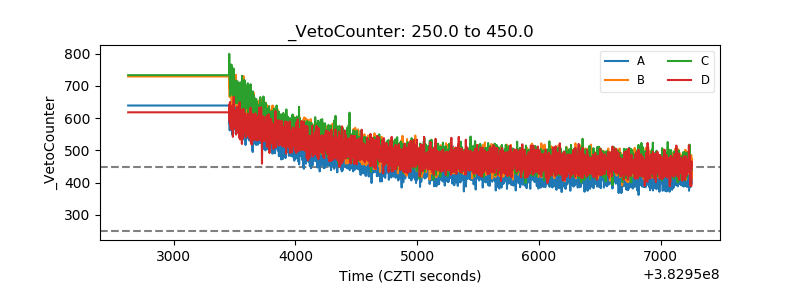 |