| Param | Original file | Final file |
|---|---|---|
| Filename | modeM0/AS1A05_167T01_9000004940_34579cztM0_level2.evt | modeM0/AS1A05_167T01_9000004940_34579cztM0_level2_quad_clean.evt |
| Size (bytes) | 464,667,840 | 72,322,560 |
| Size | 443.1 MB | 69.0 MB |
| Events in quadrant A | 2,666,265 | 456,673 |
| Events in quadrant B | 3,227,454 | 471,258 |
| Events in quadrant C | 2,799,011 | 458,270 |
| Events in quadrant D | 5,007,295 | 419,567 |
| Mode SS | |||
|---|---|---|---|
| Quadrant | BADHDUFLAG | Total packets | Discarded packets |
| A | 0 | 114 | 0 |
| B | 0 | 114 | 0 |
| C | 0 | 114 | 0 |
| D | 0 | 114 | 0 |
| Mode M9 | |||
|---|---|---|---|
| Quadrant | BADHDUFLAG | Total packets | Discarded packets |
| A | 0 | 25 | 0 |
| B | 0 | 25 | 0 |
| C | 0 | 25 | 0 |
| D | 0 | 26 | 0 |
| Mode M0 | |||
|---|---|---|---|
| Quadrant | BADHDUFLAG | Total packets | Discarded packets |
| A | 0 | 11244 | 3 |
| B | 0 | 12971 | 2 |
| C | 0 | 11357 | 2 |
| D | 0 | 18648 | 2 |
| Quadrant | Total seconds | Saturated seconds | Saturation percentage |
|---|---|---|---|
| A | 5481 | 16 | 0.291918% |
| B | 5481 | 127 | 2.317095% |
| C | 5481 | 10 | 0.182448% |
| D | 5481 | 278 | 5.072067% |
Noise dominated data is calculated using 1-second bins in cleaned event files. If a bin has >2000 counts, and if more than 50% of those come from <1% of pixels, then it is considered to be noise-dominated and hence unusable.
| Quadrant | # 1 sec bins | Bins with >0 counts | Bins with >2000 counts | High rate bins dominated by noise | Noise dominated (total time) | Noise dominated (detector-on time) | Marked lightcurve |
|---|---|---|---|---|---|---|---|
| A | 7333 | 5482 | 6 | 6 | 0.08% | 0.11% | 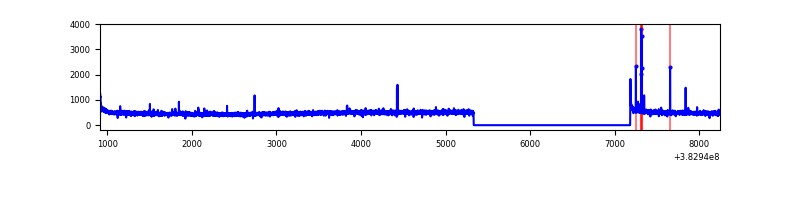 |
| B | 7333 | 5482 | 83 | 83 | 1.13% | 1.51% | 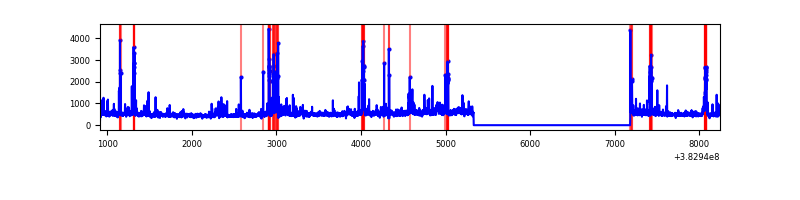 |
| C | 7333 | 5482 | 5 | 5 | 0.07% | 0.09% | 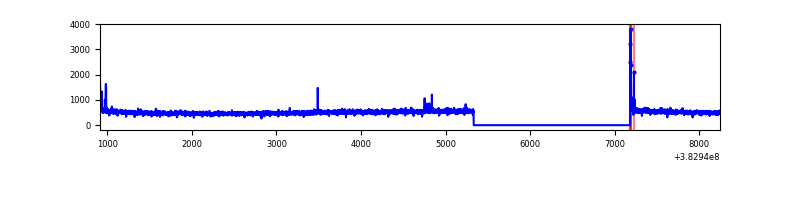 |
| D | 7333 | 5482 | 203 | 203 | 2.77% | 3.70% | 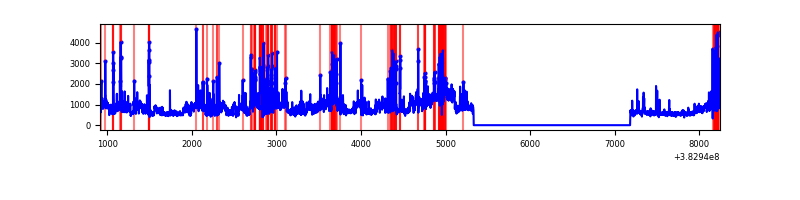 |
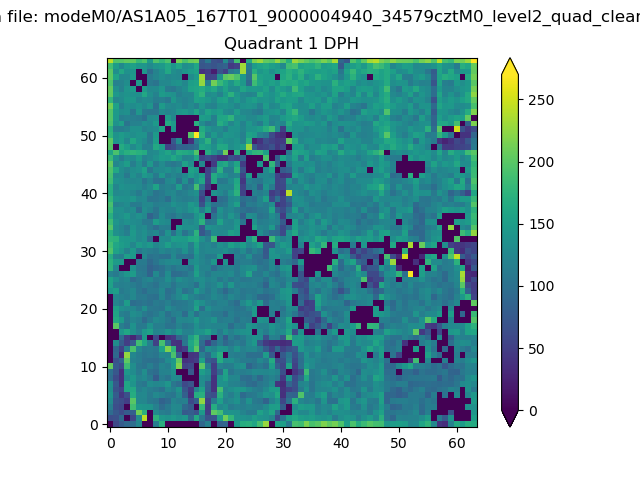
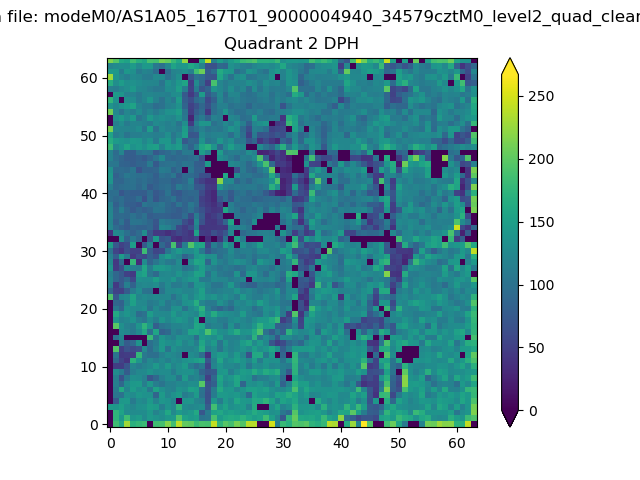
Top three noisy pixels from each quadrant. If the there are fewer than three noisy pixels in the level2.evt file, extra rows are filled as -1
| Pixel properties | Quadrant properties | ||||||
|---|---|---|---|---|---|---|---|
| Quadrant | DetID | PixID | Counts | Sigma | Mean | Median | Sigma |
| A | 10 | 83 | 41694 | 307.5 | 667 | 655 | 133.5 |
| A | 9 | 143 | 34182 | 251.21 | 667 | 655 | 133.5 |
| A | 13 | 6 | 10643 | 74.84 | 667 | 655 | 133.5 |
| B | 5 | 172 | 260631 | 2076.72 | 657 | 642 | 125.2 |
| B | 0 | 229 | 155218 | 1234.71 | 657 | 642 | 125.2 |
| B | 0 | 245 | 119686 | 950.89 | 657 | 642 | 125.2 |
| C | 15 | 214 | 232661 | 1554.36 | 644 | 649 | 149.3 |
| C | 0 | 10 | 40861 | 269.4 | 644 | 649 | 149.3 |
| C | 3 | 233 | 7716 | 47.35 | 644 | 649 | 149.3 |
| D | 8 | 195 | 1573853 | 10196.74 | 631 | 615 | 154.3 |
| D | 1 | 47 | 286305 | 1851.66 | 631 | 615 | 154.3 |
| D | 12 | 235 | 194798 | 1258.57 | 631 | 615 | 154.3 |
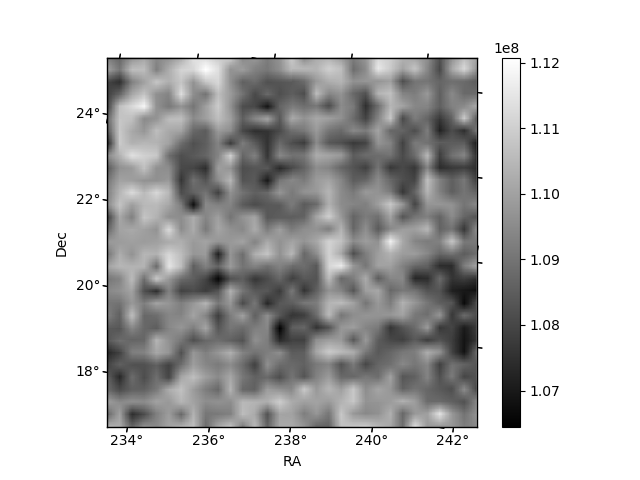
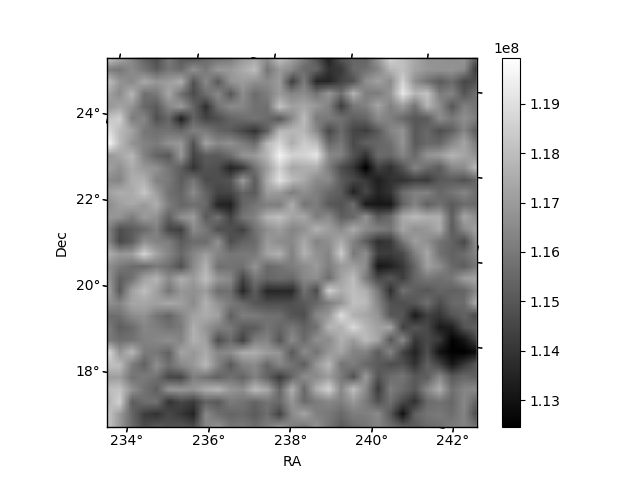
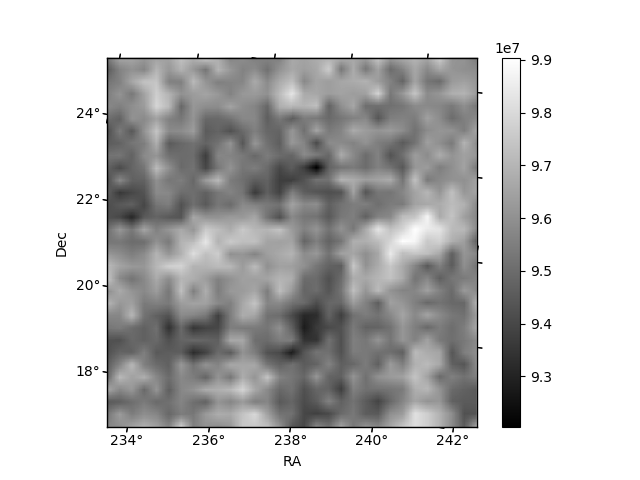
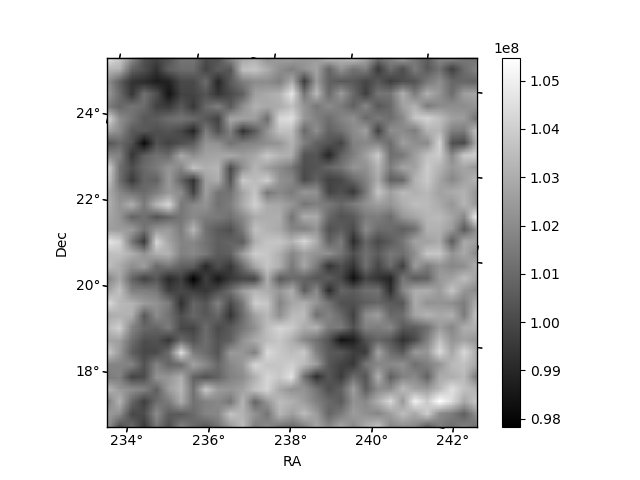
Histogram calculated using DETX and DETY for each event in the final _common_clean file
| Quadrant A | 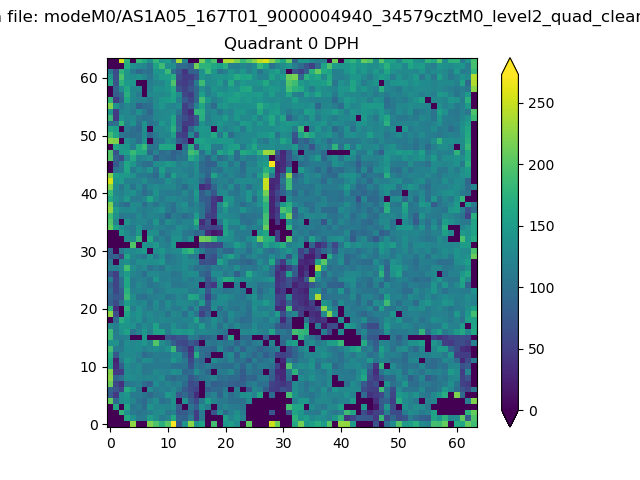 |
 |
Quadrant B |
|---|---|---|---|
| Quadrant D | 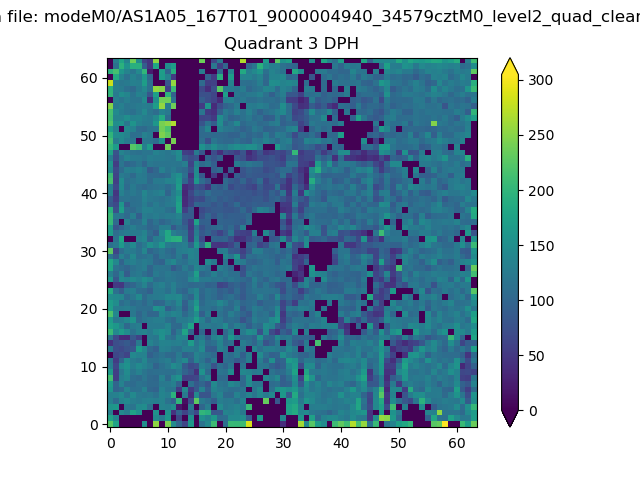 |
 |
Quadrant C |
| Plot type | Count rate plots | Images |
|---|---|---|
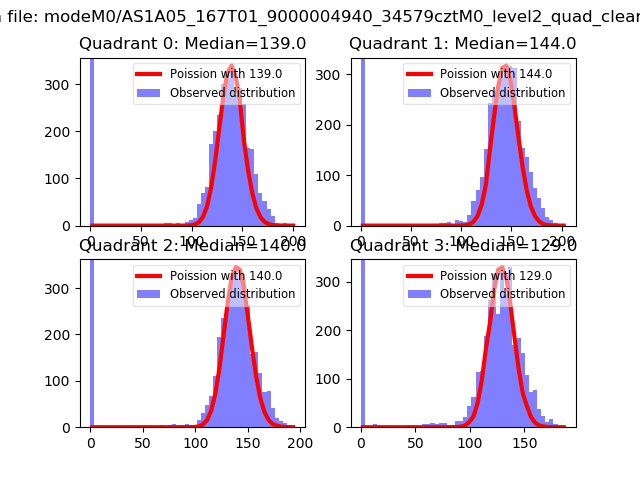
| Comparison with Poisson distribution Blue bars denote a histogram of data divided into 1 sec bins. Red curve is a Poisson curve with rate = median count rate of data. |
 |
 |
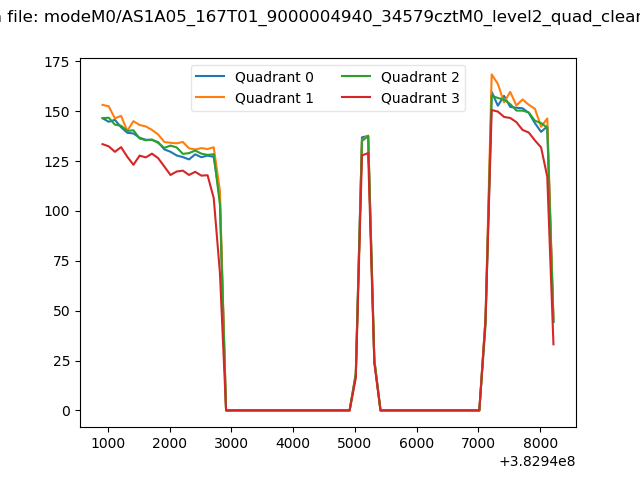
| Quadrant-wise count rates Data is divided into 100 sec bins |
 |
|
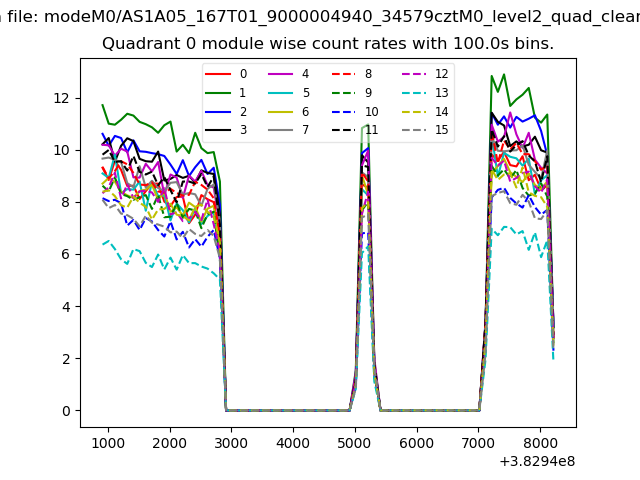
| Module-wise count rates for Quadrant A Data is divided into 100 sec bins |
 |
 |
| Module-wise count rates for Quadrant B Data is divided into 100 sec bins |
 |
 |
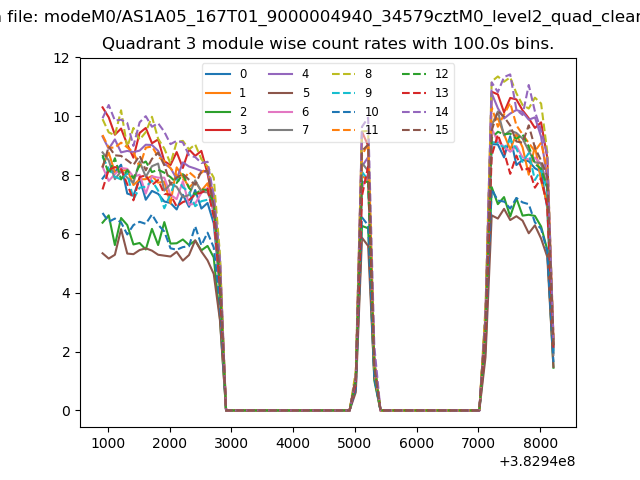
| Module-wise count rates for Quadrant C Data is divided into 100 sec bins |
 |
 |
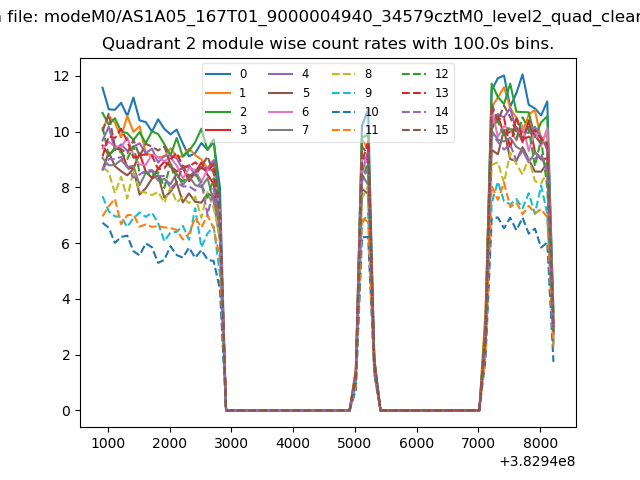
| Module-wise count rates for Quadrant D Data is divided into 100 sec bins |
 |
 |
| Parameter | Plot |
|---|---|
| CZT HV Monitor | 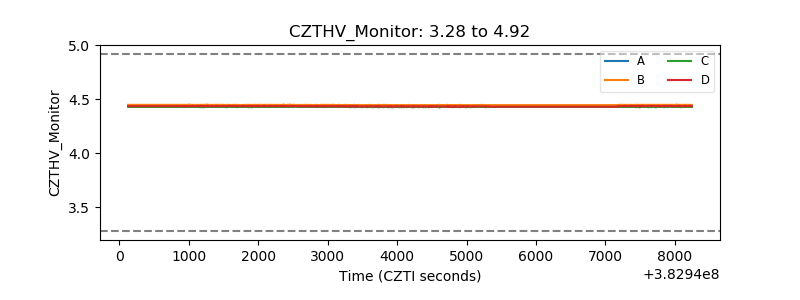 |
| D_VDD | 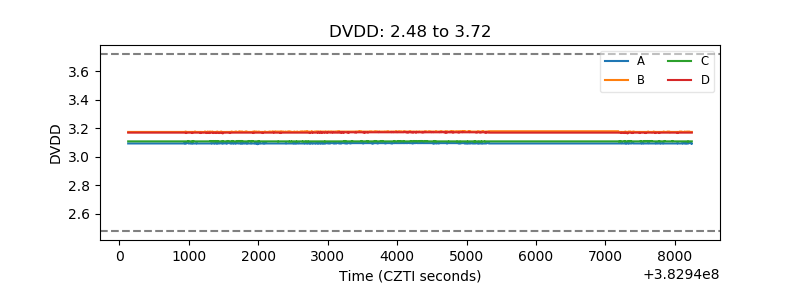 |
| Temperature 1 | 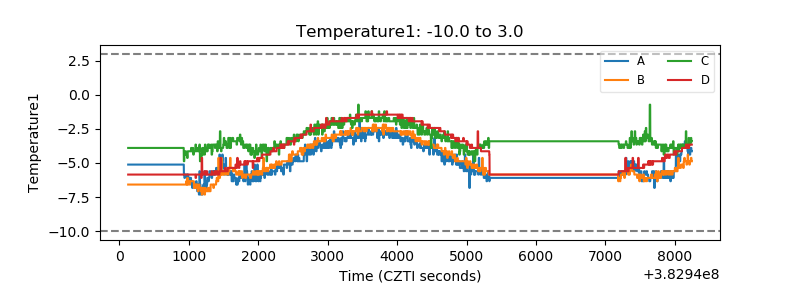 |
| Veto HV Monitor | 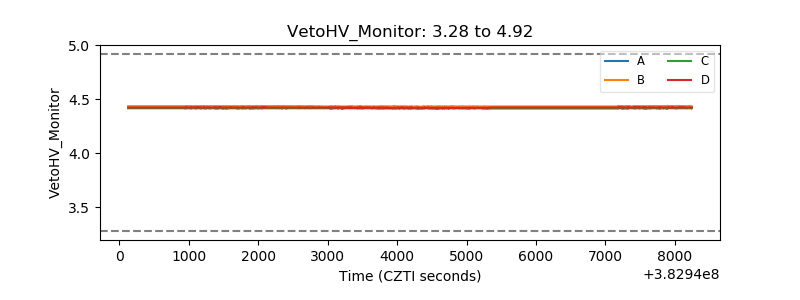 |
| Veto LLD | 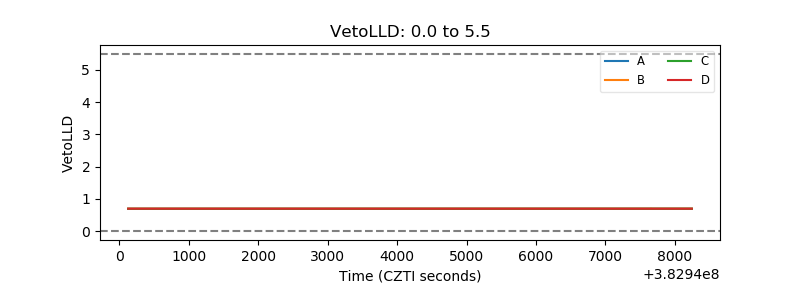 |
| Alpha Counter | 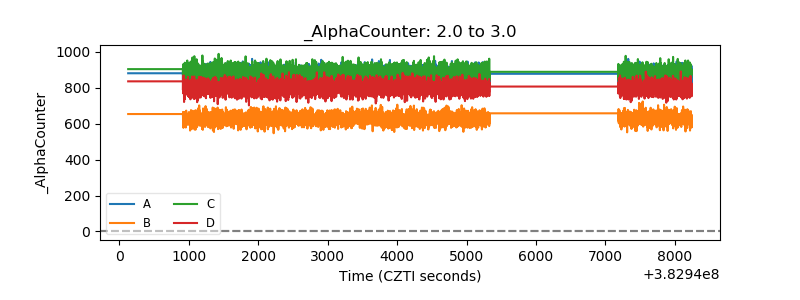 |
| _CPM_Rate | 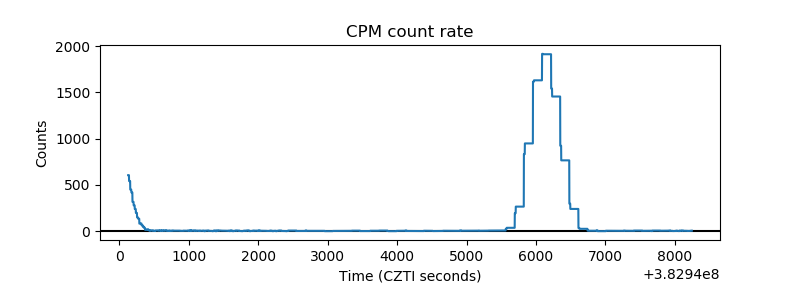 |
| CZT Counter | 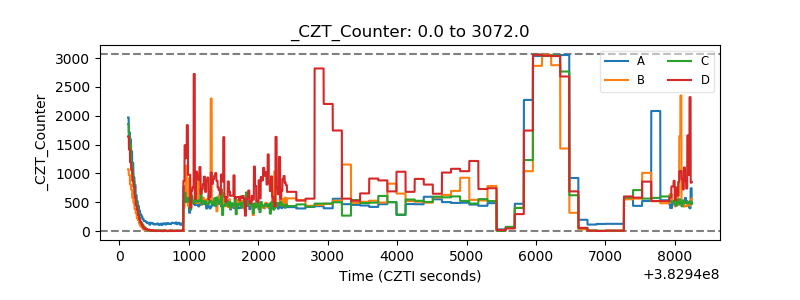 |
| +2.5 Volts monitor | 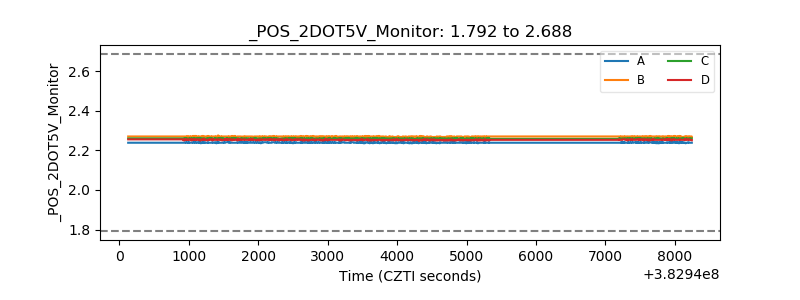 |
| +5 Volts monitor | 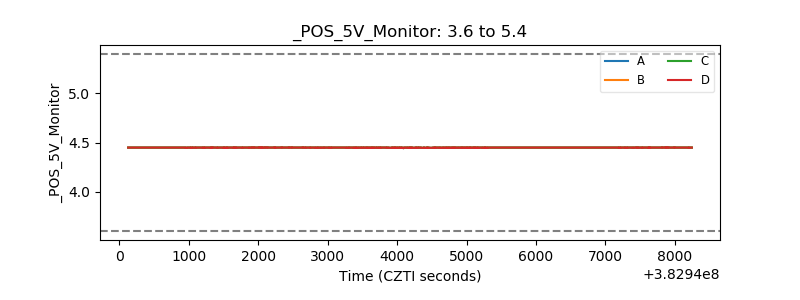 |
| _ROLL_ROT | 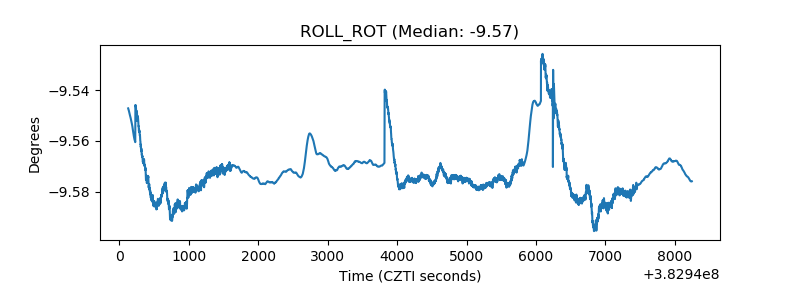 |
| _Roll_DEC | 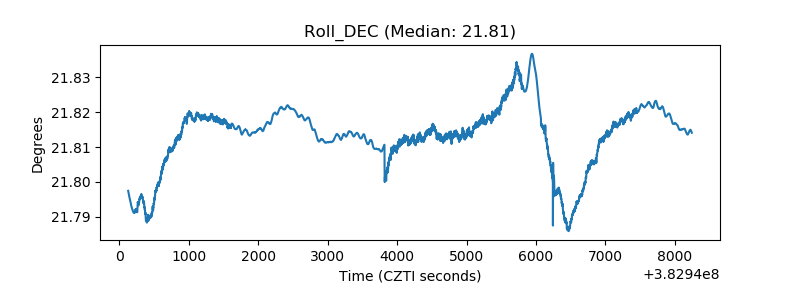 |
| _Roll_RA | 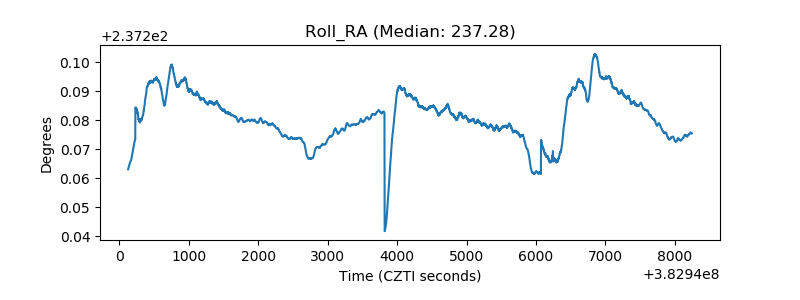 |
| Veto Counter | 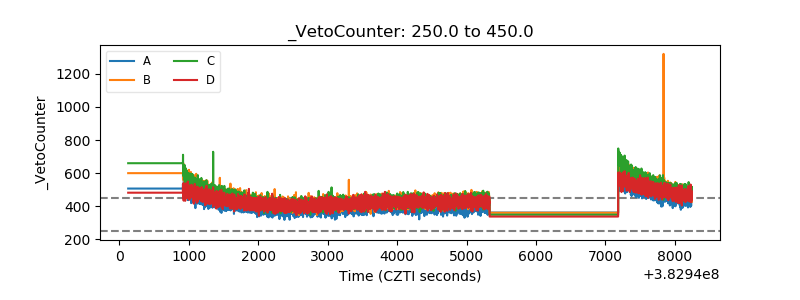 |