| Param | Original file | Final file |
|---|---|---|
| Filename | modeM0/AS1A05_167T01_9000004940_34568cztM0_level2.evt | modeM0/AS1A05_167T01_9000004940_34568cztM0_level2_quad_clean.evt |
| Size (bytes) | 506,185,920 | 47,445,120 |
| Size | 482.7 MB | 45.2 MB |
| Events in quadrant A | 3,319,220 | 276,896 |
| Events in quadrant B | 3,530,952 | 276,497 |
| Events in quadrant C | 2,779,396 | 282,109 |
| Events in quadrant D | 5,365,965 | 254,016 |
| Mode SS | |||
|---|---|---|---|
| Quadrant | BADHDUFLAG | Total packets | Discarded packets |
| A | 0 | 102 | 0 |
| B | 0 | 102 | 0 |
| C | 0 | 102 | 0 |
| D | 0 | 102 | 0 |
| Mode M9 | |||
|---|---|---|---|
| Quadrant | BADHDUFLAG | Total packets | Discarded packets |
| A | 0 | 30 | 0 |
| B | 0 | 30 | 0 |
| C | 0 | 30 | 0 |
| D | 0 | 31 | 0 |
| Mode M0 | |||
|---|---|---|---|
| Quadrant | BADHDUFLAG | Total packets | Discarded packets |
| A | 0 | 12815 | 3 |
| B | 0 | 13563 | 2 |
| C | 0 | 10862 | 2 |
| D | 0 | 19641 | 2 |
| Quadrant | Total seconds | Saturated seconds | Saturation percentage |
|---|---|---|---|
| A | 4936 | 156 | 3.160454% |
| B | 4936 | 253 | 5.125608% |
| C | 4936 | 28 | 0.567261% |
| D | 4936 | 386 | 7.820097% |
Noise dominated data is calculated using 1-second bins in cleaned event files. If a bin has >2000 counts, and if more than 50% of those come from <1% of pixels, then it is considered to be noise-dominated and hence unusable.
| Quadrant | # 1 sec bins | Bins with >0 counts | Bins with >2000 counts | High rate bins dominated by noise | Noise dominated (total time) | Noise dominated (detector-on time) | Marked lightcurve |
|---|---|---|---|---|---|---|---|
| A | 7088 | 4937 | 36 | 36 | 0.51% | 0.73% | 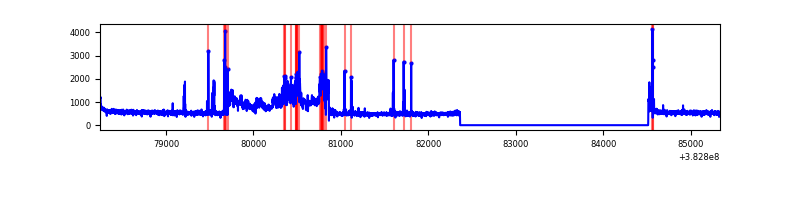 |
| B | 7088 | 4937 | 174 | 174 | 2.45% | 3.52% | 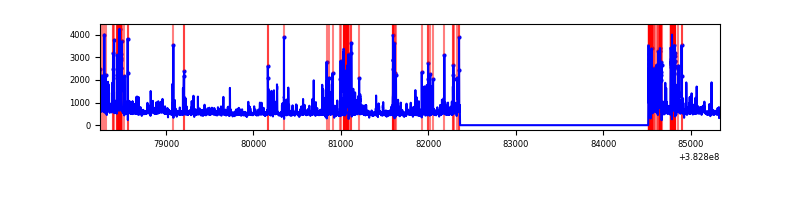 |
| C | 7088 | 4937 | 23 | 23 | 0.32% | 0.47% | 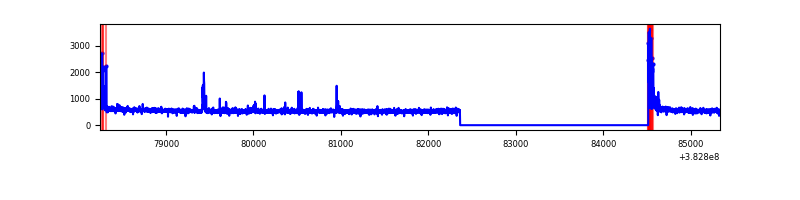 |
| D | 7088 | 4937 | 324 | 324 | 4.57% | 6.56% | 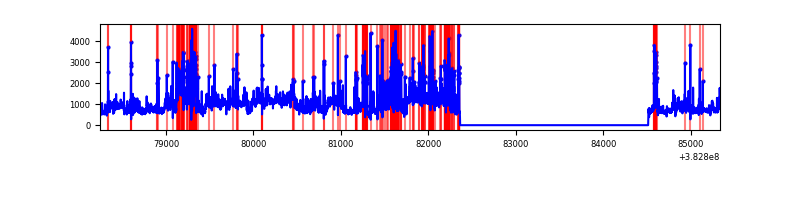 |
Top three noisy pixels from each quadrant. If the there are fewer than three noisy pixels in the level2.evt file, extra rows are filled as -1
| Pixel properties | Quadrant properties | ||||||
|---|---|---|---|---|---|---|---|
| Quadrant | DetID | PixID | Counts | Sigma | Mean | Median | Sigma |
| A | 15 | 169 | 813201 | 6422.41 | 634 | 623 | 126.5 |
| A | 10 | 83 | 40708 | 316.82 | 634 | 623 | 126.5 |
| A | 13 | 254 | 9561 | 70.64 | 634 | 623 | 126.5 |
| B | 5 | 172 | 498592 | 4271.3 | 617 | 603 | 116.6 |
| B | 5 | 255 | 204705 | 1750.6 | 617 | 603 | 116.6 |
| B | 15 | 35 | 125903 | 1074.71 | 617 | 603 | 116.6 |
| C | 15 | 214 | 209676 | 1460.4 | 619 | 625 | 143.1 |
| C | 0 | 10 | 101794 | 706.75 | 619 | 625 | 143.1 |
| C | 2 | 16 | 35127 | 241.03 | 619 | 625 | 143.1 |
| D | 8 | 195 | 1531493 | 10374.09 | 608 | 590 | 147.6 |
| D | 7 | 80 | 611372 | 4138.93 | 608 | 590 | 147.6 |
| D | 2 | 250 | 294795 | 1993.67 | 608 | 590 | 147.6 |
Histogram calculated using DETX and DETY for each event in the final _common_clean file
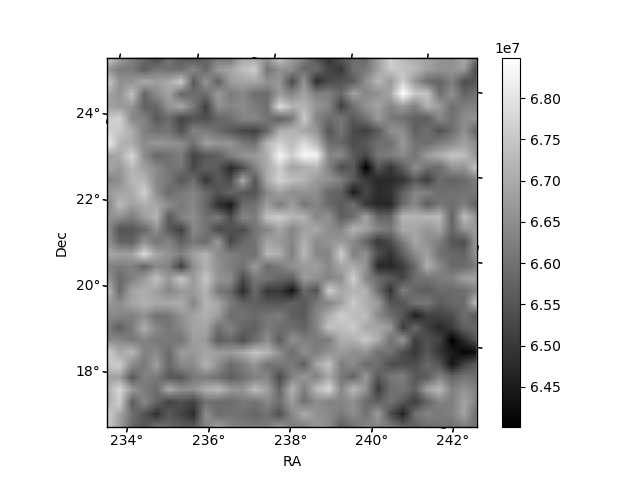
| Quadrant A | 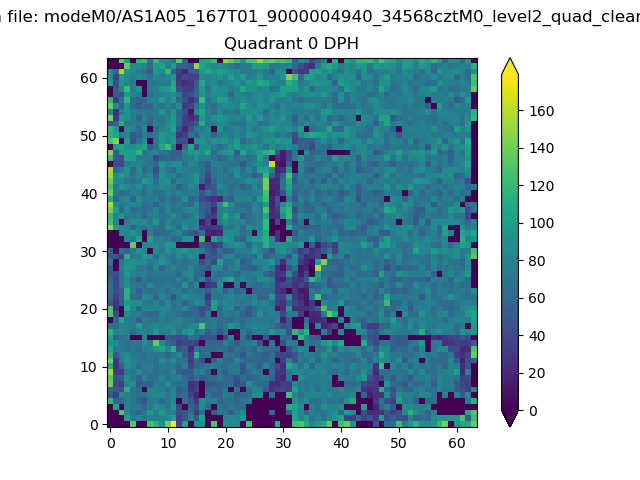 |
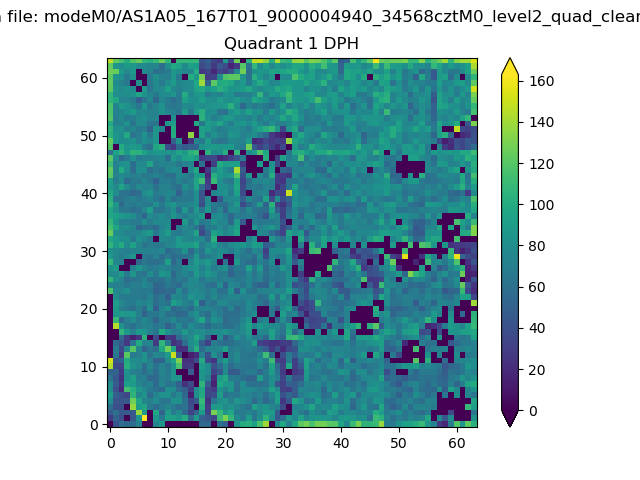 |
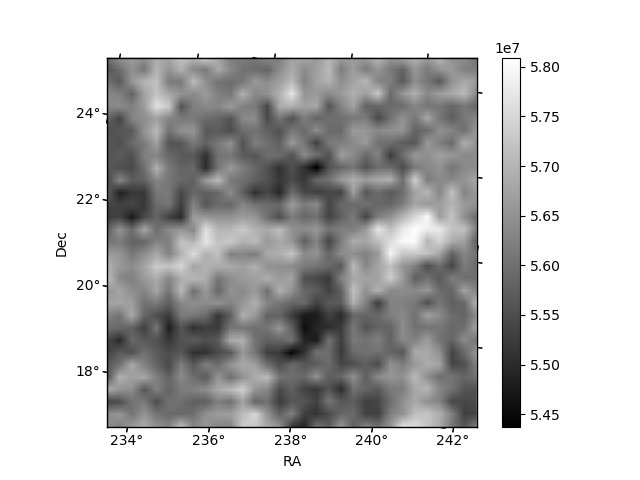
Quadrant B |
|---|---|---|---|
| Quadrant D | 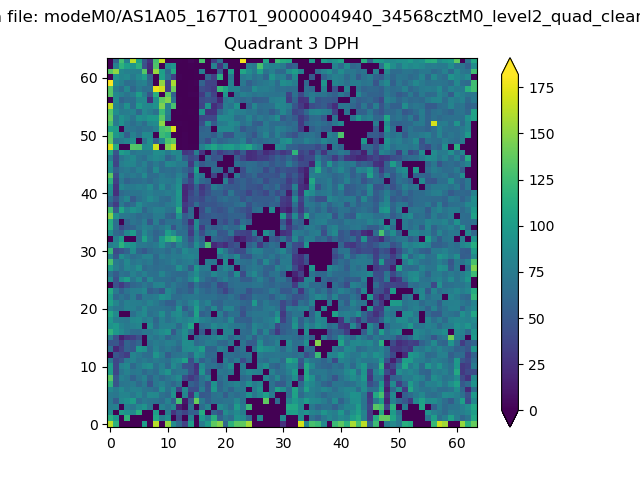 |
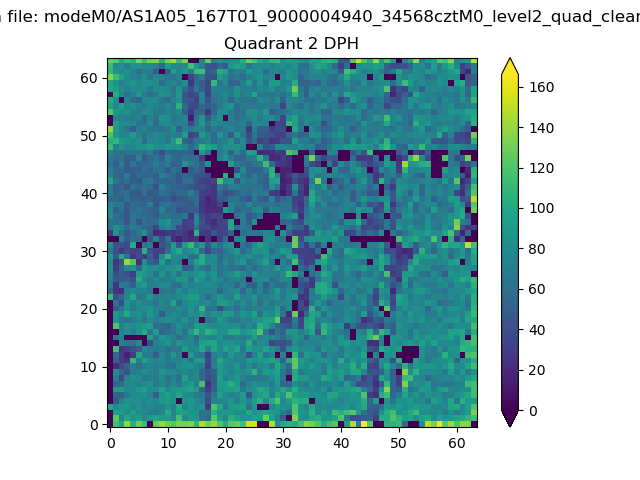 |
Quadrant C |
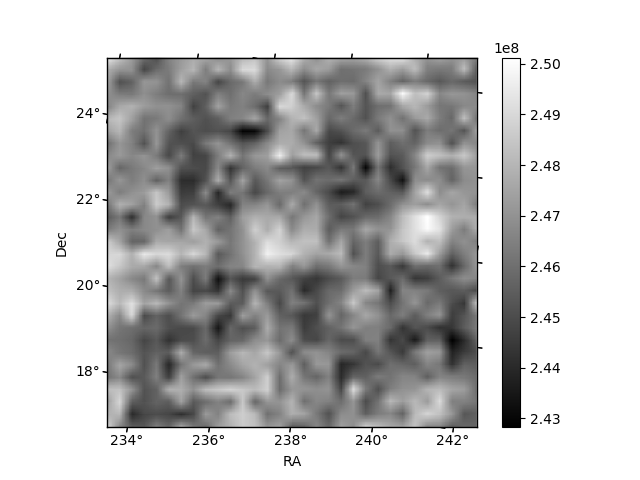
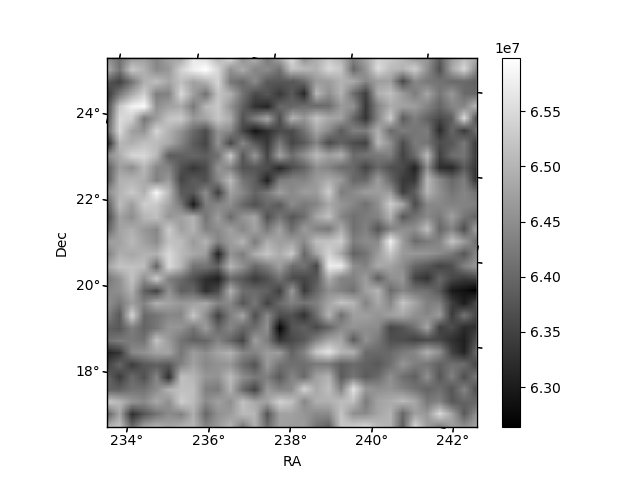
| Plot type | Count rate plots | Images |
|---|---|---|
| Comparison with Poisson distribution Blue bars denote a histogram of data divided into 1 sec bins. Red curve is a Poisson curve with rate = median count rate of data. |
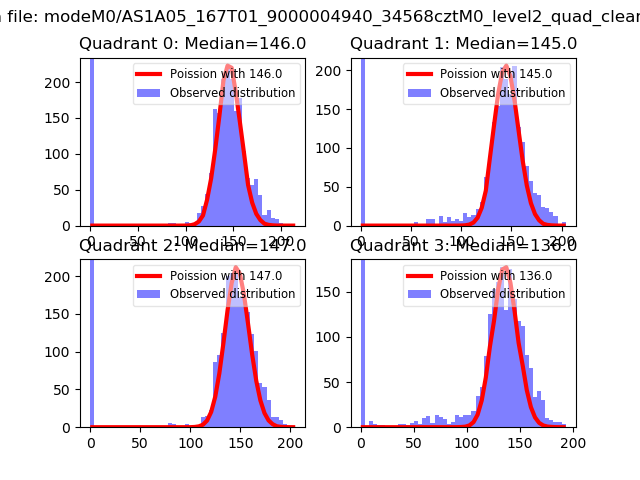 |
 |
| Quadrant-wise count rates Data is divided into 100 sec bins |
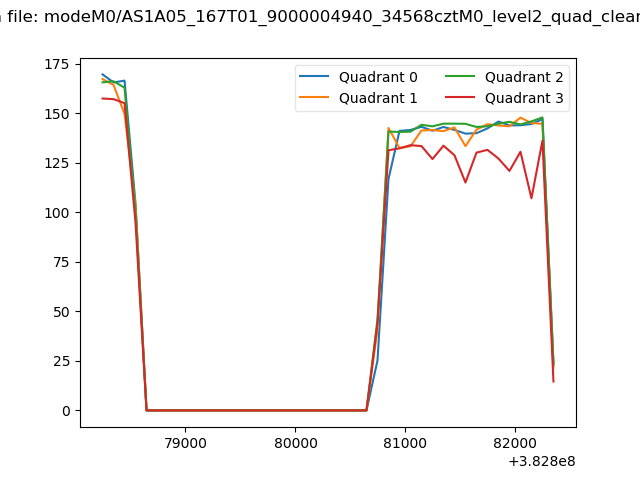 |
|
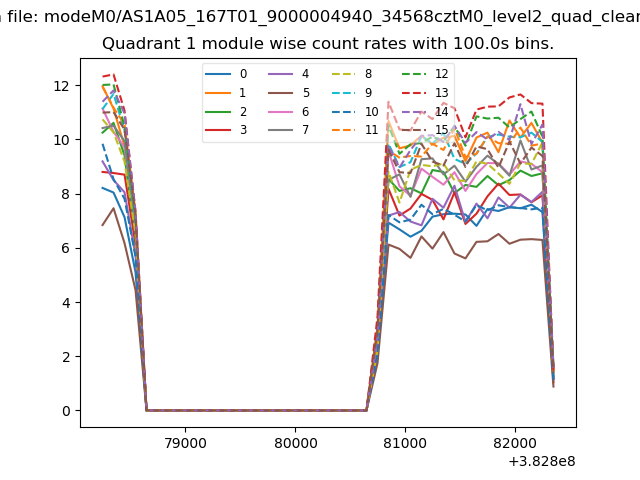
| Module-wise count rates for Quadrant A Data is divided into 100 sec bins |
 |
 |
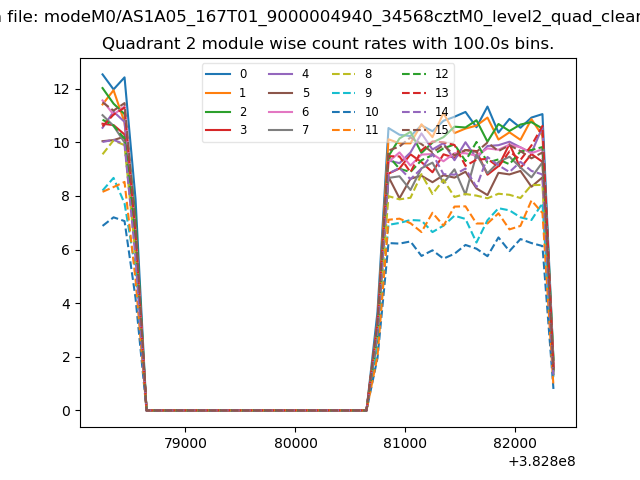
| Module-wise count rates for Quadrant B Data is divided into 100 sec bins |
 |
 |
| Module-wise count rates for Quadrant C Data is divided into 100 sec bins |
 |
 |
| Module-wise count rates for Quadrant D Data is divided into 100 sec bins |
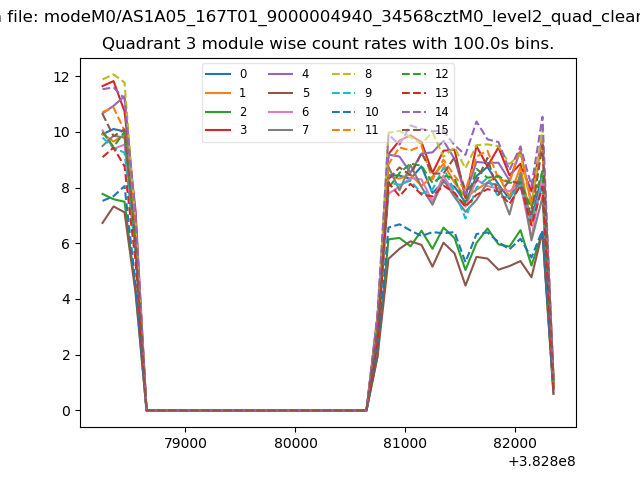 |
 |
| Parameter | Plot |
|---|---|
| CZT HV Monitor | 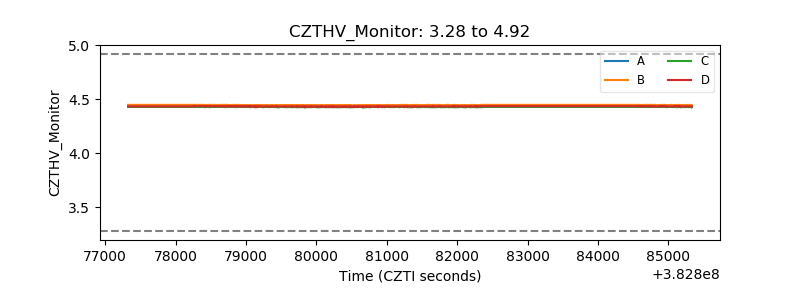 |
| D_VDD | 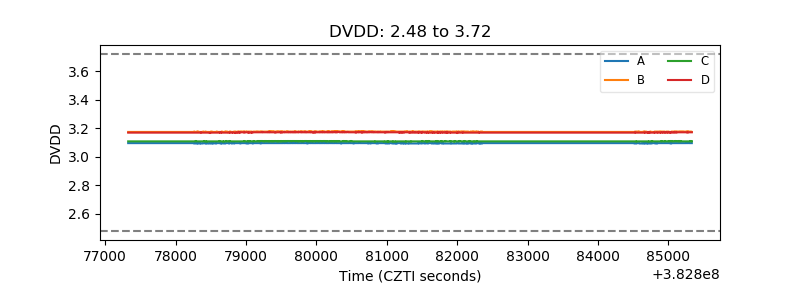 |
| Temperature 1 | 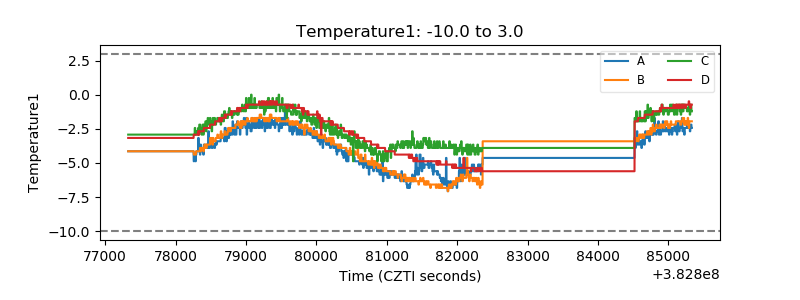 |
| Veto HV Monitor | 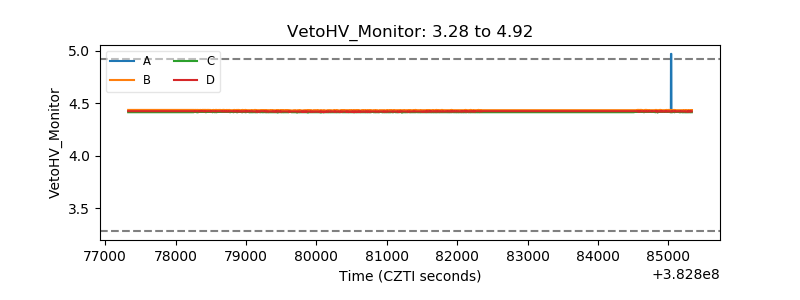 |
| Veto LLD | 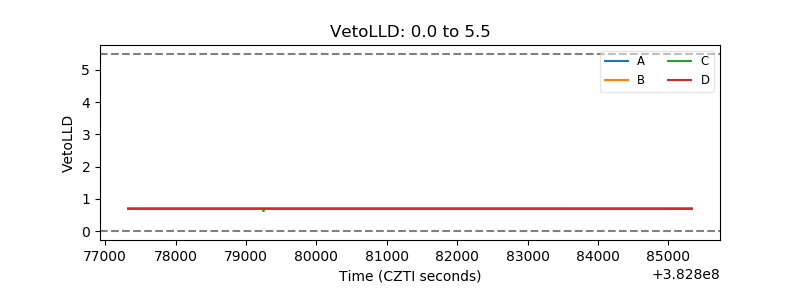 |
| Alpha Counter | 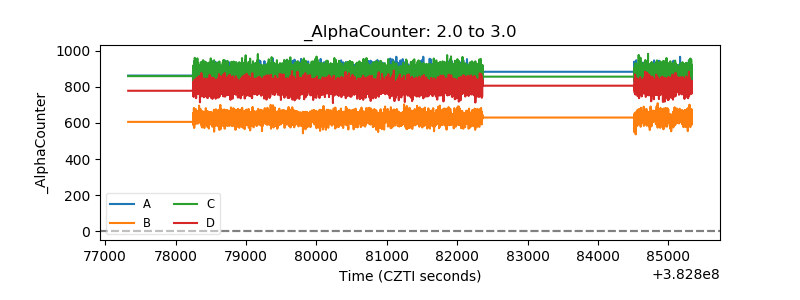 |
| _CPM_Rate | 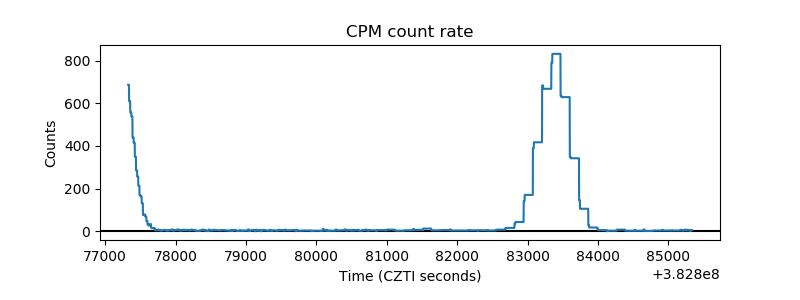 |
| CZT Counter | 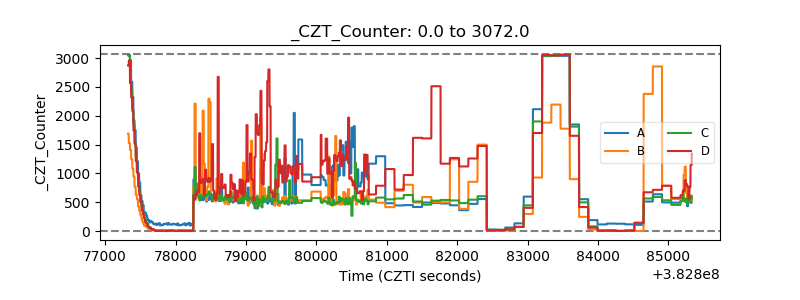 |
| +2.5 Volts monitor | 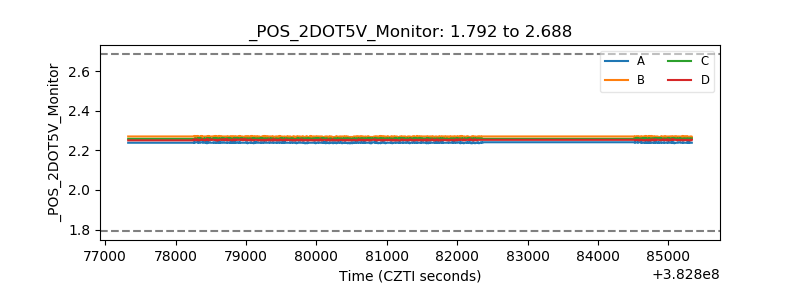 |
| +5 Volts monitor | 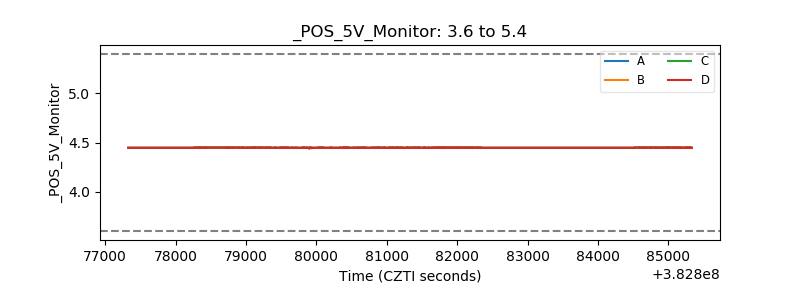 |
| _ROLL_ROT | 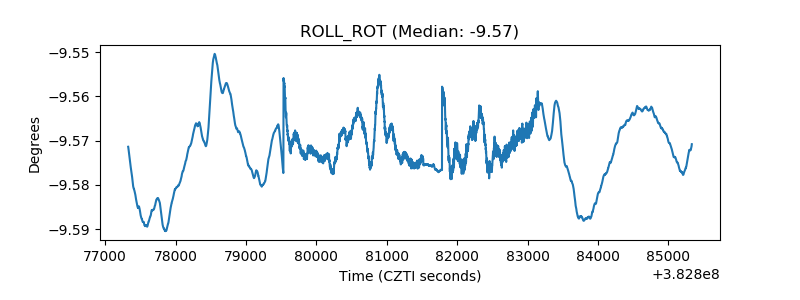 |
| _Roll_DEC | 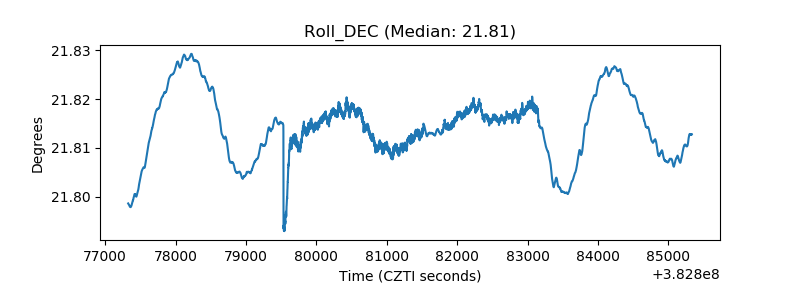 |
| _Roll_RA | 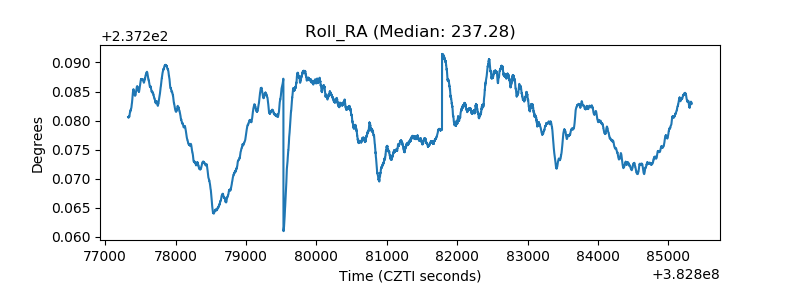 |
| Veto Counter | 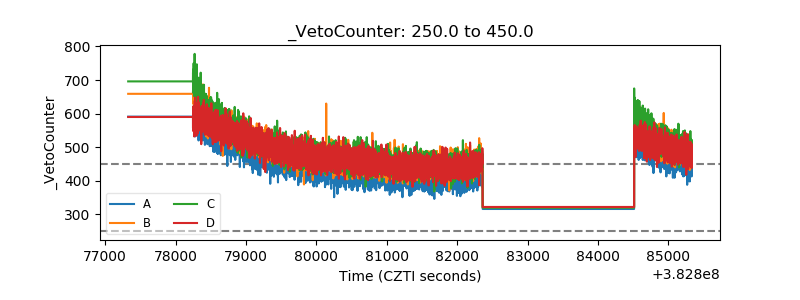 |