| Param | Original file | Final file |
|---|---|---|
| Filename | modeM0/AS1A05_097T01_9000004936_34555cztM0_level2.evt | modeM0/AS1A05_097T01_9000004936_34555cztM0_level2_quad_clean.evt |
| Size (bytes) | 745,444,800 | 77,832,000 |
| Size | 710.9 MB | 74.2 MB |
| Events in quadrant A | 4,102,924 | 470,363 |
| Events in quadrant B | 5,262,064 | 453,111 |
| Events in quadrant C | 4,371,669 | 467,290 |
| Events in quadrant D | 8,319,667 | 430,049 |
| Mode M0 | |||
|---|---|---|---|
| Quadrant | BADHDUFLAG | Total packets | Discarded packets |
| A | 0 | 16460 | 1 |
| B | 0 | 20162 | 1 |
| C | 0 | 17470 | 1 |
| D | 0 | 30509 | 1 |
| Mode SS | |||
|---|---|---|---|
| Quadrant | BADHDUFLAG | Total packets | Discarded packets |
| A | 0 | 154 | 0 |
| B | 0 | 154 | 0 |
| C | 0 | 154 | 0 |
| D | 0 | 154 | 0 |
| Mode M9 | |||
|---|---|---|---|
| Quadrant | BADHDUFLAG | Total packets | Discarded packets |
| A | 0 | 21 | 0 |
| B | 0 | 21 | 0 |
| C | 0 | 21 | 0 |
| D | 0 | 21 | 0 |
| Quadrant | Total seconds | Saturated seconds | Saturation percentage |
|---|---|---|---|
| A | 7710 | 23 | 0.298314% |
| B | 7710 | 343 | 4.448768% |
| C | 7710 | 16 | 0.207523% |
| D | 7710 | 329 | 4.267185% |
Noise dominated data is calculated using 1-second bins in cleaned event files. If a bin has >2000 counts, and if more than 50% of those come from <1% of pixels, then it is considered to be noise-dominated and hence unusable.
| Quadrant | # 1 sec bins | Bins with >0 counts | Bins with >2000 counts | High rate bins dominated by noise | Noise dominated (total time) | Noise dominated (detector-on time) | Marked lightcurve |
|---|---|---|---|---|---|---|---|
| A | 9773 | 7711 | 11 | 11 | 0.11% | 0.14% | 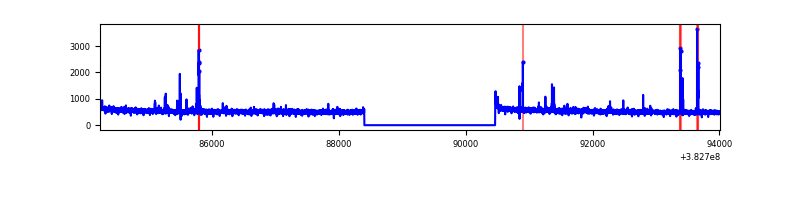 |
| B | 9773 | 7711 | 216 | 216 | 2.21% | 2.80% | 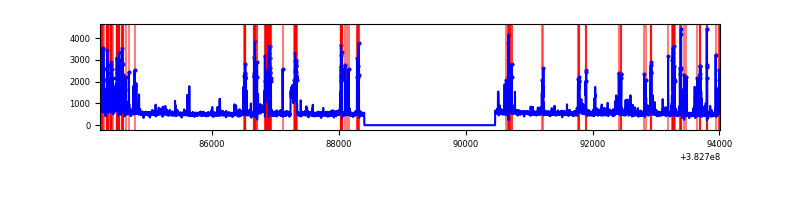 |
| C | 9773 | 7711 | 11 | 11 | 0.11% | 0.14% | 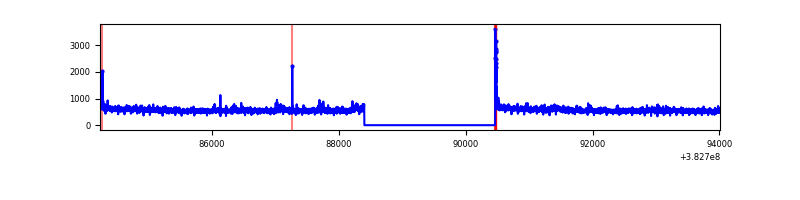 |
| D | 9773 | 7711 | 256 | 256 | 2.62% | 3.32% | 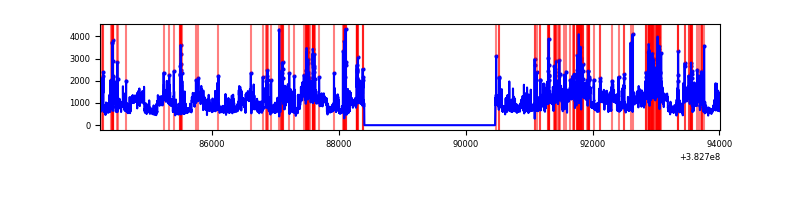 |
Top three noisy pixels from each quadrant. If the there are fewer than three noisy pixels in the level2.evt file, extra rows are filled as -1
| Pixel properties | Quadrant properties | ||||||
|---|---|---|---|---|---|---|---|
| Quadrant | DetID | PixID | Counts | Sigma | Mean | Median | Sigma |
| A | 9 | 143 | 90657 | 443.2 | 1025 | 1007 | 202.3 |
| A | 10 | 83 | 38047 | 183.11 | 1025 | 1007 | 202.3 |
| A | 13 | 6 | 13425 | 61.39 | 1025 | 1007 | 202.3 |
| B | 5 | 172 | 1106238 | 6004.2 | 991 | 969 | 184.1 |
| B | 0 | 245 | 70637 | 378.46 | 991 | 969 | 184.1 |
| B | 4 | 232 | 69114 | 370.19 | 991 | 969 | 184.1 |
| C | 15 | 214 | 321694 | 1405.28 | 992 | 1002 | 228.2 |
| C | 14 | 67 | 113411 | 492.58 | 992 | 1002 | 228.2 |
| C | 0 | 10 | 49221 | 211.3 | 992 | 1002 | 228.2 |
| D | 8 | 195 | 3044526 | 12570.18 | 987 | 964 | 242.1 |
| D | 2 | 250 | 467886 | 1928.43 | 987 | 964 | 242.1 |
| D | 1 | 47 | 289096 | 1190.01 | 987 | 964 | 242.1 |
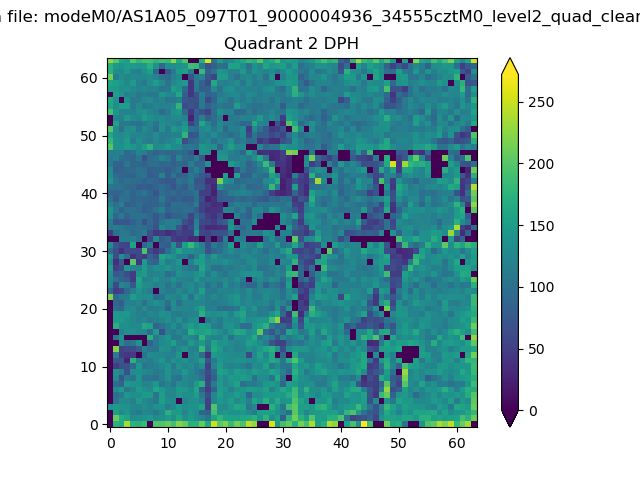
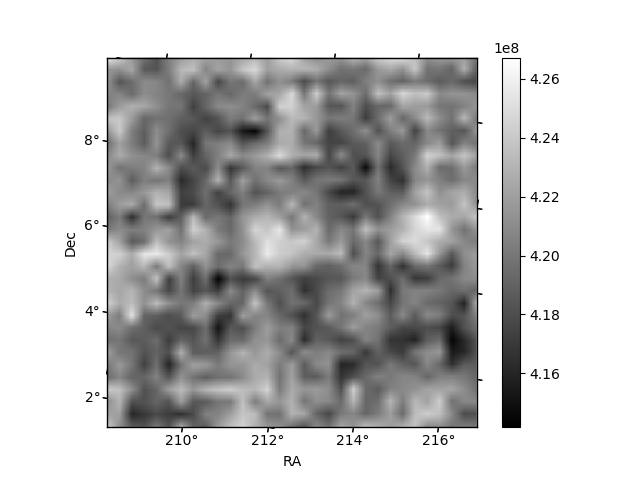
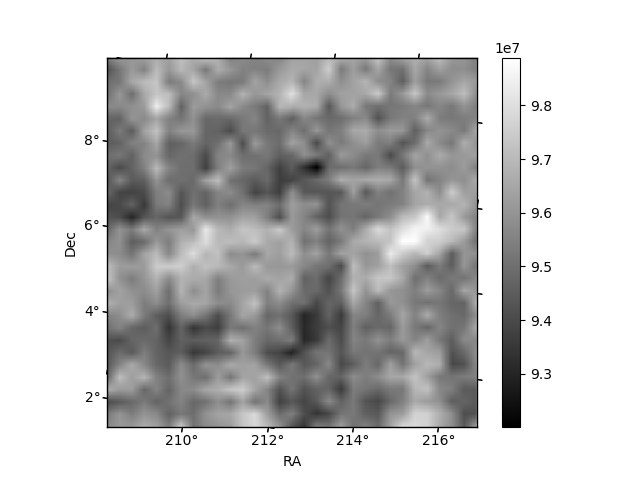
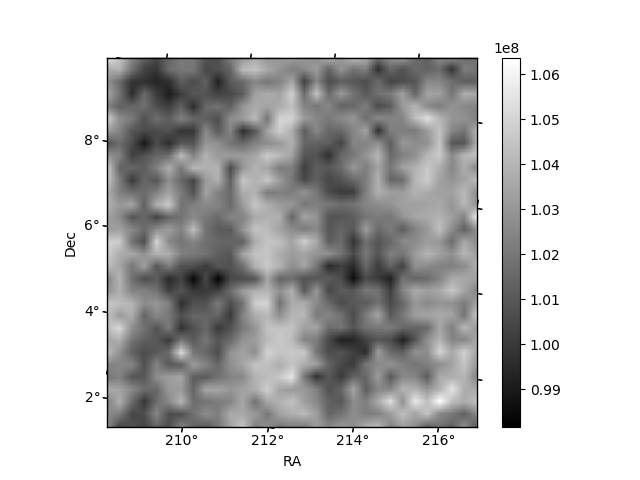
Histogram calculated using DETX and DETY for each event in the final _common_clean file
| Quadrant A | 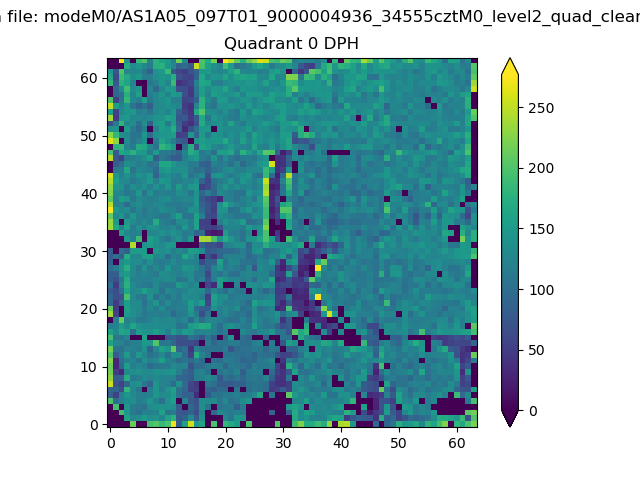 |
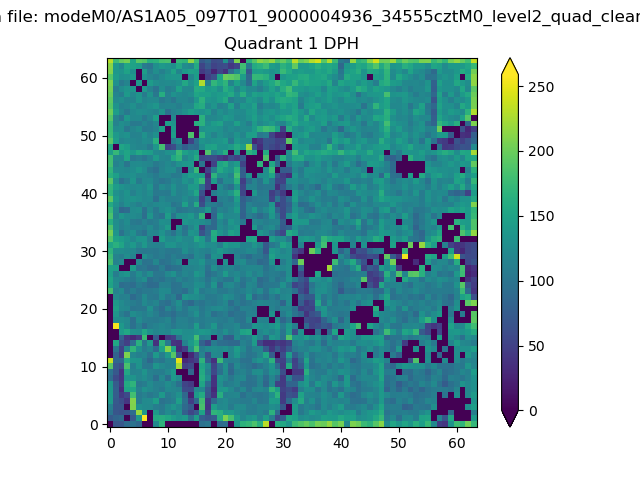 |
Quadrant B |
|---|---|---|---|
| Quadrant D | 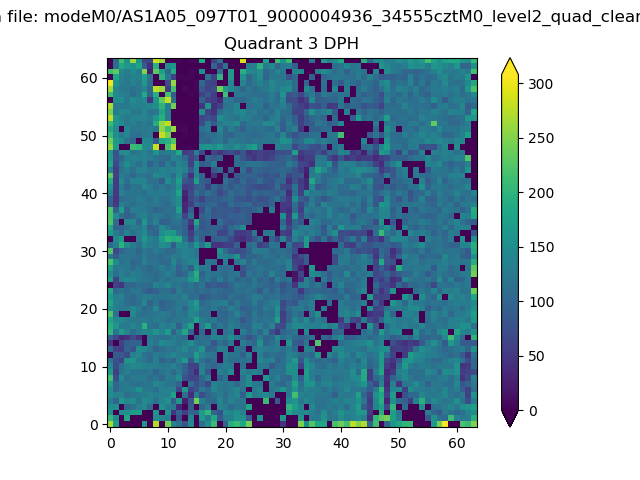 |
 |
Quadrant C |
| Plot type | Count rate plots | Images |
|---|---|---|
| Comparison with Poisson distribution Blue bars denote a histogram of data divided into 1 sec bins. Red curve is a Poisson curve with rate = median count rate of data. |
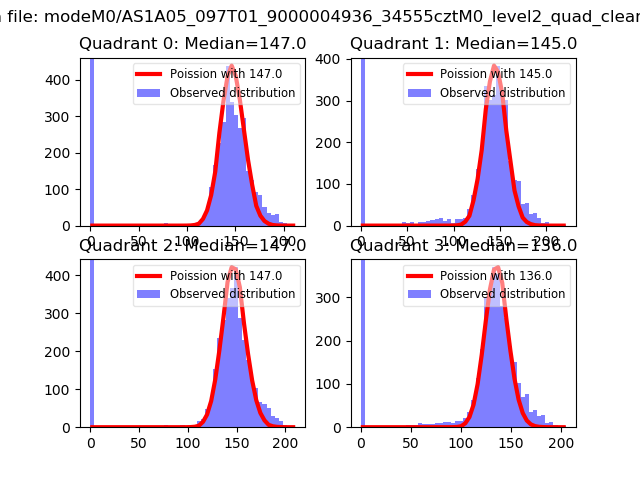 |
 |
| Quadrant-wise count rates Data is divided into 100 sec bins |
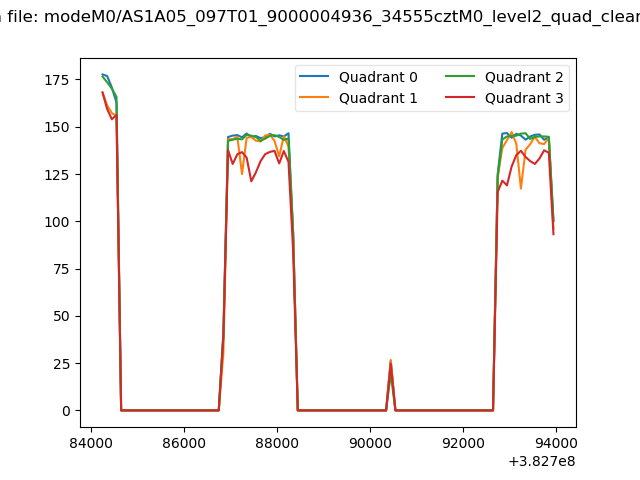 |
|
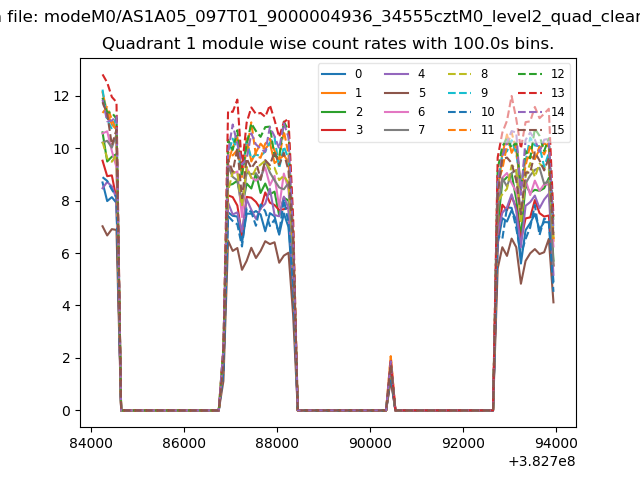
| Module-wise count rates for Quadrant A Data is divided into 100 sec bins |
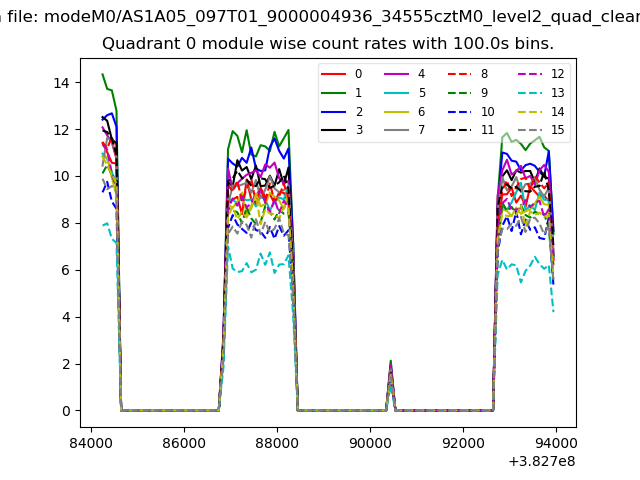 |
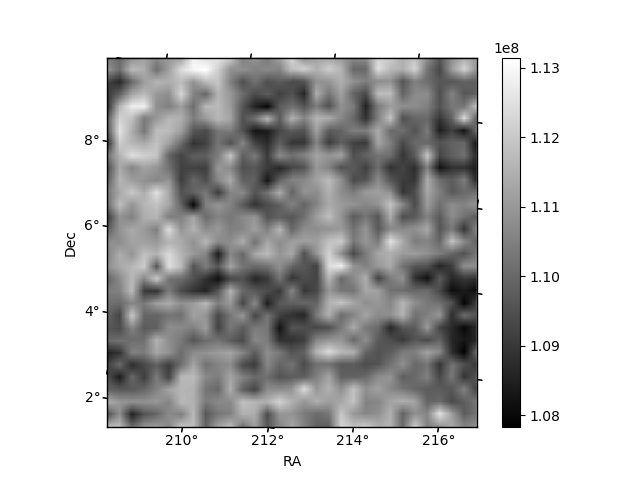 |
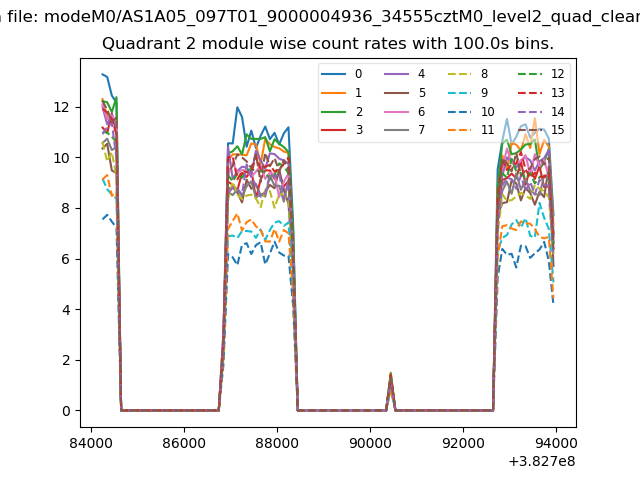
| Module-wise count rates for Quadrant B Data is divided into 100 sec bins |
 |
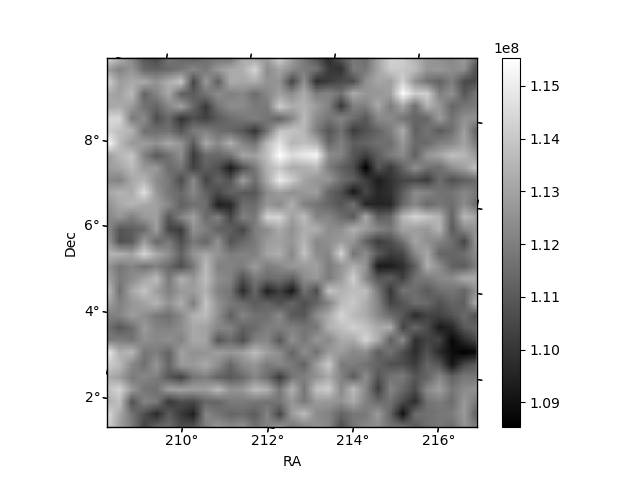 |
| Module-wise count rates for Quadrant C Data is divided into 100 sec bins |
 |
 |
| Module-wise count rates for Quadrant D Data is divided into 100 sec bins |
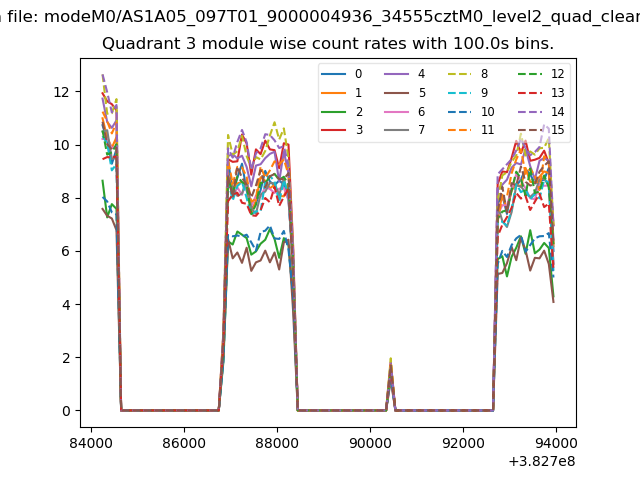 |
 |
| Parameter | Plot |
|---|---|
| CZT HV Monitor | 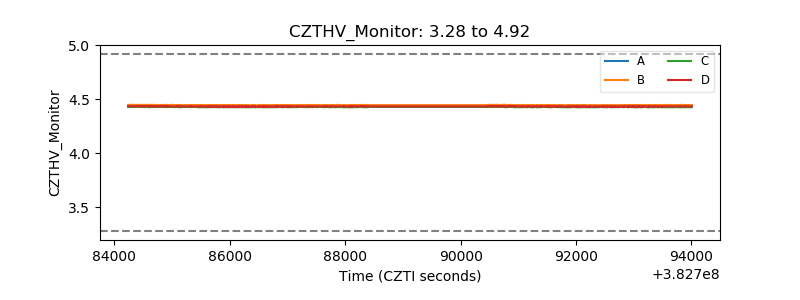 |
| D_VDD | 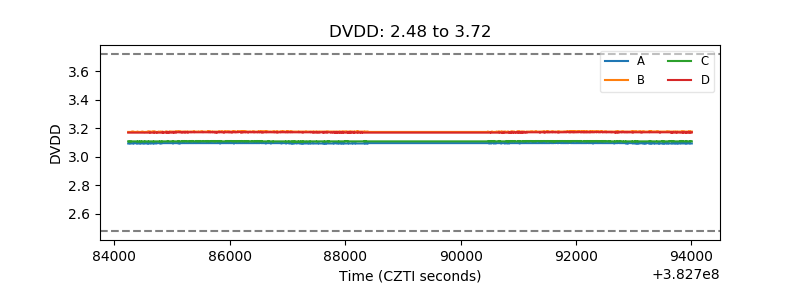 |
| Temperature 1 | 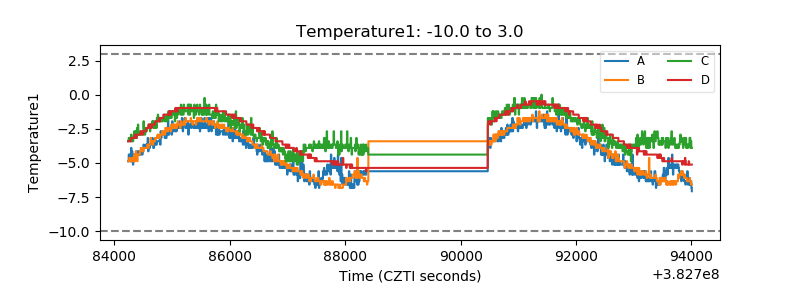 |
| Veto HV Monitor |  |
| Veto LLD | 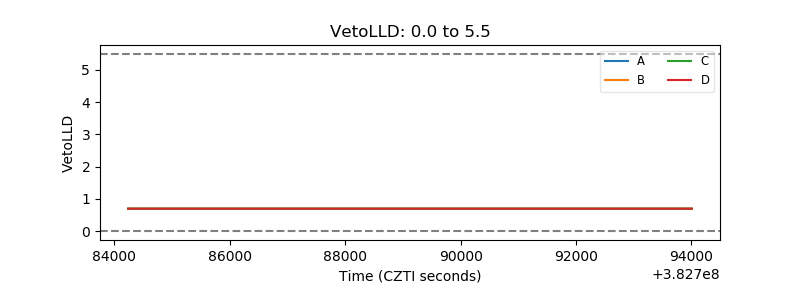 |
| Alpha Counter | 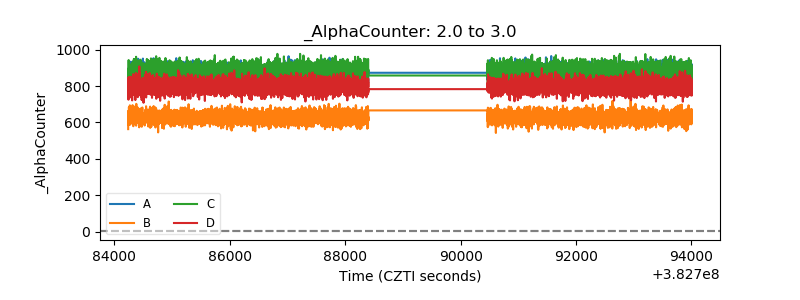 |
| _CPM_Rate | 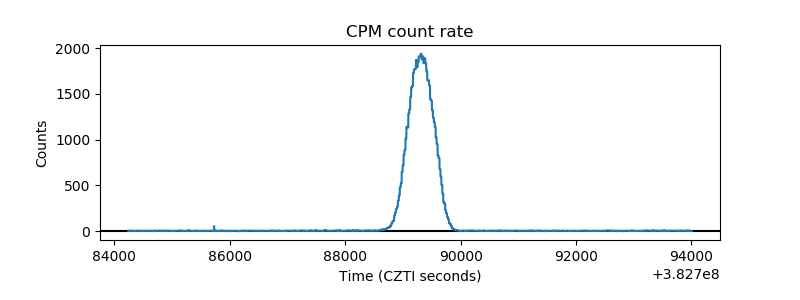 |
| CZT Counter | 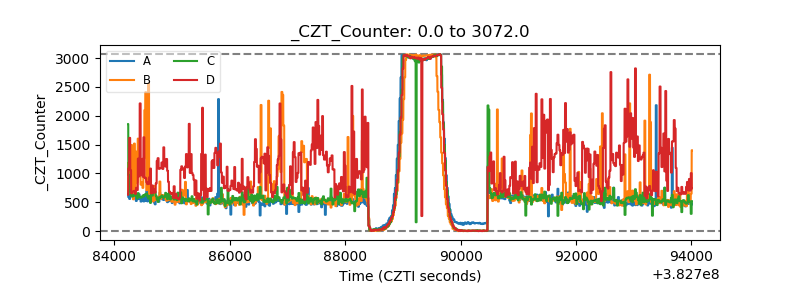 |
| +2.5 Volts monitor | 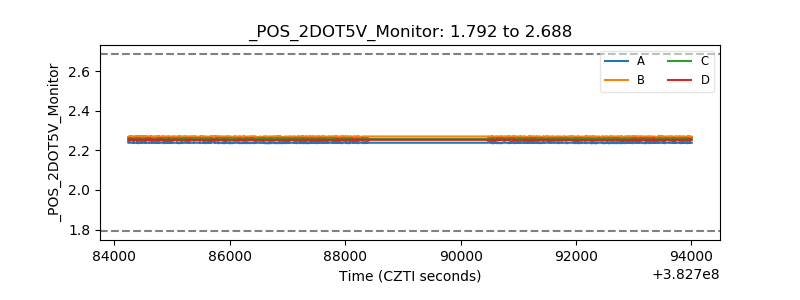 |
| +5 Volts monitor | 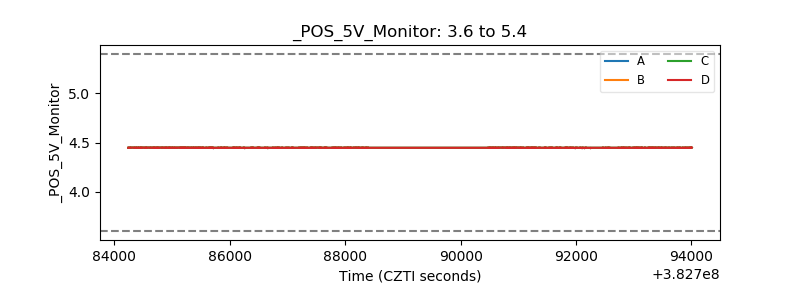 |
| _ROLL_ROT | 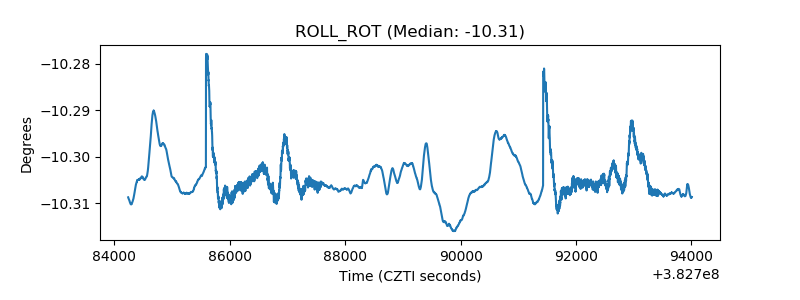 |
| _Roll_DEC | 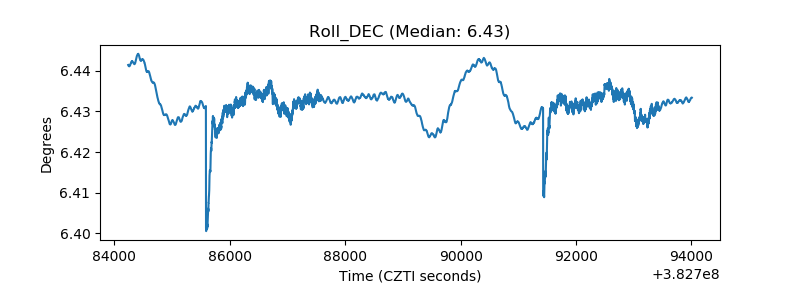 |
| _Roll_RA | 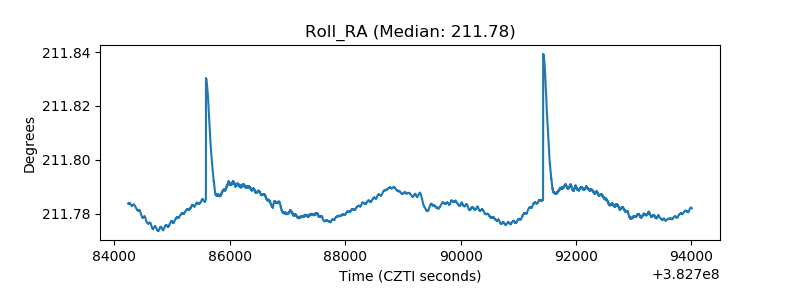 |
| Veto Counter | 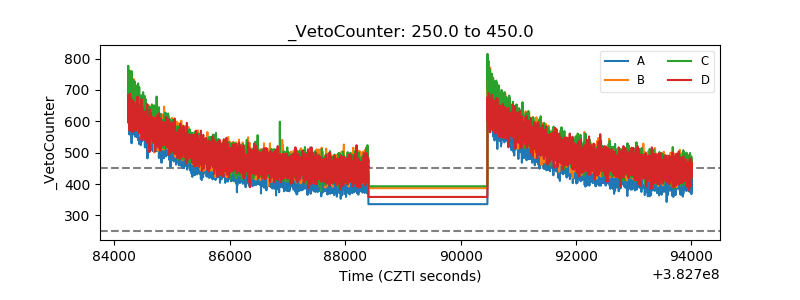 |