| Param | Original file | Final file |
|---|---|---|
| Filename | modeM0/AS1A05_097T01_9000004936_34547cztM0_level2.evt | modeM0/AS1A05_097T01_9000004936_34547cztM0_level2_quad_clean.evt |
| Size (bytes) | 602,553,600 | 53,809,920 |
| Size | 574.6 MB | 51.3 MB |
| Events in quadrant A | 3,254,061 | 294,768 |
| Events in quadrant B | 4,067,926 | 299,777 |
| Events in quadrant C | 3,470,507 | 300,093 |
| Events in quadrant D | 7,015,788 | 280,410 |
| Mode M0 | |||
|---|---|---|---|
| Quadrant | BADHDUFLAG | Total packets | Discarded packets |
| A | 0 | 13667 | 1 |
| B | 0 | 16477 | 1 |
| C | 0 | 14156 | 1 |
| D | 0 | 25418 | 1 |
| Mode SS | |||
|---|---|---|---|
| Quadrant | BADHDUFLAG | Total packets | Discarded packets |
| A | 0 | 134 | 0 |
| B | 0 | 134 | 0 |
| C | 0 | 134 | 0 |
| D | 0 | 134 | 0 |
| Mode M9 | |||
|---|---|---|---|
| Quadrant | BADHDUFLAG | Total packets | Discarded packets |
| A | 0 | 21 | 0 |
| B | 0 | 20 | 0 |
| C | 0 | 20 | 0 |
| D | 0 | 20 | 0 |
| Quadrant | Total seconds | Saturated seconds | Saturation percentage |
|---|---|---|---|
| A | 6507 | 30 | 0.461042% |
| B | 6507 | 217 | 3.334870% |
| C | 6507 | 15 | 0.230521% |
| D | 6507 | 595 | 9.143999% |
Noise dominated data is calculated using 1-second bins in cleaned event files. If a bin has >2000 counts, and if more than 50% of those come from <1% of pixels, then it is considered to be noise-dominated and hence unusable.
| Quadrant | # 1 sec bins | Bins with >0 counts | Bins with >2000 counts | High rate bins dominated by noise | Noise dominated (total time) | Noise dominated (detector-on time) | Marked lightcurve |
|---|---|---|---|---|---|---|---|
| A | 7970 | 6508 | 8 | 8 | 0.10% | 0.12% | 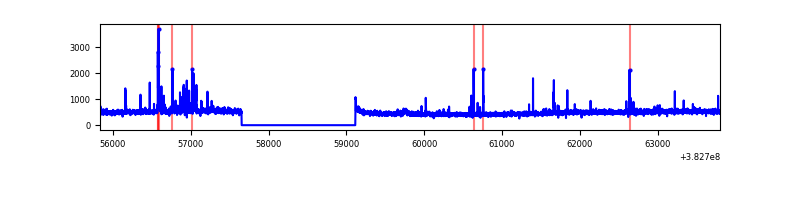 |
| B | 7970 | 6508 | 120 | 120 | 1.51% | 1.84% | 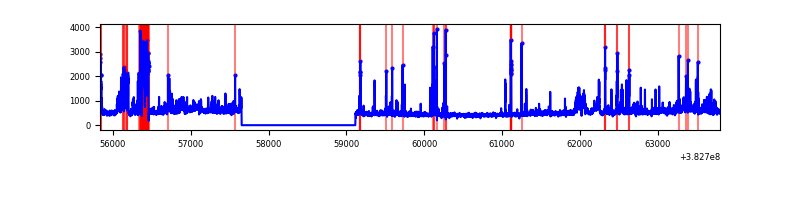 |
| C | 7970 | 6508 | 3 | 3 | 0.04% | 0.05% | 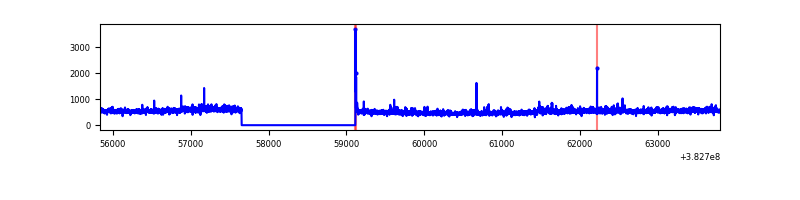 |
| D | 7970 | 6508 | 350 | 350 | 4.39% | 5.38% | 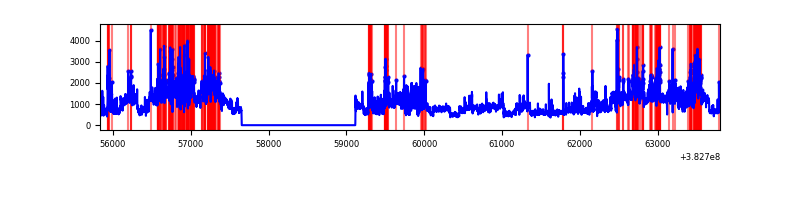 |
Top three noisy pixels from each quadrant. If the there are fewer than three noisy pixels in the level2.evt file, extra rows are filled as -1
| Pixel properties | Quadrant properties | ||||||
|---|---|---|---|---|---|---|---|
| Quadrant | DetID | PixID | Counts | Sigma | Mean | Median | Sigma |
| A | 9 | 143 | 127551 | 784.66 | 791 | 775 | 161.6 |
| A | 10 | 83 | 27499 | 165.4 | 791 | 775 | 161.6 |
| A | 13 | 6 | 25799 | 154.88 | 791 | 775 | 161.6 |
| B | 5 | 172 | 787218 | 5263.95 | 772 | 750 | 149.4 |
| B | 0 | 190 | 64272 | 425.16 | 772 | 750 | 149.4 |
| B | 0 | 245 | 51359 | 338.73 | 772 | 750 | 149.4 |
| C | 15 | 214 | 288191 | 1608.14 | 767 | 772 | 178.7 |
| C | 14 | 67 | 156109 | 869.13 | 767 | 772 | 178.7 |
| C | 0 | 10 | 18145 | 97.2 | 767 | 772 | 178.7 |
| D | 8 | 195 | 2285118 | 12149.19 | 754 | 732 | 188.0 |
| D | 2 | 250 | 662958 | 3521.96 | 754 | 732 | 188.0 |
| D | 12 | 17 | 350084 | 1857.98 | 754 | 732 | 188.0 |
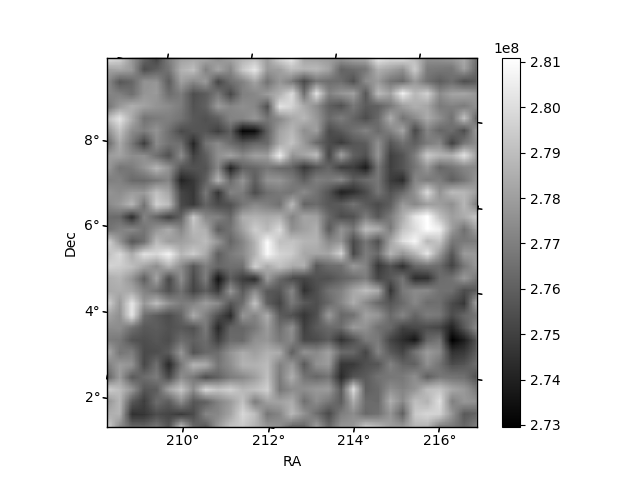
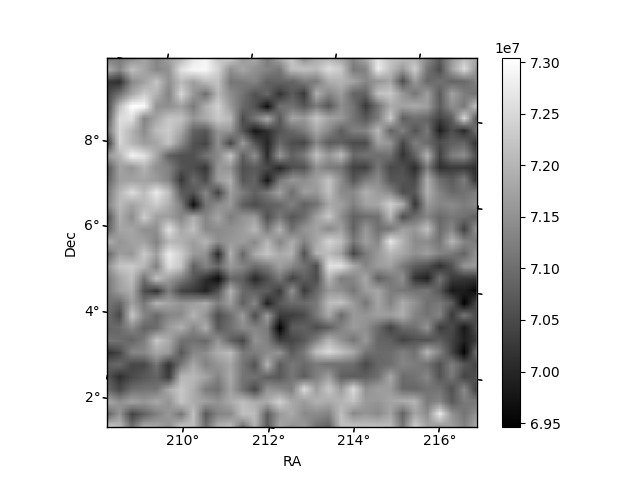
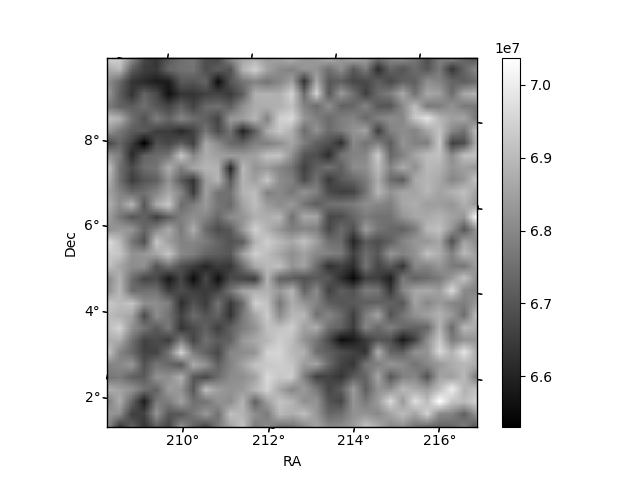
Histogram calculated using DETX and DETY for each event in the final _common_clean file
| Quadrant A | 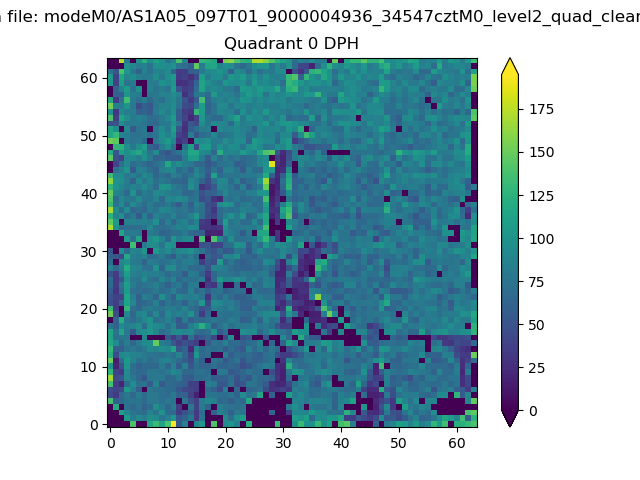 |
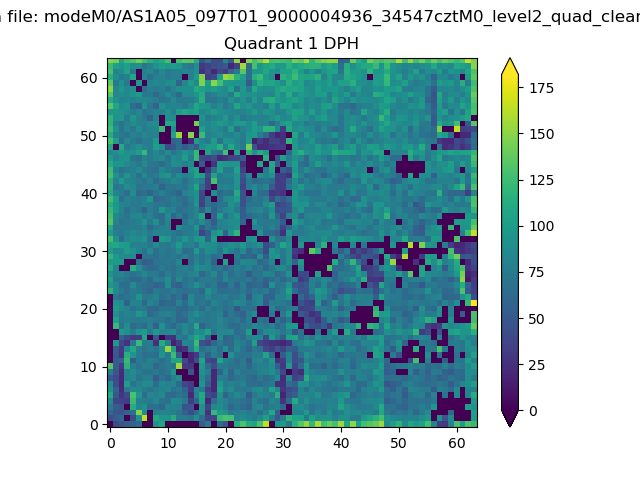 |
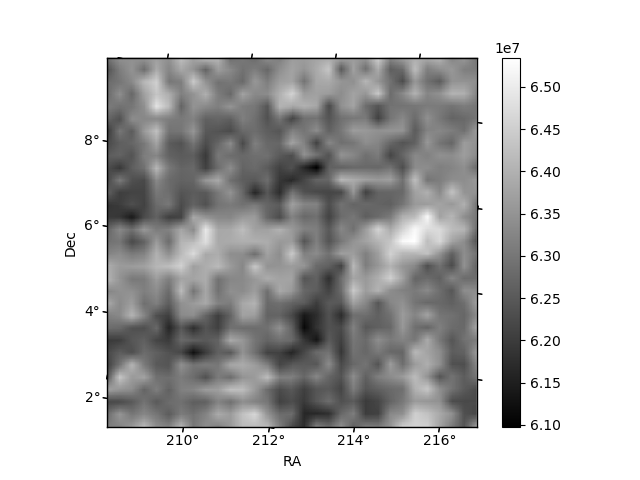
Quadrant B |
|---|---|---|---|
| Quadrant D | 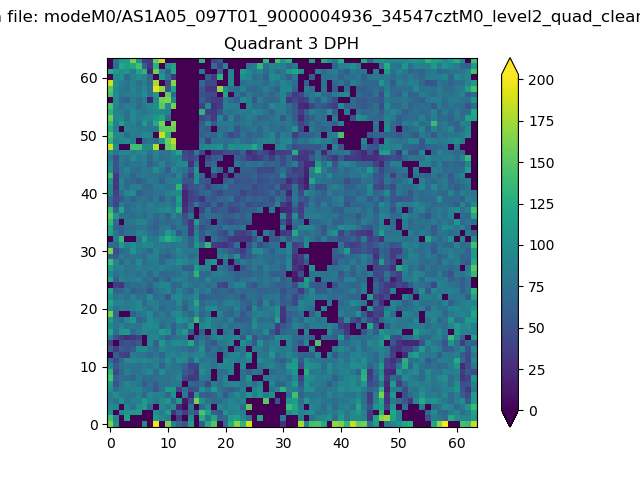 |
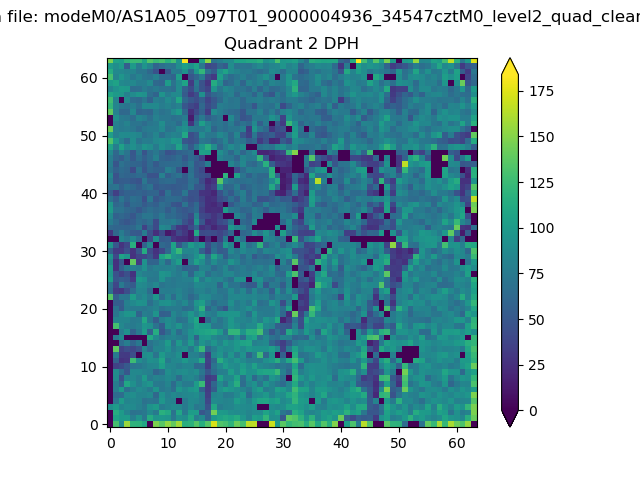 |
Quadrant C |
| Plot type | Count rate plots | Images |
|---|---|---|
| Comparison with Poisson distribution Blue bars denote a histogram of data divided into 1 sec bins. Red curve is a Poisson curve with rate = median count rate of data. |
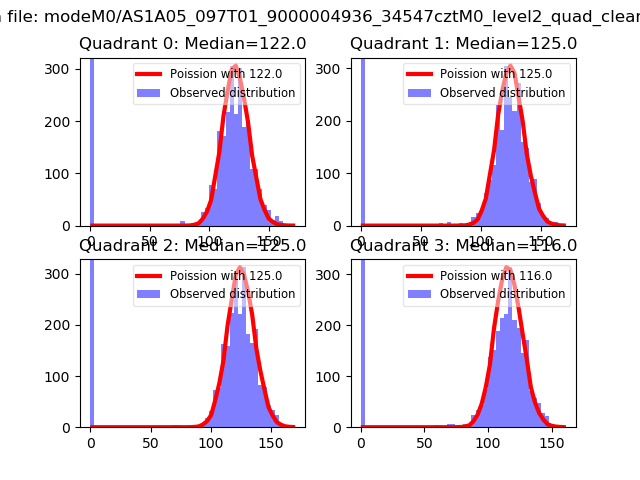 |
 |
| Quadrant-wise count rates Data is divided into 100 sec bins |
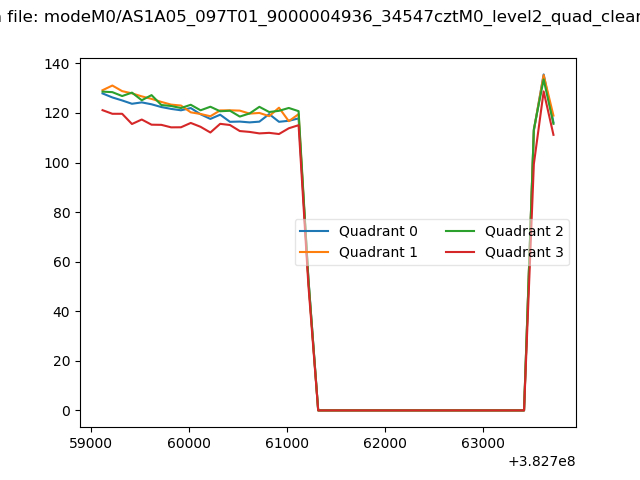 |
|
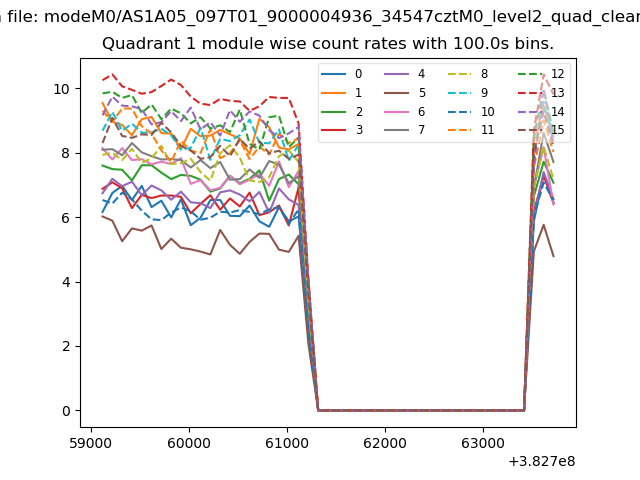
| Module-wise count rates for Quadrant A Data is divided into 100 sec bins |
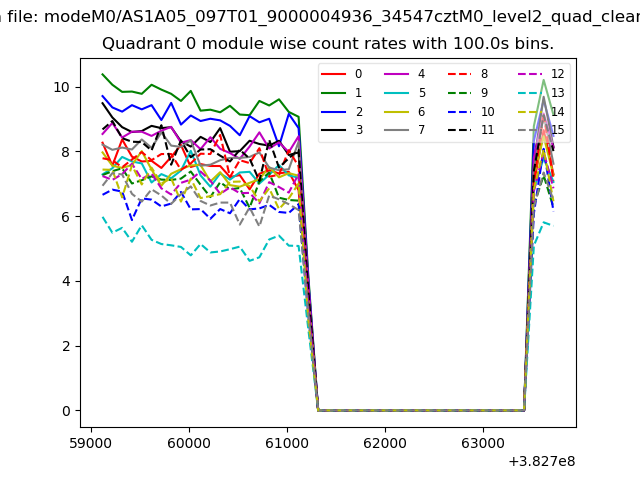 |
 |
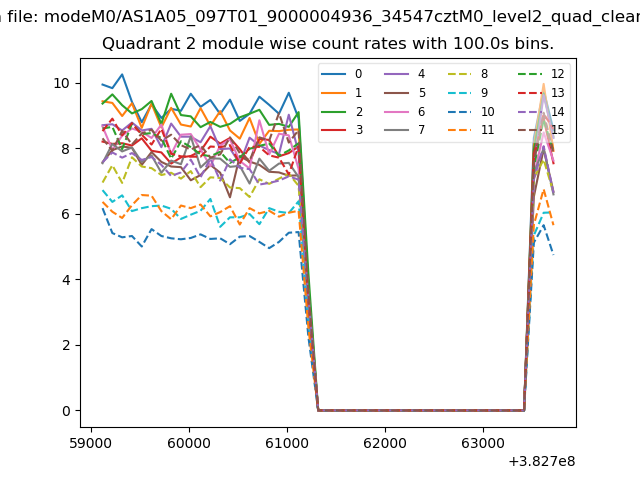
| Module-wise count rates for Quadrant B Data is divided into 100 sec bins |
 |
 |
| Module-wise count rates for Quadrant C Data is divided into 100 sec bins |
 |
 |
| Module-wise count rates for Quadrant D Data is divided into 100 sec bins |
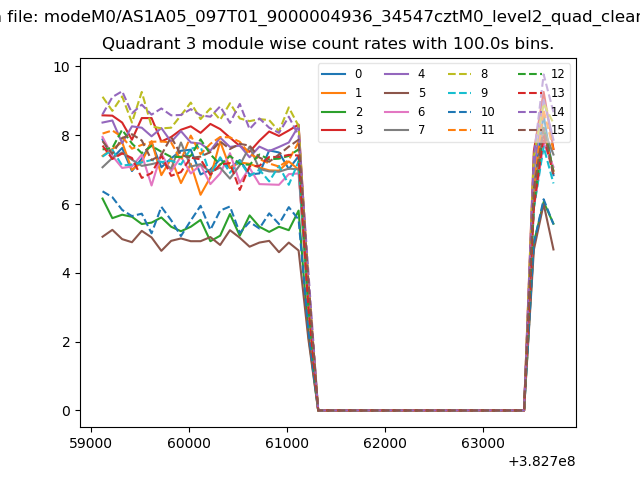 |
 |
| Parameter | Plot |
|---|---|
| CZT HV Monitor | 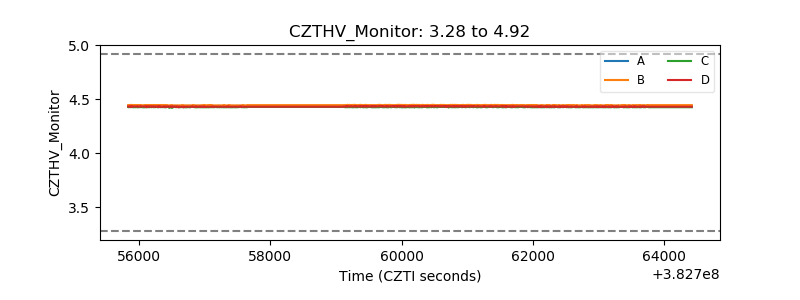 |
| D_VDD | 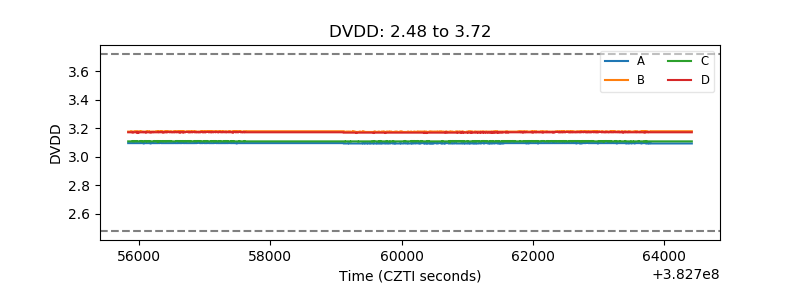 |
| Temperature 1 | 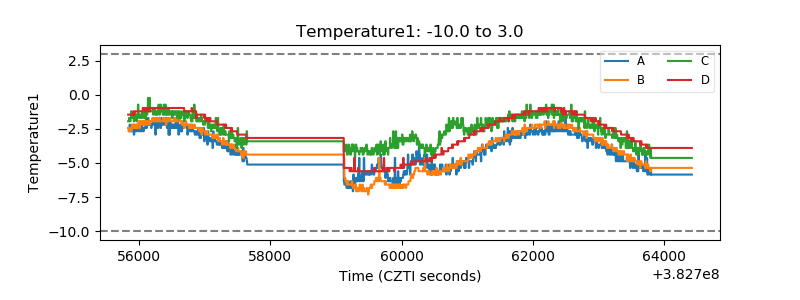 |
| Veto HV Monitor | 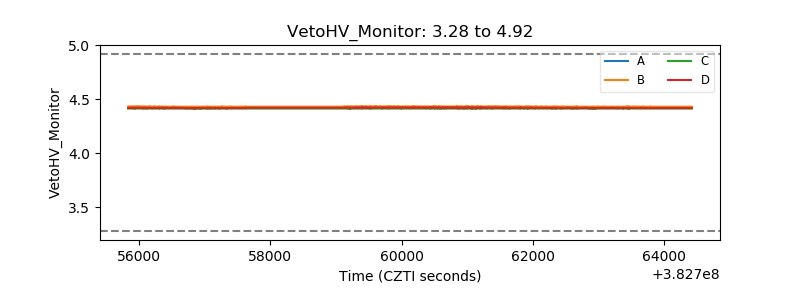 |
| Veto LLD | 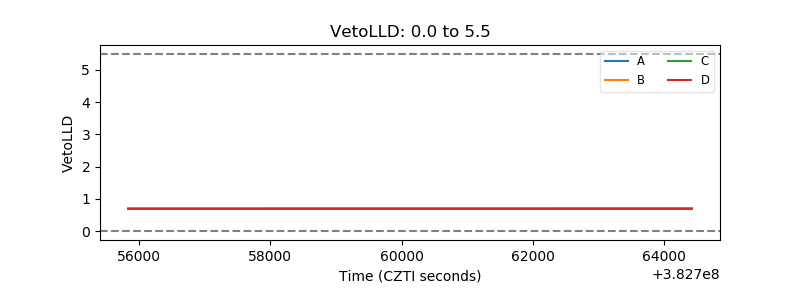 |
| Alpha Counter | 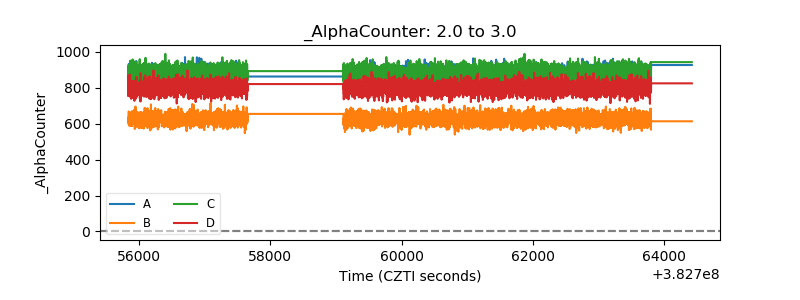 |
| _CPM_Rate | 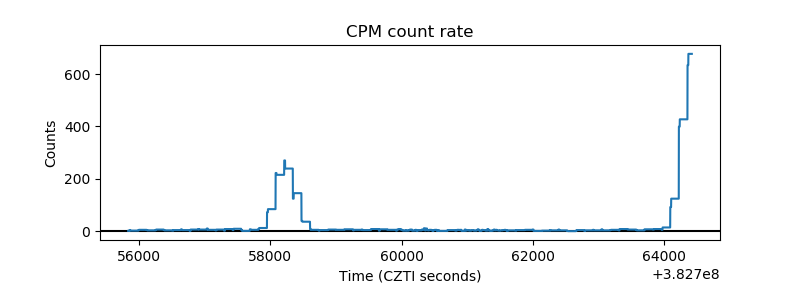 |
| CZT Counter | 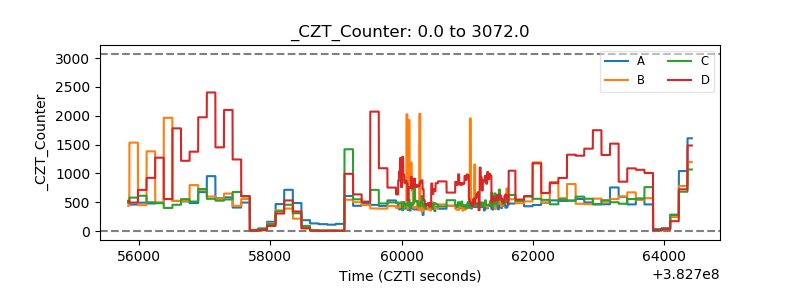 |
| +2.5 Volts monitor | 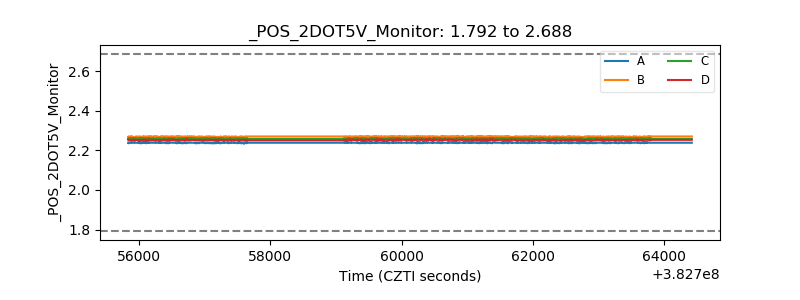 |
| +5 Volts monitor | 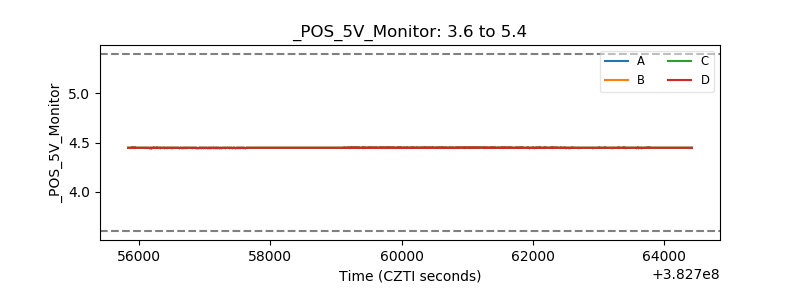 |
| _ROLL_ROT | 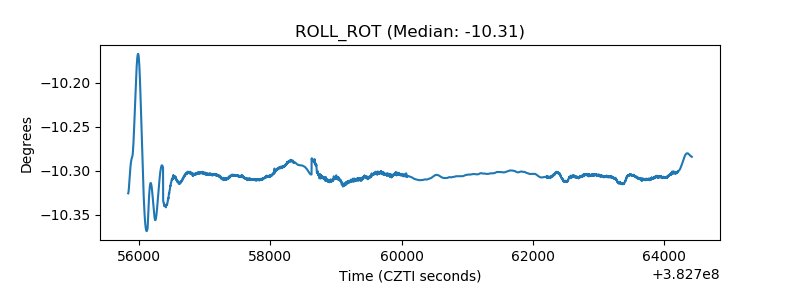 |
| _Roll_DEC |  |
| _Roll_RA | 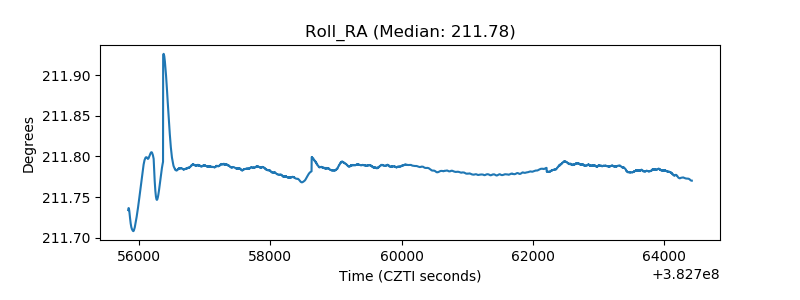 |
| Veto Counter | 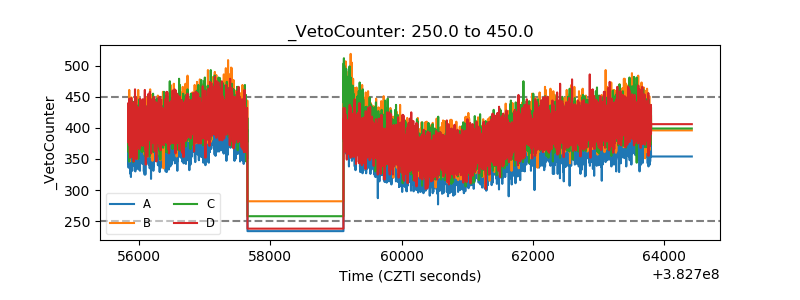 |