| Param | Original file | Final file |
|---|---|---|
| Filename | modeM0/AS1A05_115T02_9000004934_34542cztM0_level2.evt | modeM0/AS1A05_115T02_9000004934_34542cztM0_level2_quad_clean.evt |
| Size (bytes) | 491,607,360 | 89,784,000 |
| Size | 468.8 MB | 85.6 MB |
| Events in quadrant A | 2,694,638 | 592,117 |
| Events in quadrant B | 3,499,588 | 584,133 |
| Events in quadrant C | 3,051,335 | 590,997 |
| Events in quadrant D | 5,254,033 | 550,813 |
| Mode SS | |||
|---|---|---|---|
| Quadrant | BADHDUFLAG | Total packets | Discarded packets |
| A | 0 | 118 | 0 |
| B | 0 | 118 | 0 |
| C | 0 | 118 | 0 |
| D | 0 | 118 | 0 |
| Mode M0 | |||
|---|---|---|---|
| Quadrant | BADHDUFLAG | Total packets | Discarded packets |
| A | 0 | 11784 | 3 |
| B | 0 | 14138 | 2 |
| C | 0 | 12422 | 2 |
| D | 0 | 19705 | 2 |
| Mode M9 | |||
|---|---|---|---|
| Quadrant | BADHDUFLAG | Total packets | Discarded packets |
| A | 0 | 33 | 0 |
| B | 0 | 33 | 0 |
| C | 0 | 33 | 0 |
| D | 0 | 33 | 0 |
| Quadrant | Total seconds | Saturated seconds | Saturation percentage |
|---|---|---|---|
| A | 5735 | 8 | 0.139494% |
| B | 5735 | 225 | 3.923278% |
| C | 5735 | 46 | 0.802092% |
| D | 5735 | 297 | 5.178727% |
Noise dominated data is calculated using 1-second bins in cleaned event files. If a bin has >2000 counts, and if more than 50% of those come from <1% of pixels, then it is considered to be noise-dominated and hence unusable.
| Quadrant | # 1 sec bins | Bins with >0 counts | Bins with >2000 counts | High rate bins dominated by noise | Noise dominated (total time) | Noise dominated (detector-on time) | Marked lightcurve |
|---|---|---|---|---|---|---|---|
| A | 9051 | 5737 | 2 | 2 | 0.02% | 0.03% | 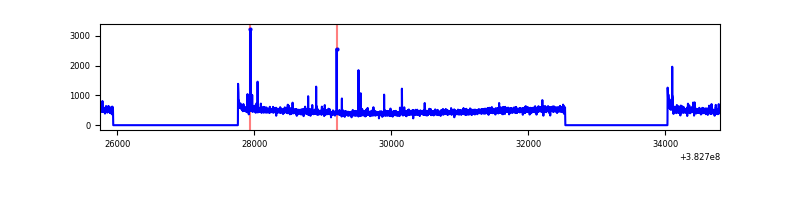 |
| B | 9051 | 5737 | 131 | 131 | 1.45% | 2.28% | 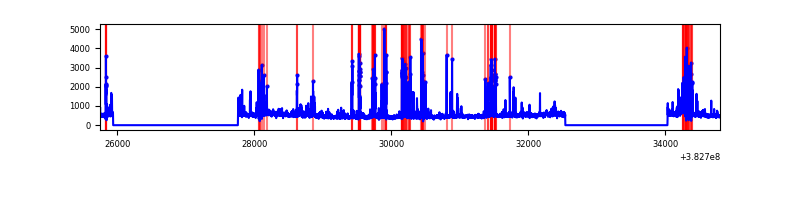 |
| C | 9051 | 5737 | 29 | 29 | 0.32% | 0.51% | 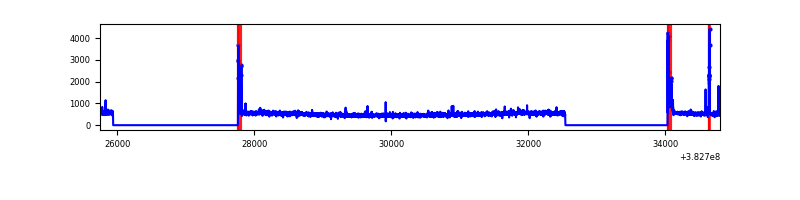 |
| D | 9051 | 5737 | 255 | 255 | 2.82% | 4.44% | 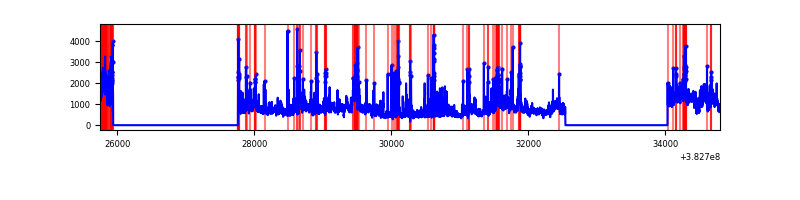 |
Top three noisy pixels from each quadrant. If the there are fewer than three noisy pixels in the level2.evt file, extra rows are filled as -1
| Pixel properties | Quadrant properties | ||||||
|---|---|---|---|---|---|---|---|
| Quadrant | DetID | PixID | Counts | Sigma | Mean | Median | Sigma |
| A | 10 | 83 | 42090 | 303.88 | 673 | 661 | 136.3 |
| A | 9 | 143 | 40895 | 295.11 | 673 | 661 | 136.3 |
| A | 13 | 254 | 10290 | 70.63 | 673 | 661 | 136.3 |
| B | 5 | 172 | 552061 | 4297.4 | 660 | 644 | 128.3 |
| B | 0 | 229 | 153096 | 1188.12 | 660 | 644 | 128.3 |
| B | 0 | 245 | 83656 | 646.94 | 660 | 644 | 128.3 |
| C | 15 | 214 | 257415 | 1683.56 | 656 | 662 | 152.5 |
| C | 0 | 10 | 112346 | 732.32 | 656 | 662 | 152.5 |
| C | 14 | 67 | 55159 | 357.34 | 656 | 662 | 152.5 |
| D | 8 | 195 | 1280395 | 7186.27 | 641 | 626 | 178.1 |
| D | 12 | 17 | 382165 | 2142.45 | 641 | 626 | 178.1 |
| D | 2 | 250 | 262613 | 1471.13 | 641 | 626 | 178.1 |
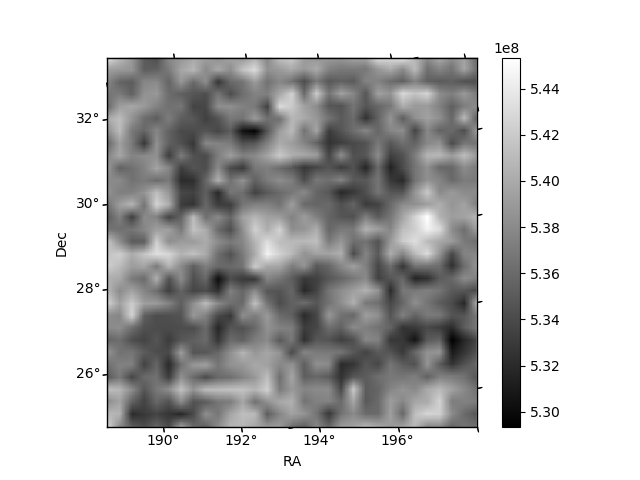
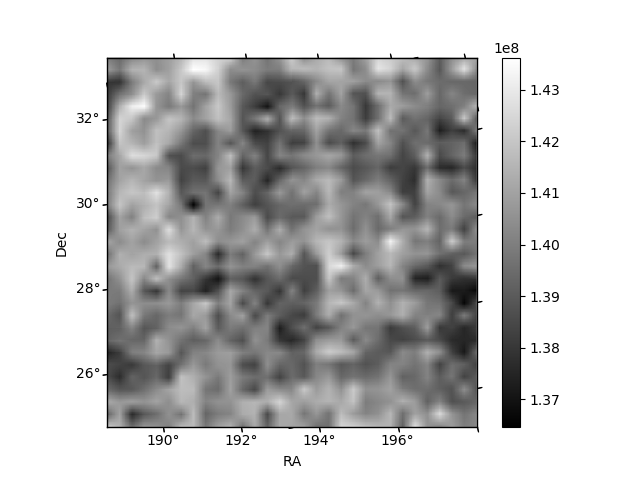
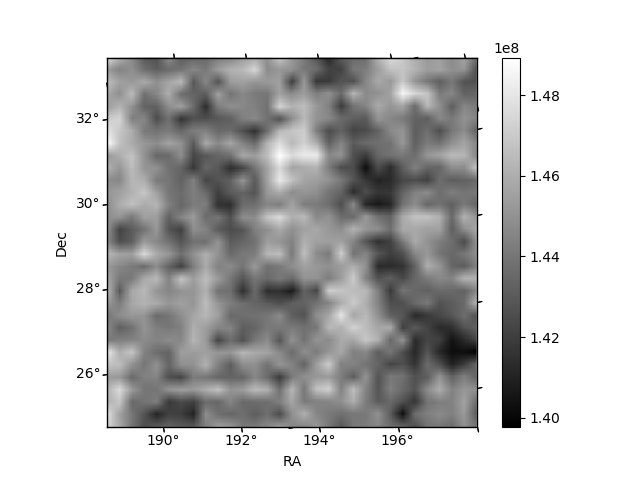
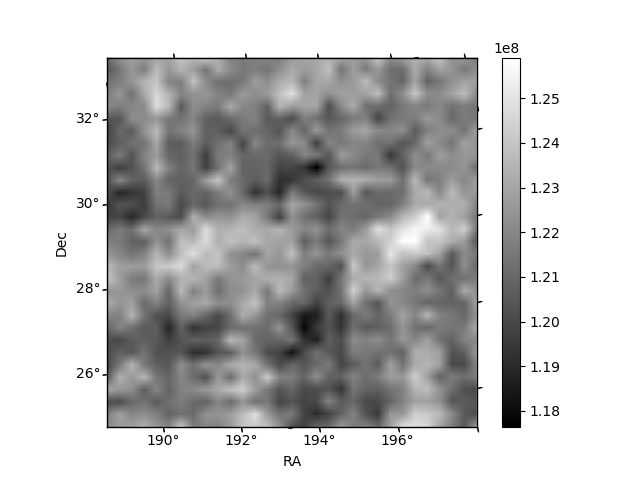
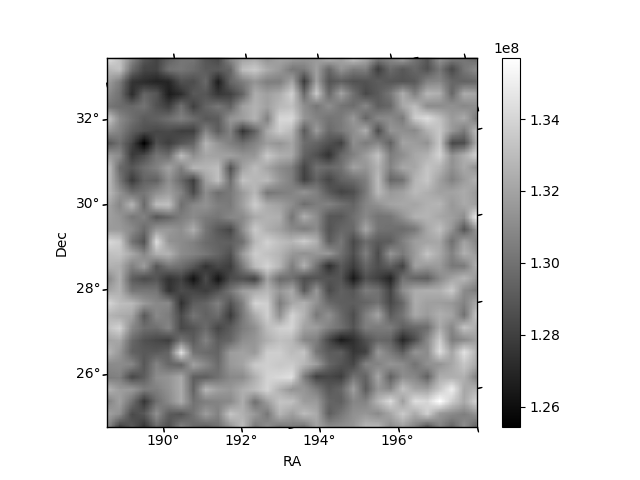
Histogram calculated using DETX and DETY for each event in the final _common_clean file
| Quadrant A | 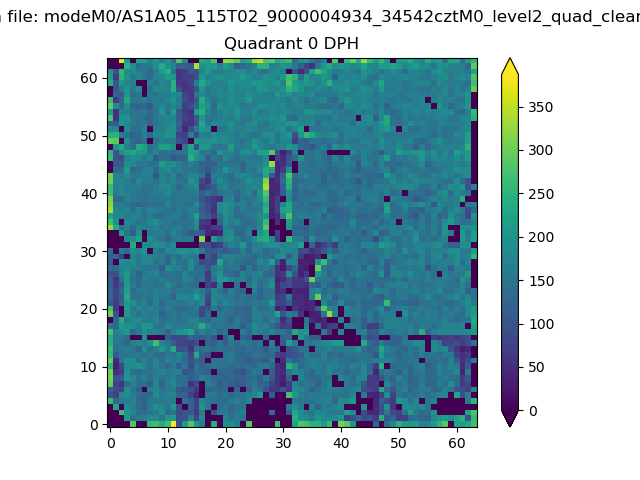 |
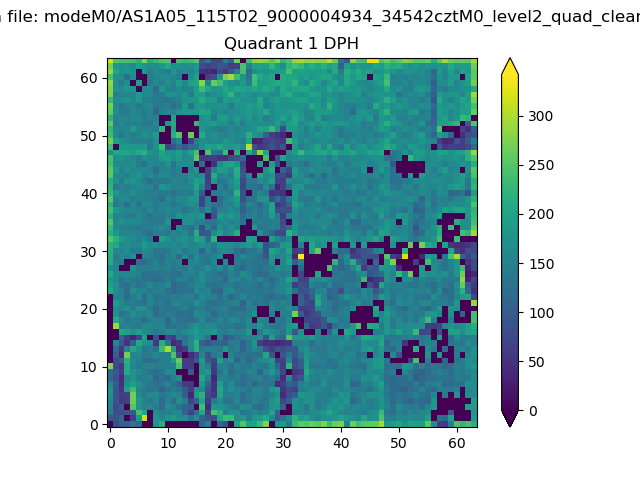 |
Quadrant B |
|---|---|---|---|
| Quadrant D | 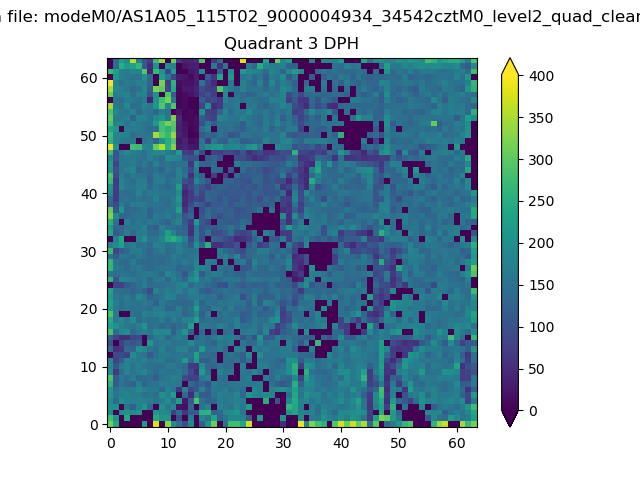 |
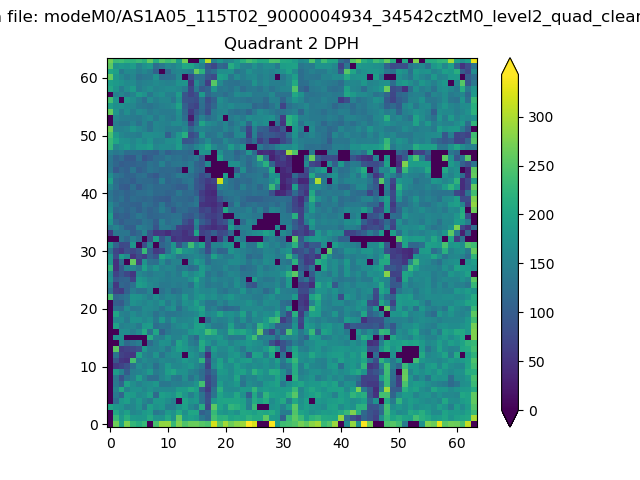 |
Quadrant C |
| Plot type | Count rate plots | Images |
|---|---|---|
| Comparison with Poisson distribution Blue bars denote a histogram of data divided into 1 sec bins. Red curve is a Poisson curve with rate = median count rate of data. |
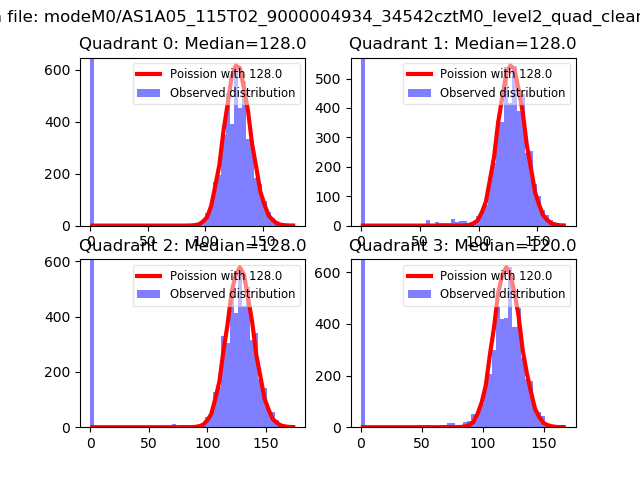 |
 |
| Quadrant-wise count rates Data is divided into 100 sec bins |
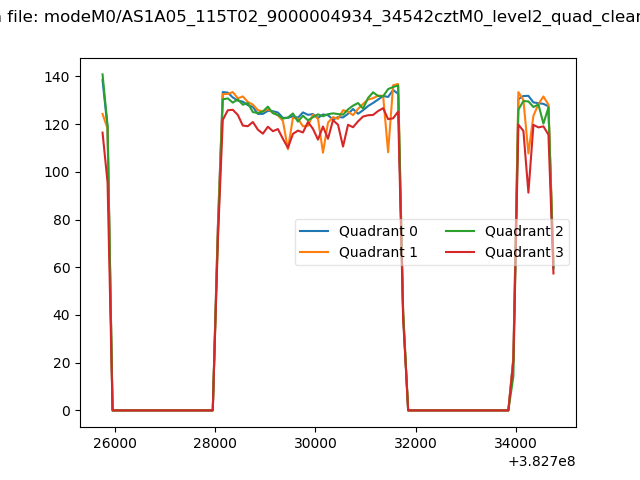 |
|
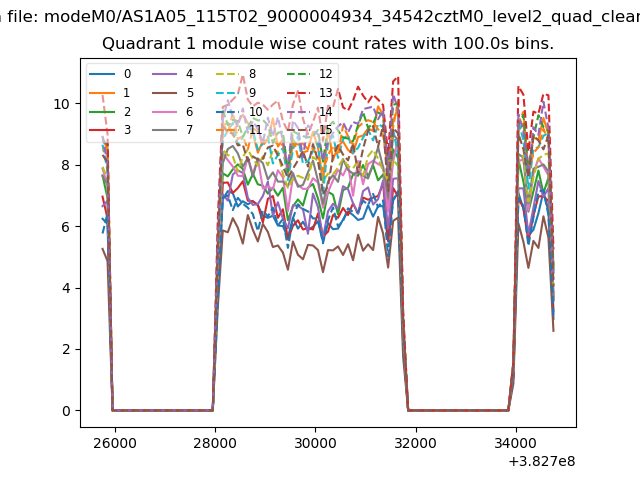
| Module-wise count rates for Quadrant A Data is divided into 100 sec bins |
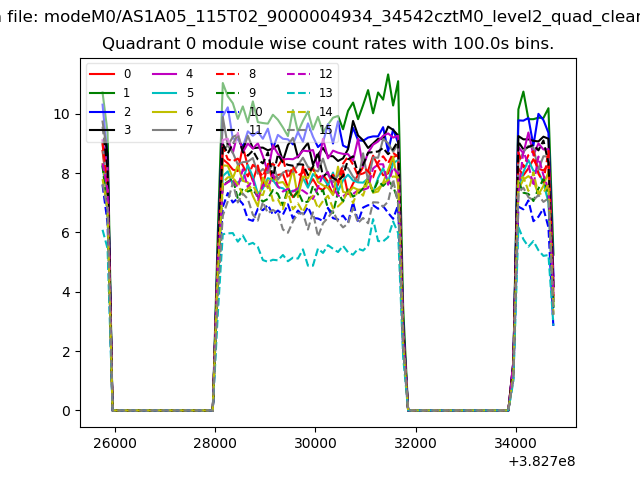 |
 |
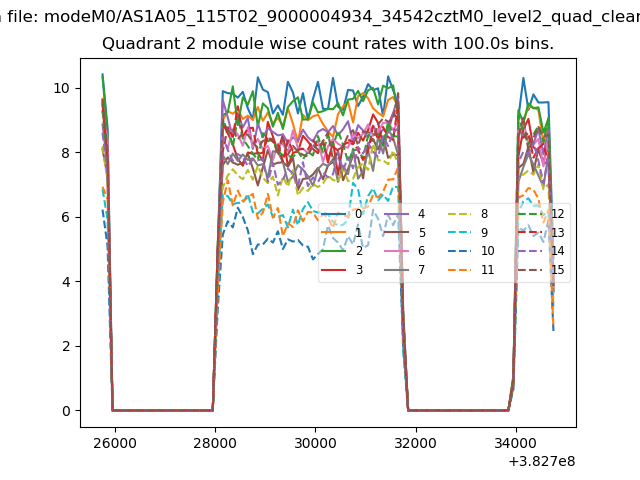
| Module-wise count rates for Quadrant B Data is divided into 100 sec bins |
 |
 |
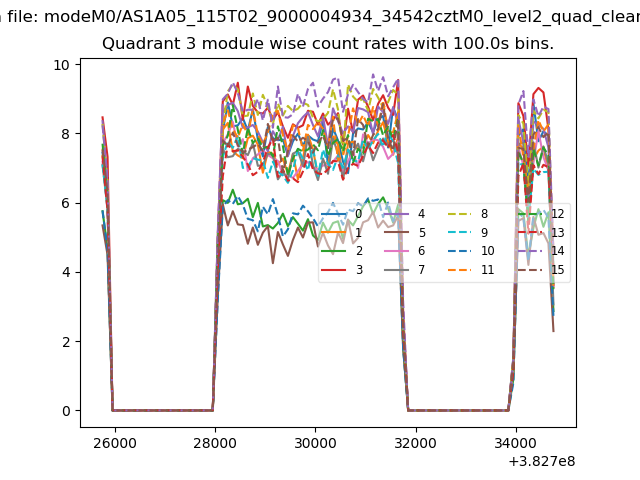
| Module-wise count rates for Quadrant C Data is divided into 100 sec bins |
 |
 |
| Module-wise count rates for Quadrant D Data is divided into 100 sec bins |
 |
 |
| Parameter | Plot |
|---|---|
| CZT HV Monitor | 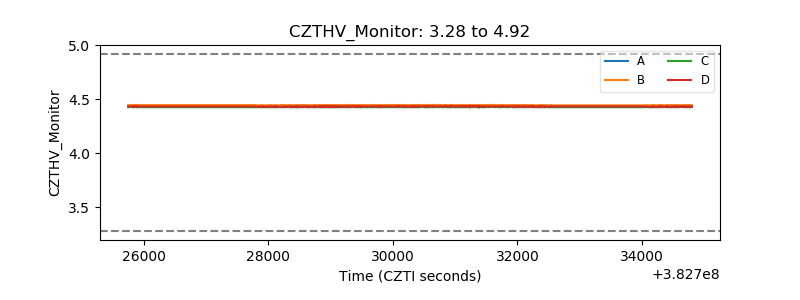 |
| D_VDD | 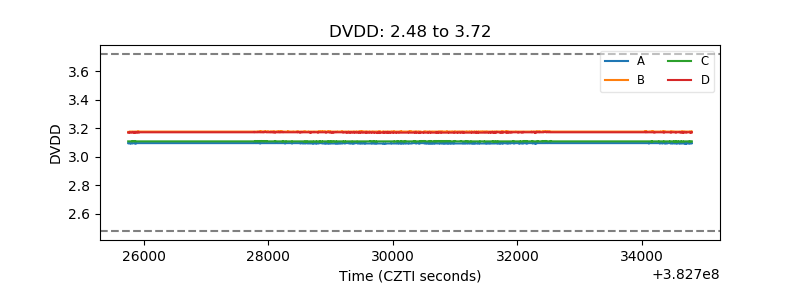 |
| Temperature 1 | 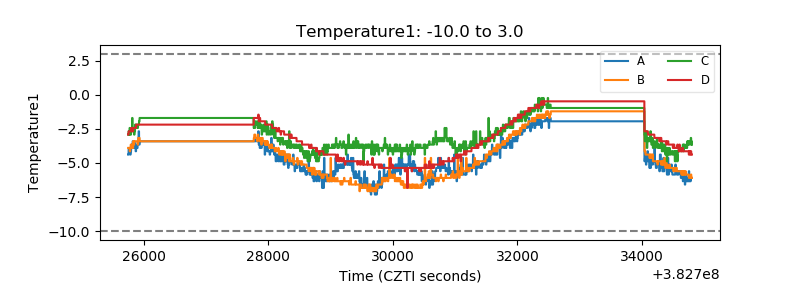 |
| Veto HV Monitor | 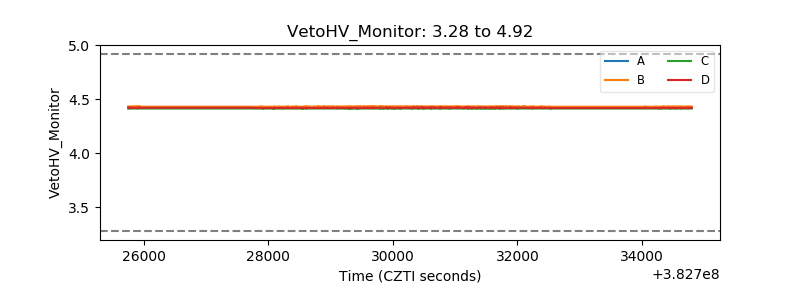 |
| Veto LLD | 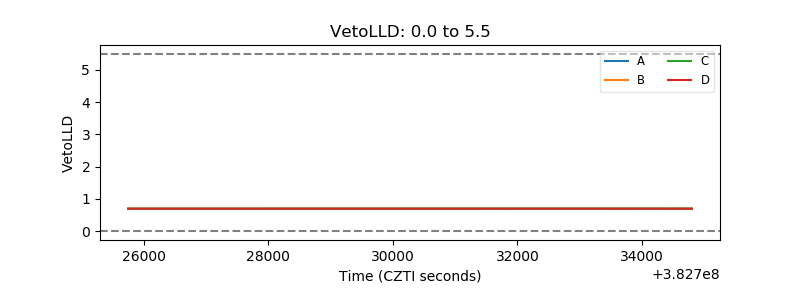 |
| Alpha Counter | 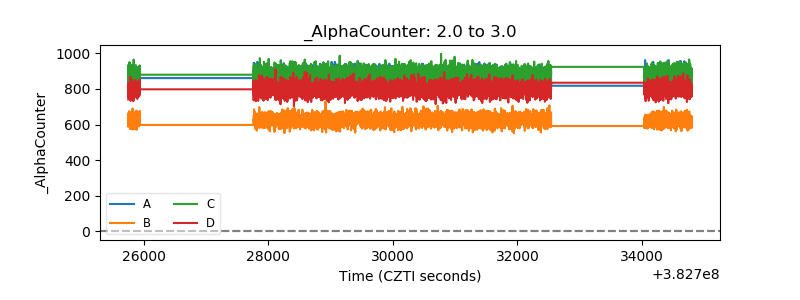 |
| _CPM_Rate | 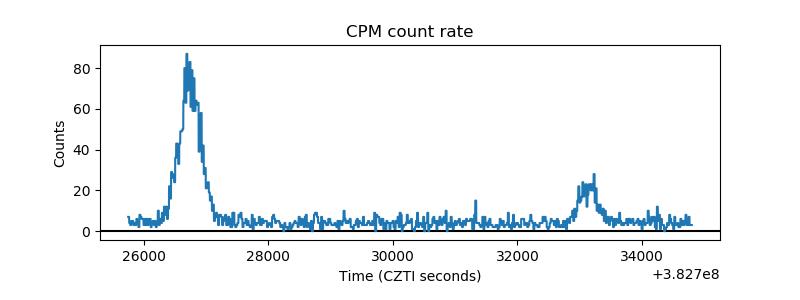 |
| CZT Counter | 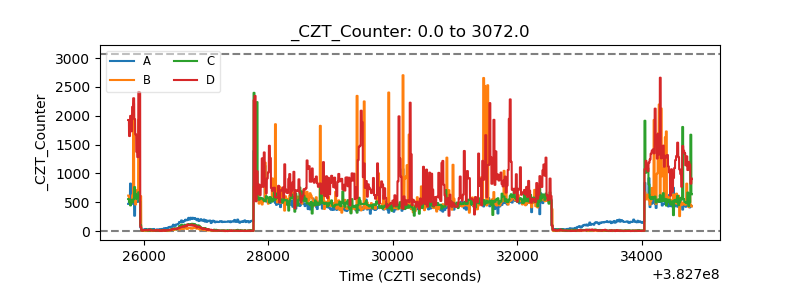 |
| +2.5 Volts monitor | 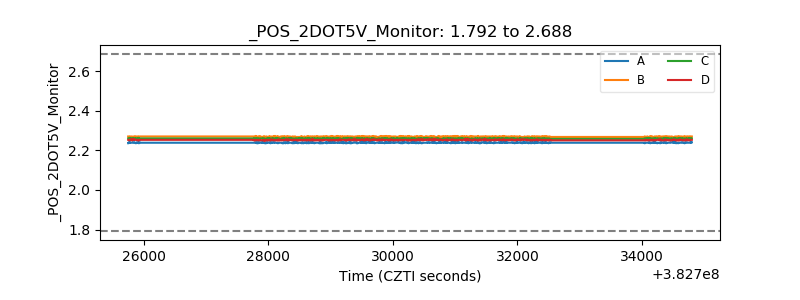 |
| +5 Volts monitor | 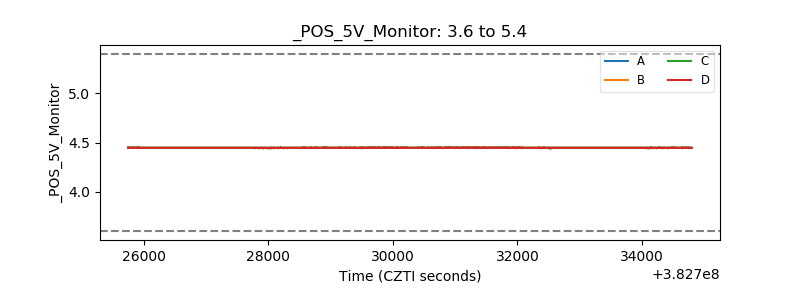 |
| _ROLL_ROT | 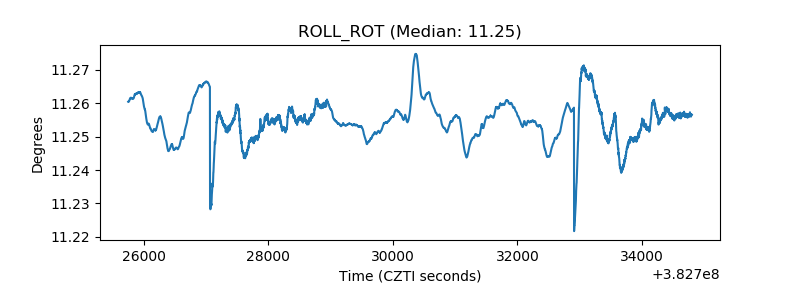 |
| _Roll_DEC | 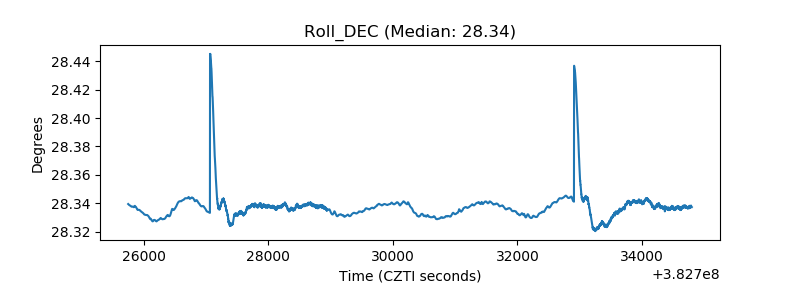 |
| _Roll_RA | 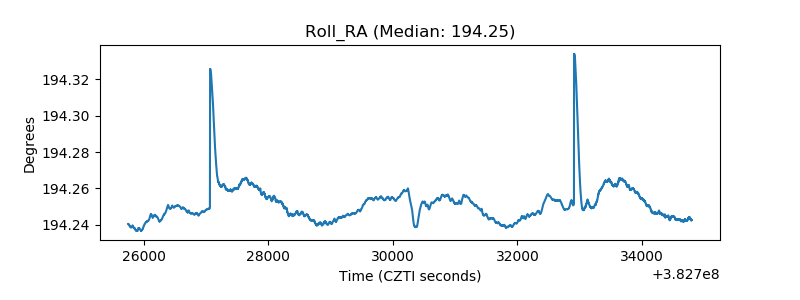 |
| Veto Counter | 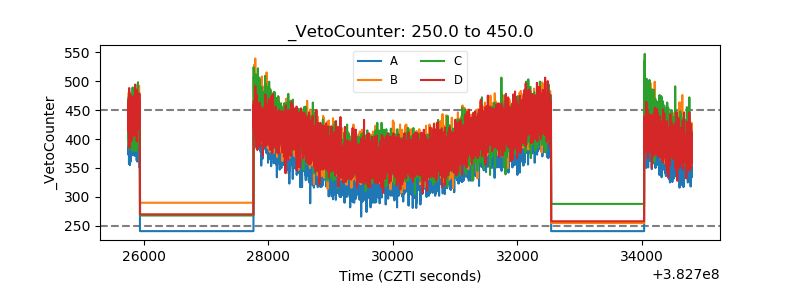 |