| Param | Original file | Final file |
|---|---|---|
| Filename | modeM0/AS1A05_115T02_9000004934_34541cztM0_level2.evt | modeM0/AS1A05_115T02_9000004934_34541cztM0_level2_quad_clean.evt |
| Size (bytes) | 459,619,200 | 82,918,080 |
| Size | 438.3 MB | 79.1 MB |
| Events in quadrant A | 2,506,522 | 543,995 |
| Events in quadrant B | 3,069,558 | 543,072 |
| Events in quadrant C | 2,887,960 | 547,531 |
| Events in quadrant D | 5,100,232 | 509,566 |
| Mode SS | |||
|---|---|---|---|
| Quadrant | BADHDUFLAG | Total packets | Discarded packets |
| A | 0 | 108 | 0 |
| B | 0 | 108 | 0 |
| C | 0 | 108 | 0 |
| D | 0 | 108 | 0 |
| Mode M0 | |||
|---|---|---|---|
| Quadrant | BADHDUFLAG | Total packets | Discarded packets |
| A | 0 | 10824 | 3 |
| B | 0 | 12524 | 2 |
| C | 0 | 11628 | 2 |
| D | 0 | 18897 | 2 |
| Mode M9 | |||
|---|---|---|---|
| Quadrant | BADHDUFLAG | Total packets | Discarded packets |
| A | 0 | 22 | 0 |
| B | 0 | 22 | 0 |
| C | 0 | 22 | 0 |
| D | 0 | 23 | 0 |
| Quadrant | Total seconds | Saturated seconds | Saturation percentage |
|---|---|---|---|
| A | 5233 | 11 | 0.210204% |
| B | 5233 | 108 | 2.063826% |
| C | 5233 | 58 | 1.108351% |
| D | 5233 | 481 | 9.191668% |
Noise dominated data is calculated using 1-second bins in cleaned event files. If a bin has >2000 counts, and if more than 50% of those come from <1% of pixels, then it is considered to be noise-dominated and hence unusable.
| Quadrant | # 1 sec bins | Bins with >0 counts | Bins with >2000 counts | High rate bins dominated by noise | Noise dominated (total time) | Noise dominated (detector-on time) | Marked lightcurve |
|---|---|---|---|---|---|---|---|
| A | 7056 | 5234 | 3 | 3 | 0.04% | 0.06% | 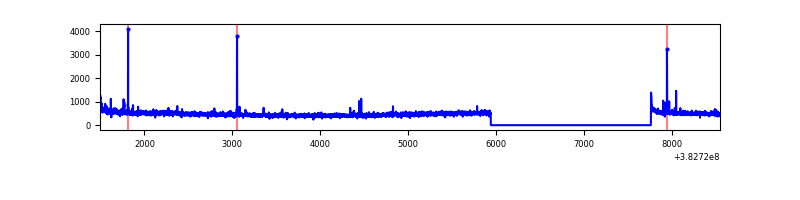 |
| B | 7056 | 5234 | 65 | 65 | 0.92% | 1.24% | 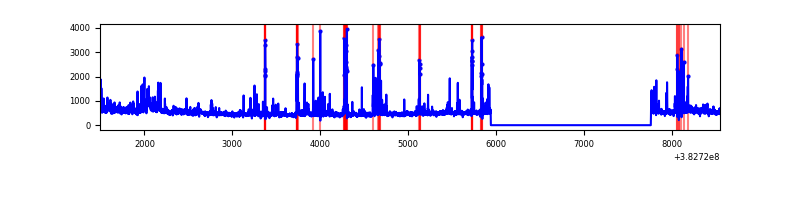 |
| C | 7056 | 5234 | 35 | 35 | 0.50% | 0.67% | 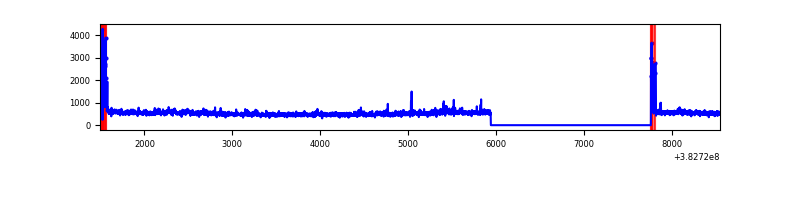 |
| D | 7056 | 5234 | 395 | 395 | 5.60% | 7.55% | 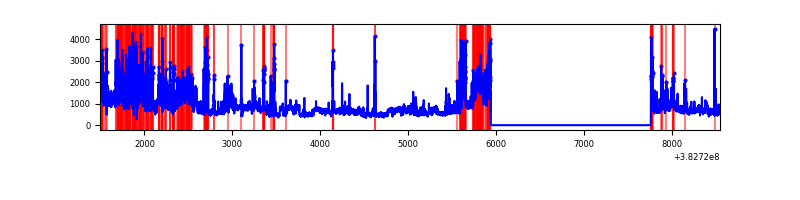 |
Top three noisy pixels from each quadrant. If the there are fewer than three noisy pixels in the level2.evt file, extra rows are filled as -1
| Pixel properties | Quadrant properties | ||||||
|---|---|---|---|---|---|---|---|
| Quadrant | DetID | PixID | Counts | Sigma | Mean | Median | Sigma |
| A | 9 | 143 | 45419 | 357.15 | 621 | 611 | 125.5 |
| A | 10 | 83 | 41848 | 328.68 | 621 | 611 | 125.5 |
| A | 4 | 48 | 9287 | 69.15 | 621 | 611 | 125.5 |
| B | 5 | 172 | 440665 | 3738.44 | 614 | 599 | 117.7 |
| B | 0 | 190 | 60393 | 507.96 | 614 | 599 | 117.7 |
| B | 0 | 245 | 50479 | 423.74 | 614 | 599 | 117.7 |
| C | 15 | 214 | 236056 | 1674.7 | 607 | 612 | 140.6 |
| C | 0 | 10 | 151095 | 1070.38 | 607 | 612 | 140.6 |
| C | 14 | 67 | 106625 | 754.06 | 607 | 612 | 140.6 |
| D | 8 | 195 | 1013522 | 6265.11 | 587 | 574 | 161.7 |
| D | 12 | 17 | 601134 | 3714.48 | 587 | 574 | 161.7 |
| D | 7 | 80 | 487259 | 3010.16 | 587 | 574 | 161.7 |
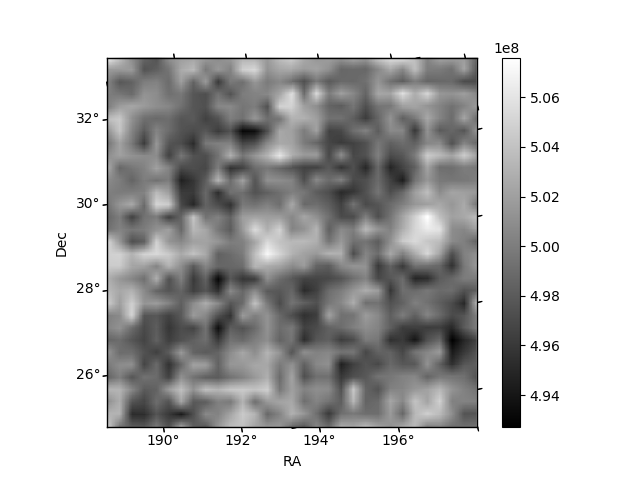
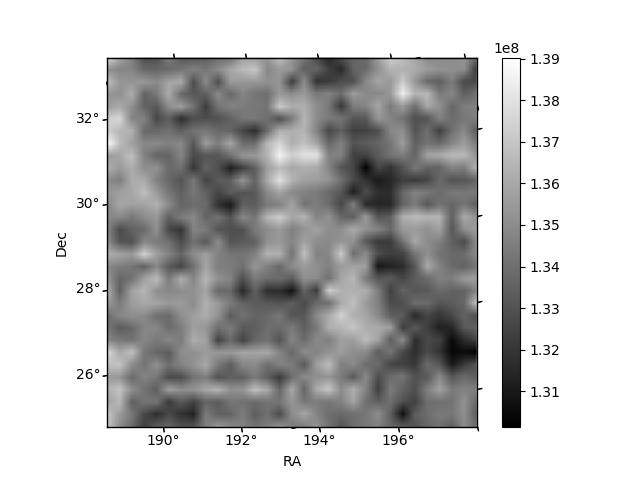
Histogram calculated using DETX and DETY for each event in the final _common_clean file
| Quadrant A | 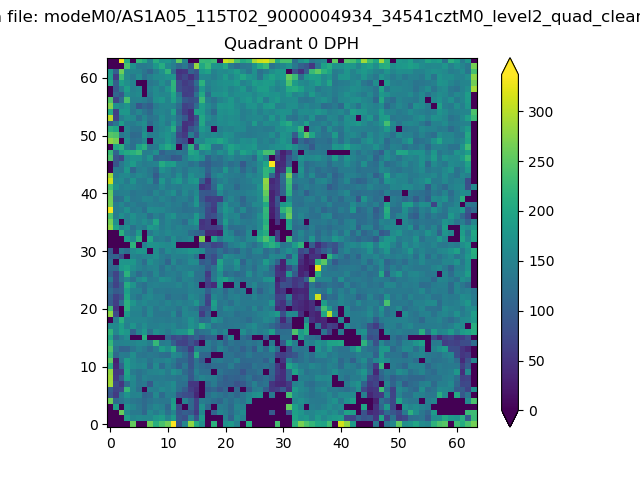 |
 |
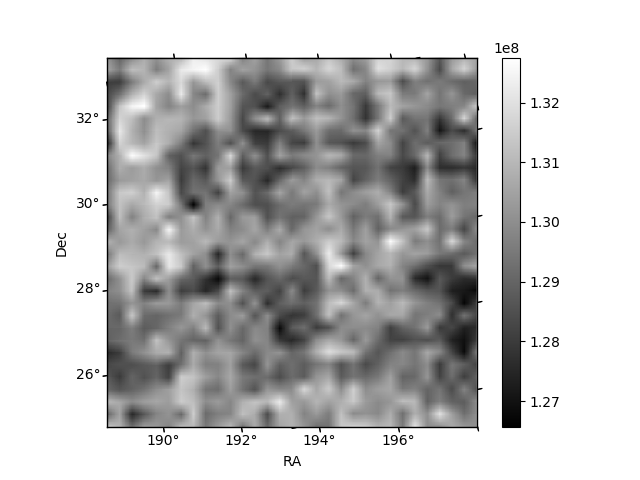
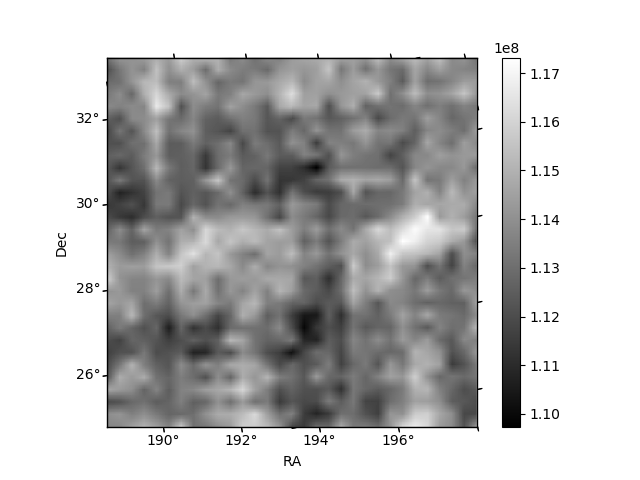
Quadrant B |
|---|---|---|---|
| Quadrant D | 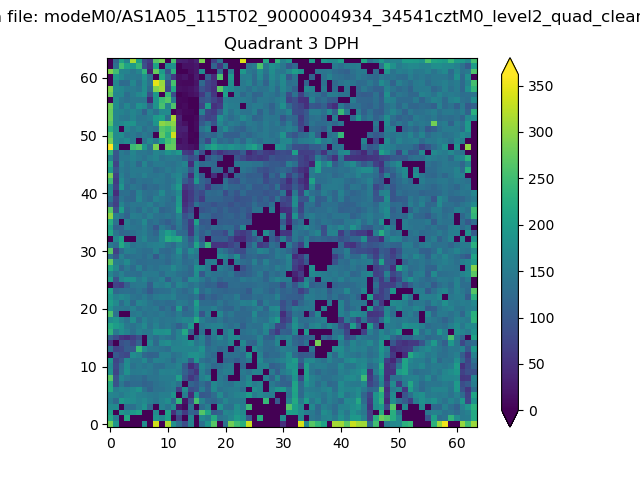 |
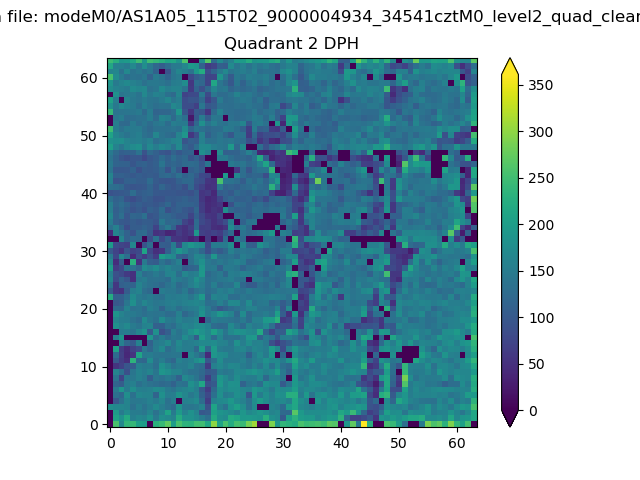 |
Quadrant C |
| Plot type | Count rate plots | Images |
|---|---|---|
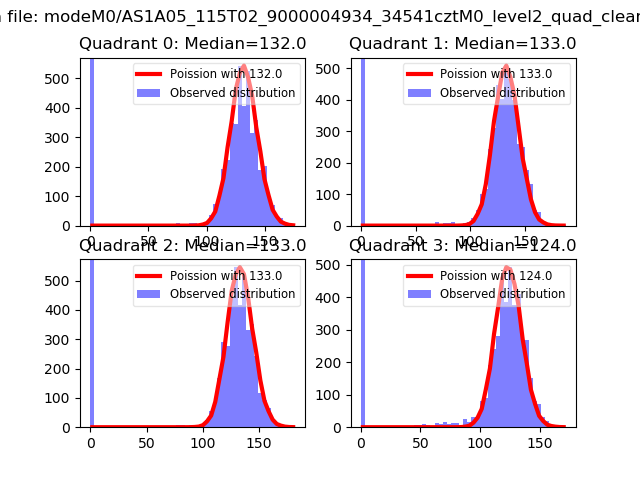
| Comparison with Poisson distribution Blue bars denote a histogram of data divided into 1 sec bins. Red curve is a Poisson curve with rate = median count rate of data. |
 |
 |
| Quadrant-wise count rates Data is divided into 100 sec bins |
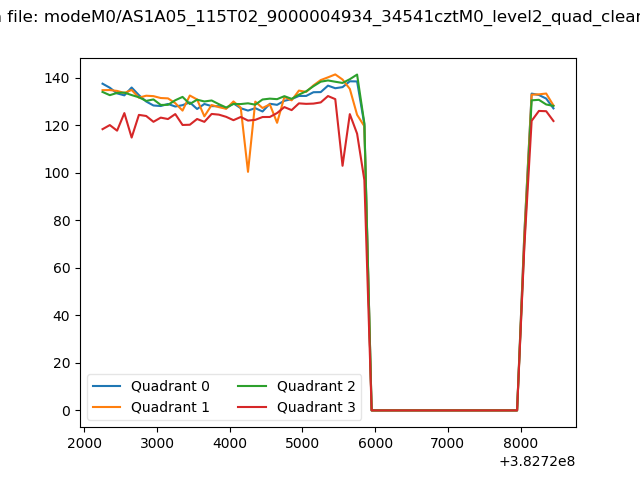 |
|
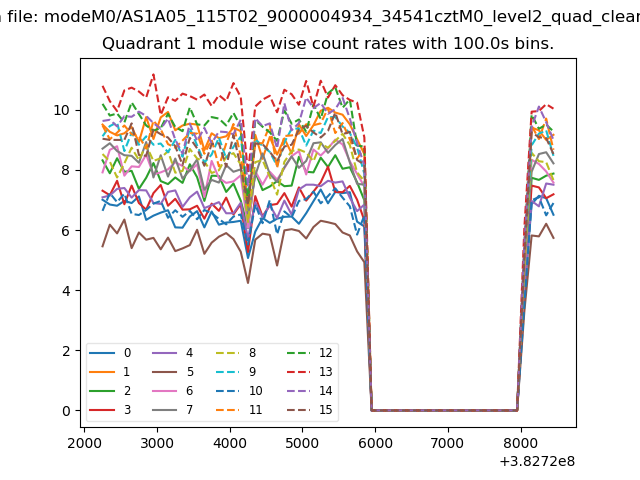
| Module-wise count rates for Quadrant A Data is divided into 100 sec bins |
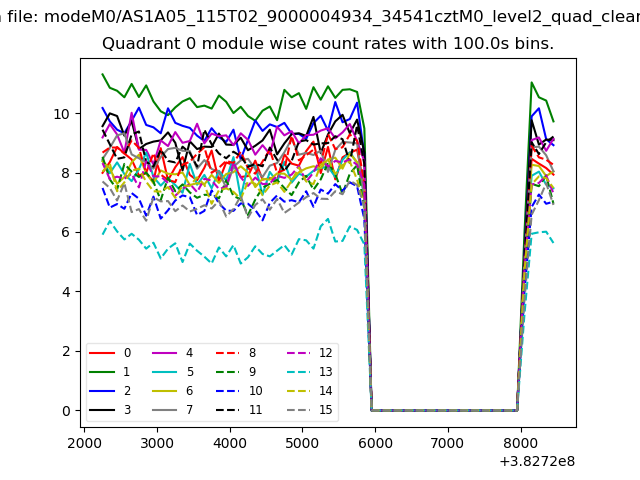 |
 |
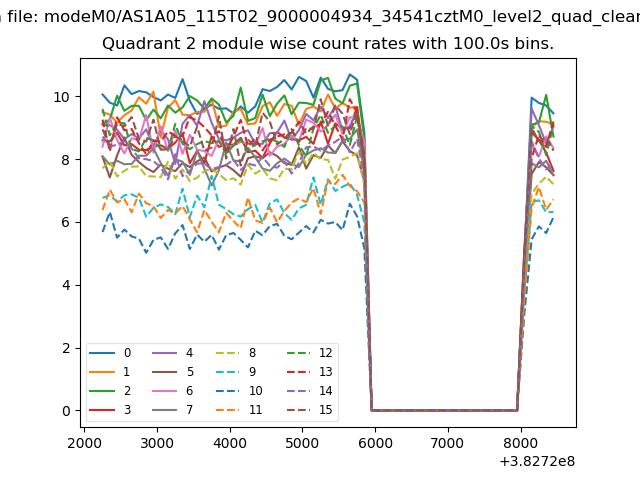
| Module-wise count rates for Quadrant B Data is divided into 100 sec bins |
 |
 |
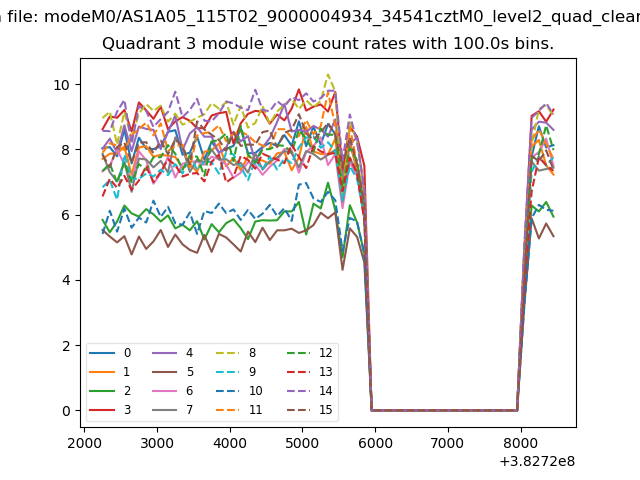
| Module-wise count rates for Quadrant C Data is divided into 100 sec bins |
 |
 |
| Module-wise count rates for Quadrant D Data is divided into 100 sec bins |
 |
 |
| Parameter | Plot |
|---|---|
| CZT HV Monitor | 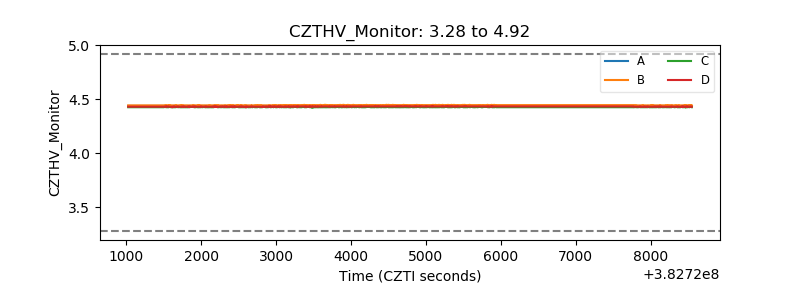 |
| D_VDD | 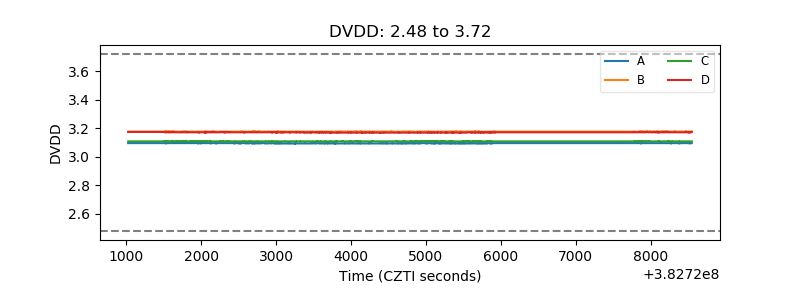 |
| Temperature 1 | 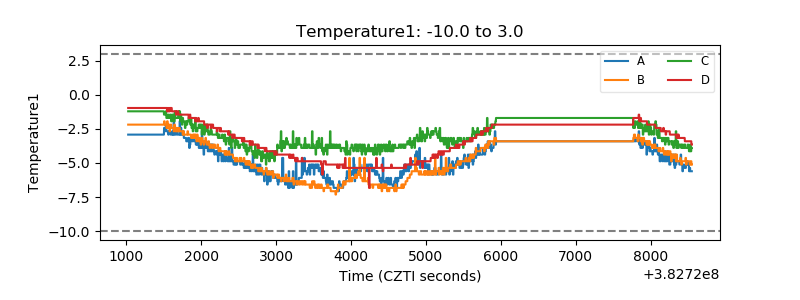 |
| Veto HV Monitor | 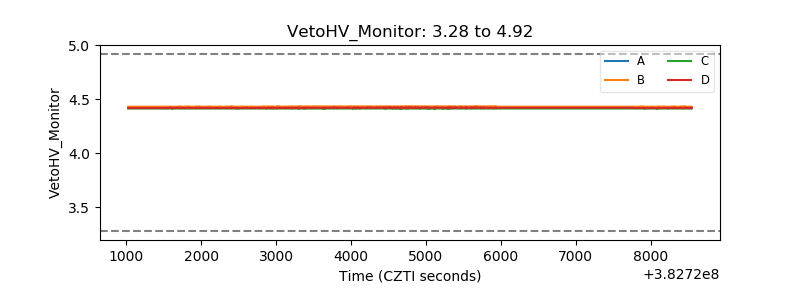 |
| Veto LLD | 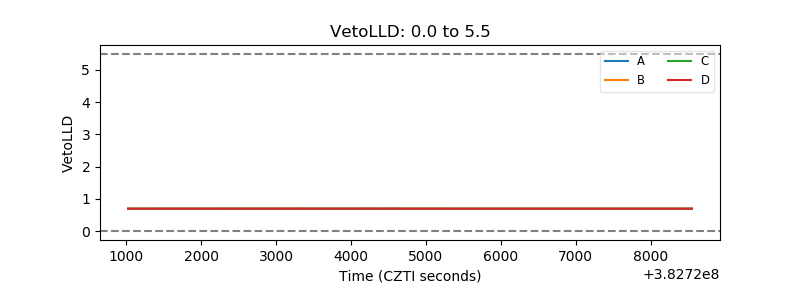 |
| Alpha Counter | 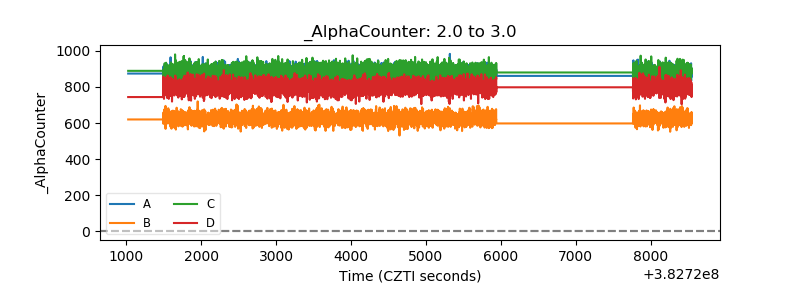 |
| _CPM_Rate | 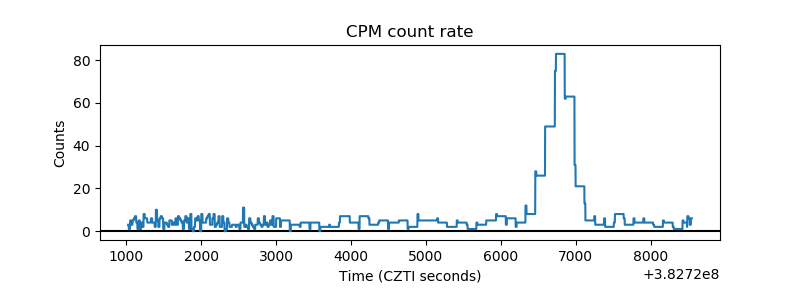 |
| CZT Counter | 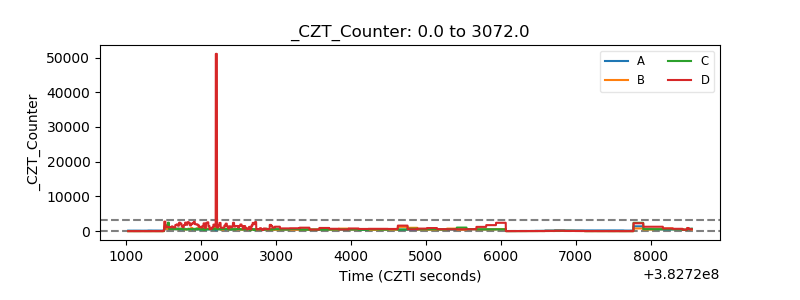 |
| +2.5 Volts monitor | 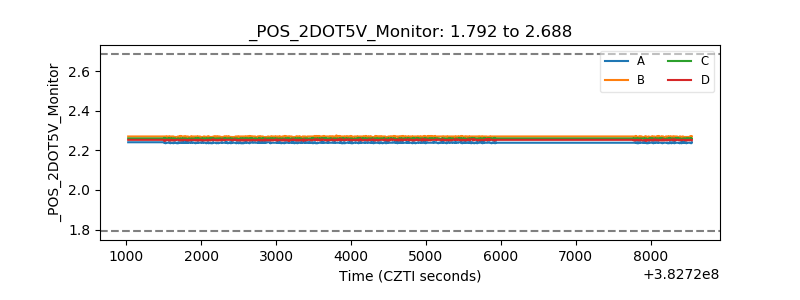 |
| +5 Volts monitor | 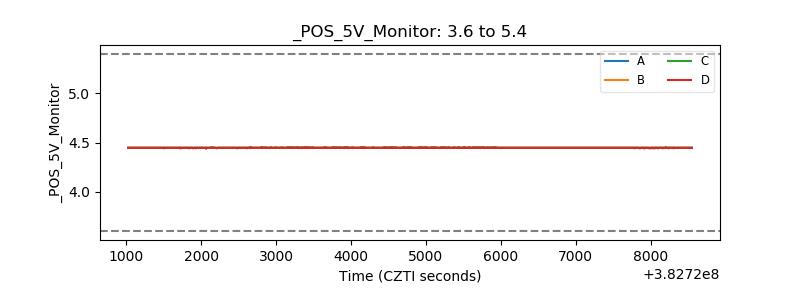 |
| _ROLL_ROT | 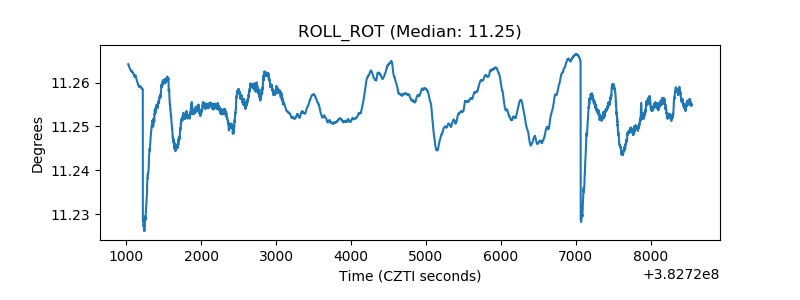 |
| _Roll_DEC | 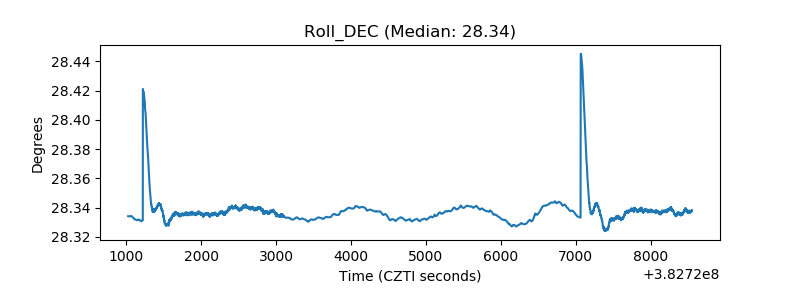 |
| _Roll_RA | 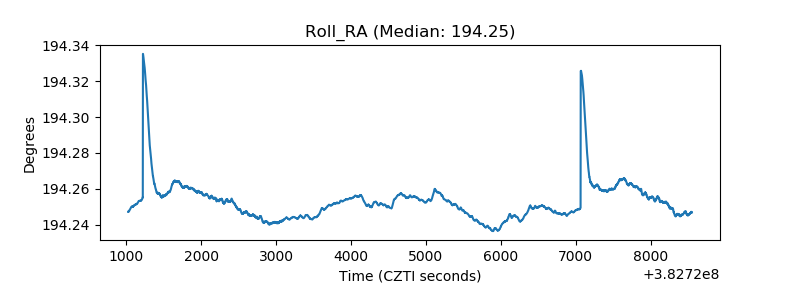 |
| Veto Counter | 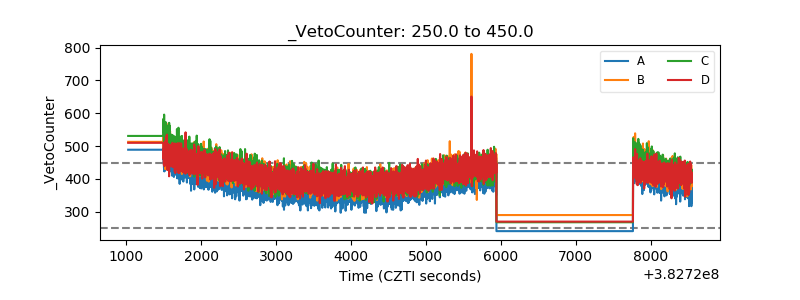 |