| Param | Original file | Final file |
|---|---|---|
| Filename | modeM0/AS1A05_115T02_9000004934_34536cztM0_level2.evt | modeM0/AS1A05_115T02_9000004934_34536cztM0_level2_quad_clean.evt |
| Size (bytes) | 63,639,360 | 8,651,520 |
| Size | 60.7 MB | 8.3 MB |
| Events in quadrant A | 407,908 | 52,321 |
| Events in quadrant B | 406,727 | 53,839 |
| Events in quadrant C | 480,879 | 50,682 |
| Events in quadrant D | 581,866 | 48,951 |
| Mode SS | |||
|---|---|---|---|
| Quadrant | BADHDUFLAG | Total packets | Discarded packets |
| A | 0 | 14 | 0 |
| B | 0 | 14 | 0 |
| C | 0 | 14 | 0 |
| D | 0 | 14 | 0 |
| Mode M0 | |||
|---|---|---|---|
| Quadrant | BADHDUFLAG | Total packets | Discarded packets |
| A | 0 | 1637 | 2 |
| B | 0 | 1629 | 1 |
| C | 0 | 1953 | 1 |
| D | 0 | 2185 | 1 |
| Mode M9 | |||
|---|---|---|---|
| Quadrant | BADHDUFLAG | Total packets | Discarded packets |
| A | 0 | 15 | 0 |
| B | 0 | 15 | 0 |
| C | 0 | 15 | 0 |
| D | 0 | 15 | 0 |
| Quadrant | Total seconds | Saturated seconds | Saturation percentage |
|---|---|---|---|
| A | 687 | 3 | 0.436681% |
| B | 687 | 6 | 0.873362% |
| C | 687 | 19 | 2.765648% |
| D | 687 | 18 | 2.620087% |
Noise dominated data is calculated using 1-second bins in cleaned event files. If a bin has >2000 counts, and if more than 50% of those come from <1% of pixels, then it is considered to be noise-dominated and hence unusable.
| Quadrant | # 1 sec bins | Bins with >0 counts | Bins with >2000 counts | High rate bins dominated by noise | Noise dominated (total time) | Noise dominated (detector-on time) | Marked lightcurve |
|---|---|---|---|---|---|---|---|
| A | 687 | 687 | 0 | 0 | 0.00% | 0.00% |  |
| B | 687 | 687 | 0 | 0 | 0.00% | 0.00% |  |
| C | 687 | 687 | 14 | 14 | 2.04% | 2.04% |  |
| D | 687 | 687 | 11 | 11 | 1.60% | 1.60% |  |
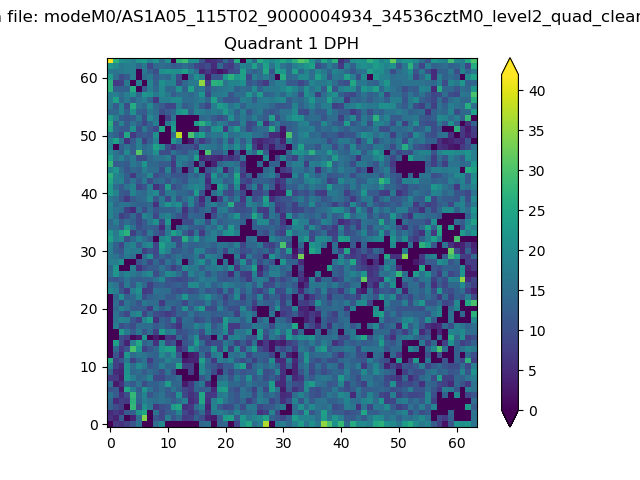
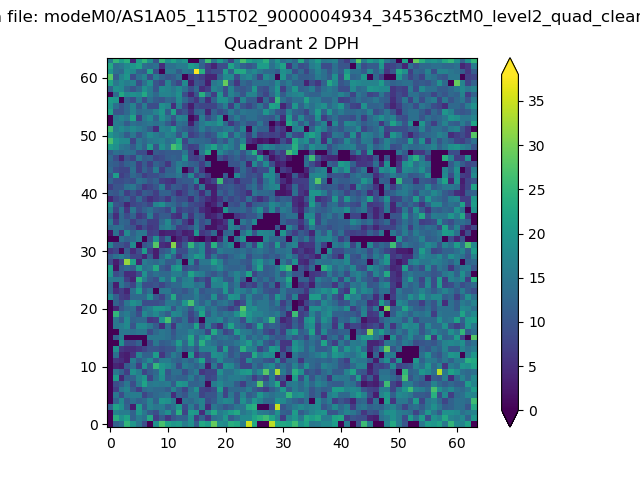
Top three noisy pixels from each quadrant. If the there are fewer than three noisy pixels in the level2.evt file, extra rows are filled as -1
| Pixel properties | Quadrant properties | ||||||
|---|---|---|---|---|---|---|---|
| Quadrant | DetID | PixID | Counts | Sigma | Mean | Median | Sigma |
| A | 10 | 83 | 15875 | 715.62 | 100 | 98 | 22.0 |
| A | 9 | 143 | 2581 | 112.62 | 100 | 98 | 22.0 |
| A | 13 | 6 | 1085 | 44.77 | 100 | 98 | 22.0 |
| B | 5 | 172 | 24189 | 1167.17 | 97 | 96 | 20.6 |
| B | 12 | 111 | 2102 | 97.18 | 97 | 96 | 20.6 |
| B | 11 | 111 | 1987 | 91.61 | 97 | 96 | 20.6 |
| C | 0 | 10 | 54649 | 2355.85 | 93 | 94 | 23.2 |
| C | 15 | 214 | 34852 | 1500.95 | 93 | 94 | 23.2 |
| C | 14 | 67 | 26564 | 1143.05 | 93 | 94 | 23.2 |
| D | 8 | 195 | 101999 | 4094.1 | 95 | 92 | 24.9 |
| D | 12 | 6 | 60882 | 2442.23 | 95 | 92 | 24.9 |
| D | 2 | 249 | 26817 | 1073.67 | 95 | 92 | 24.9 |
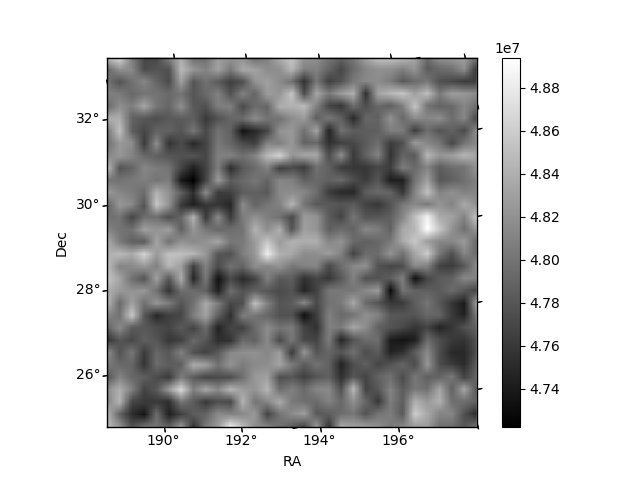
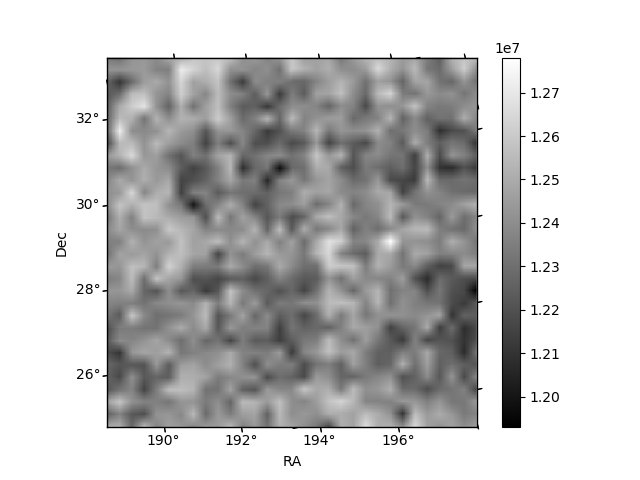
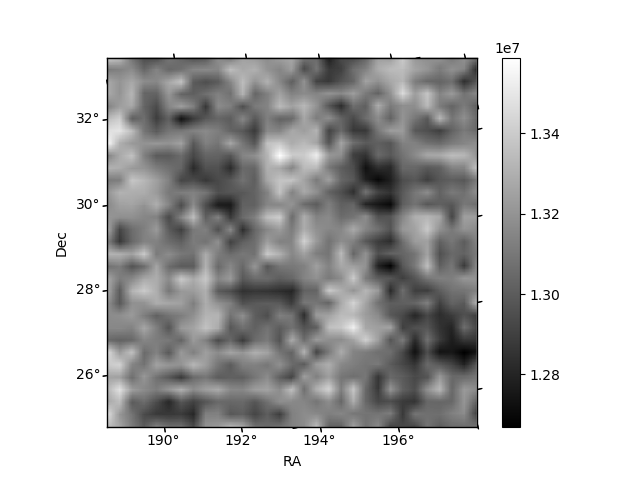
Histogram calculated using DETX and DETY for each event in the final _common_clean file
| Quadrant A | 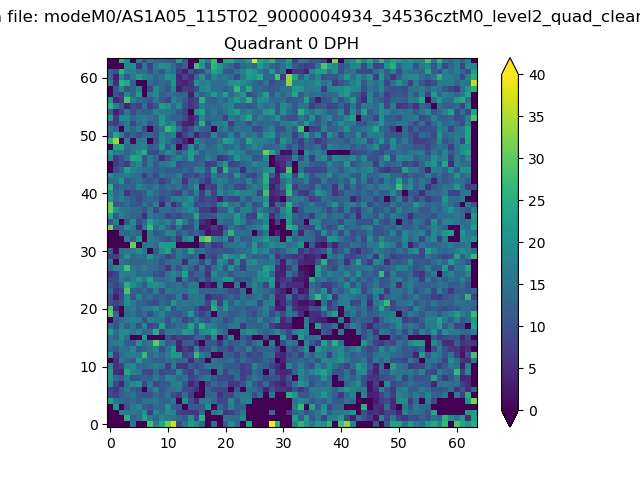 |
 |
Quadrant B |
|---|---|---|---|
| Quadrant D | 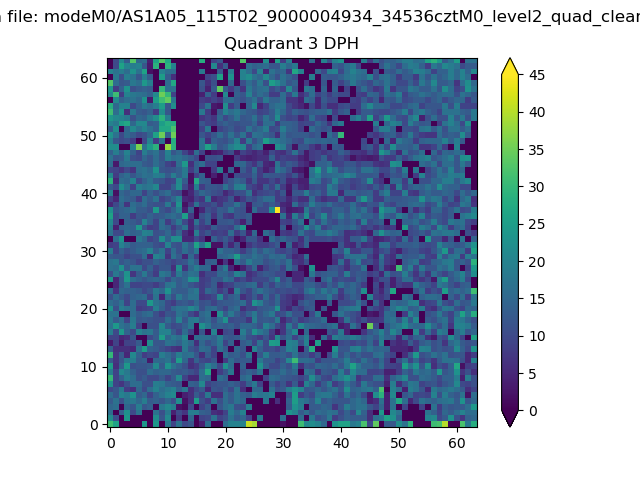 |
 |
Quadrant C |
| Plot type | Count rate plots | Images |
|---|---|---|
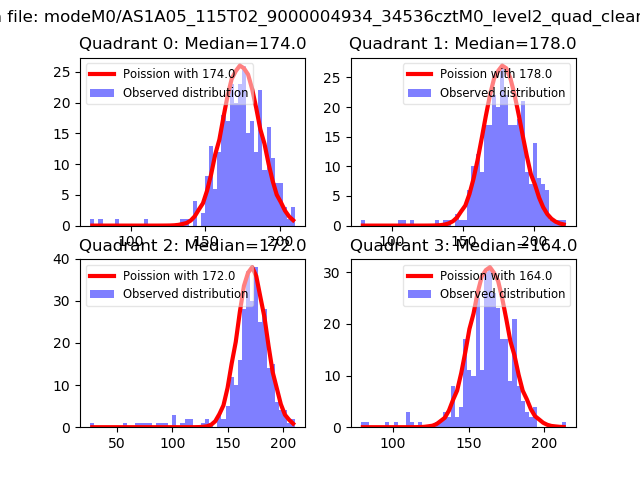
| Comparison with Poisson distribution Blue bars denote a histogram of data divided into 1 sec bins. Red curve is a Poisson curve with rate = median count rate of data. |
 |
 |
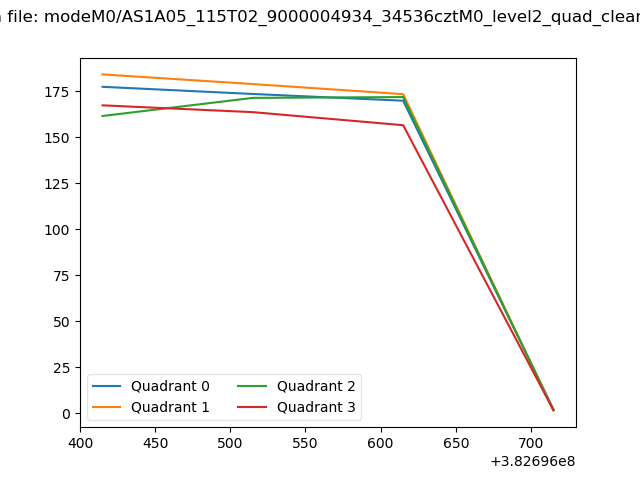
| Quadrant-wise count rates Data is divided into 100 sec bins |
 |
|
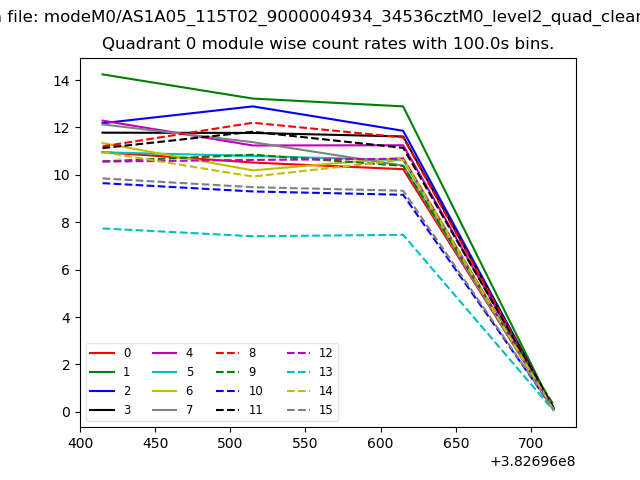
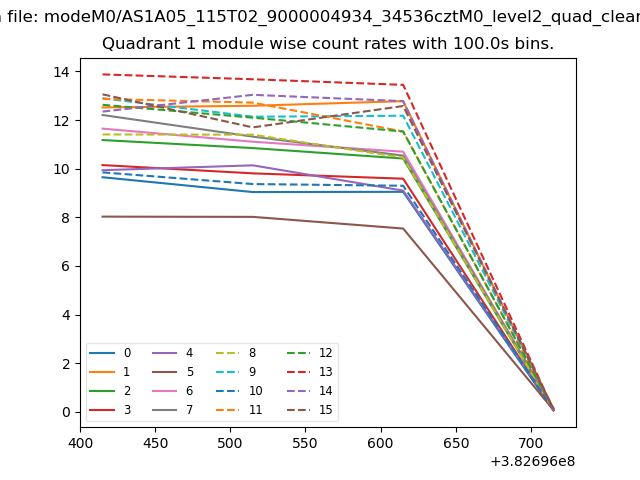
| Module-wise count rates for Quadrant A Data is divided into 100 sec bins |
 |
 |
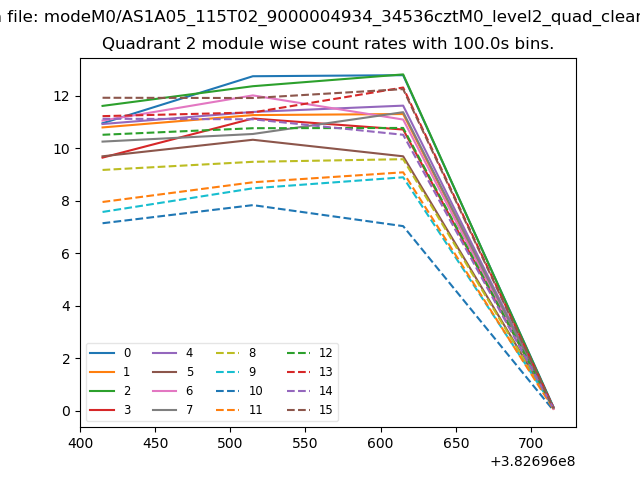
| Module-wise count rates for Quadrant B Data is divided into 100 sec bins |
 |
 |
| Module-wise count rates for Quadrant C Data is divided into 100 sec bins |
 |
 |
| Module-wise count rates for Quadrant D Data is divided into 100 sec bins |
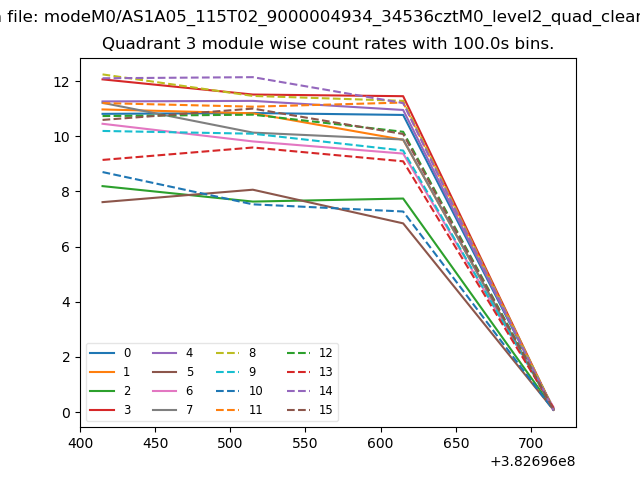 |
 |
| Parameter | Plot |
|---|---|
| CZT HV Monitor | 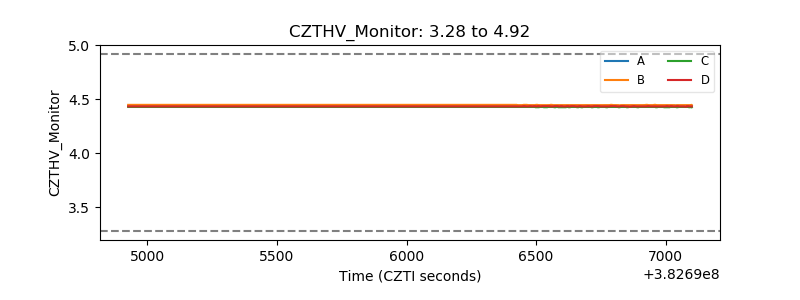 |
| D_VDD | 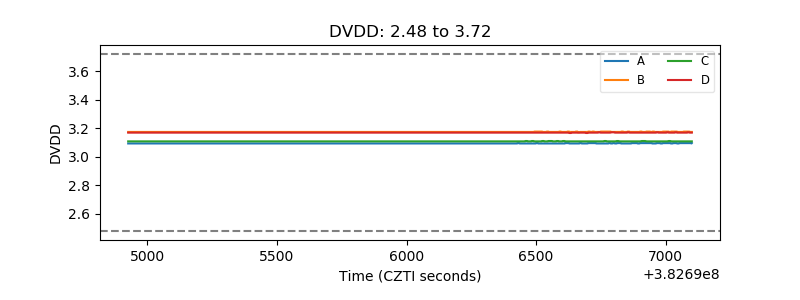 |
| Temperature 1 | 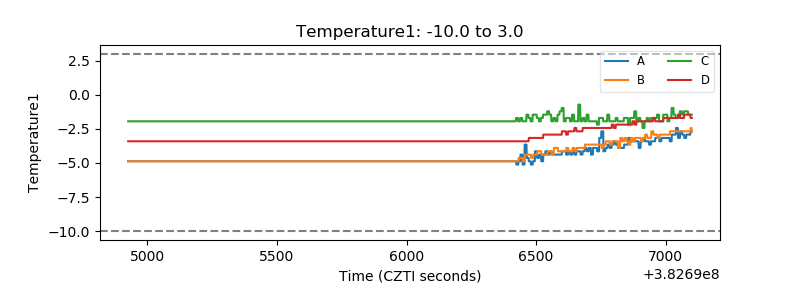 |
| Veto HV Monitor | 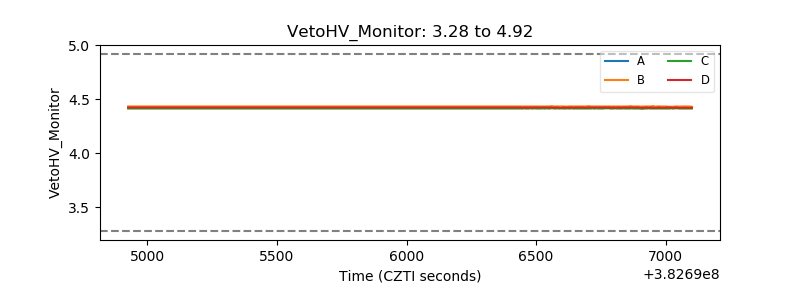 |
| Veto LLD | 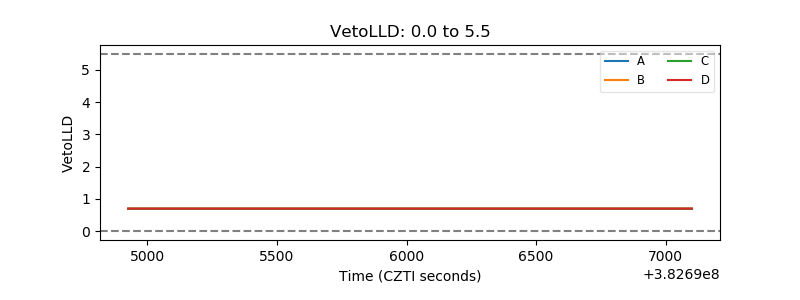 |
| Alpha Counter | 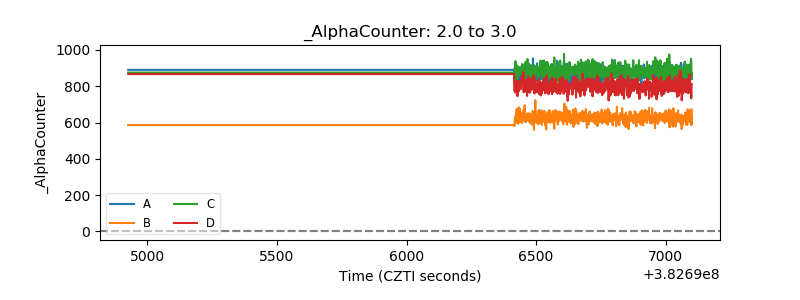 |
| _CPM_Rate | 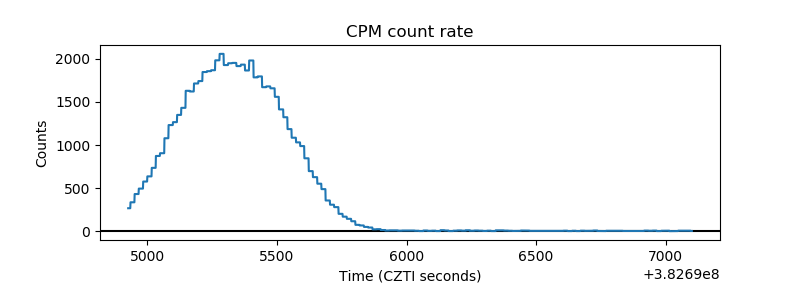 |
| CZT Counter | 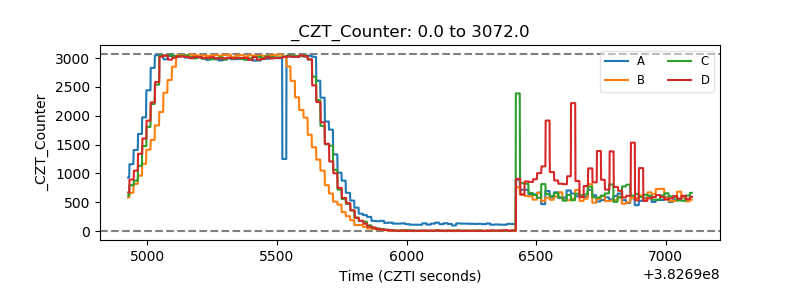 |
| +2.5 Volts monitor | 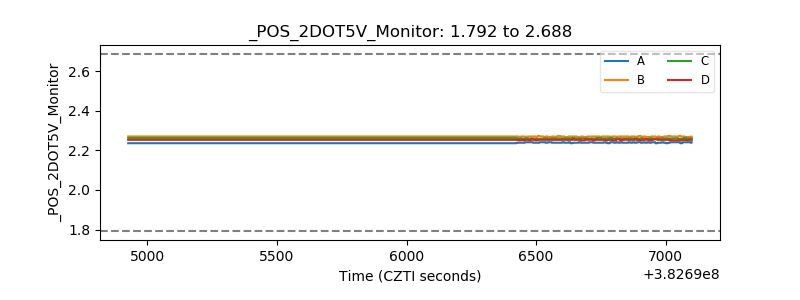 |
| +5 Volts monitor | 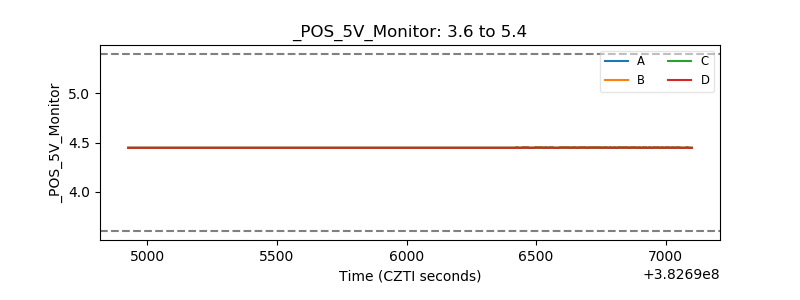 |
| _ROLL_ROT | 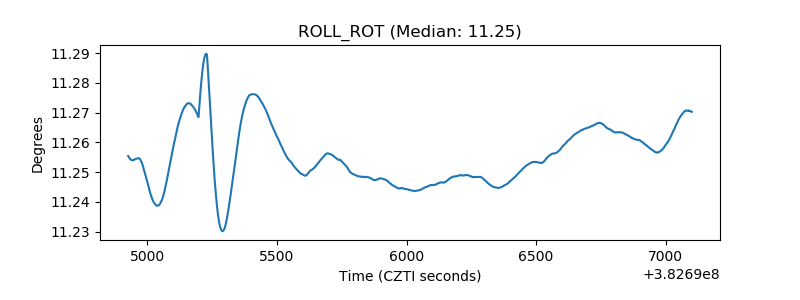 |
| _Roll_DEC | 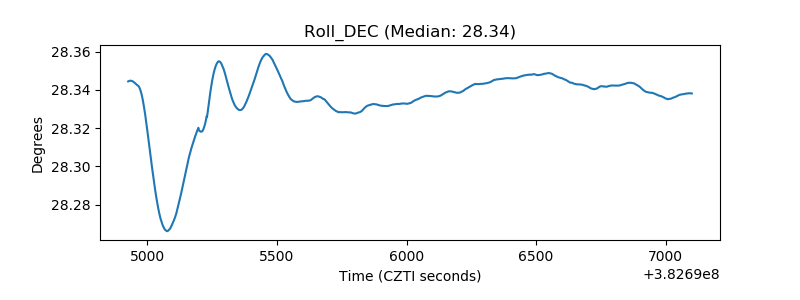 |
| _Roll_RA | 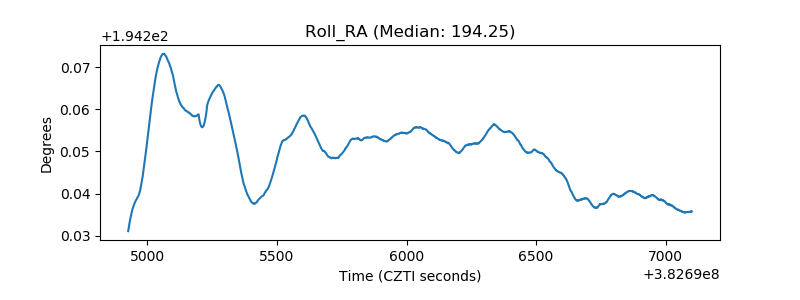 |
| Veto Counter | 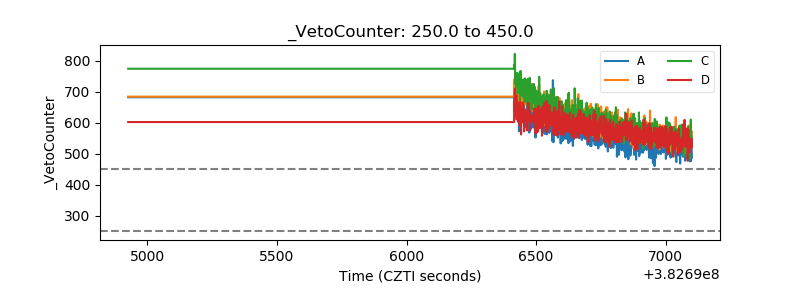 |