| Param | Original file | Final file |
|---|---|---|
| Filename | modeM0/AS1A05_103T05_9000004930_34692cztM0_level2.evt | modeM0/AS1A05_103T05_9000004930_34692cztM0_level2_quad_clean.evt |
| Size (bytes) | 335,560,320 | 43,698,240 |
| Size | 320.0 MB | 41.7 MB |
| Events in quadrant A | 1,922,875 | 274,792 |
| Events in quadrant B | 3,491,469 | 250,252 |
| Events in quadrant C | 1,898,246 | 270,428 |
| Events in quadrant D | 2,588,763 | 257,006 |
| Mode M9 | |||
|---|---|---|---|
| Quadrant | BADHDUFLAG | Total packets | Discarded packets |
| A | 0 | 14 | 5 |
| B | 0 | 14 | 4 |
| C | 0 | 15 | 5 |
| D | 0 | 15 | 3 |
| Mode M0 | |||
|---|---|---|---|
| Quadrant | BADHDUFLAG | Total packets | Discarded packets |
| A | 0 | 9816 | 1567 |
| B | 0 | 15546 | 2728 |
| C | 0 | 9573 | 1622 |
| D | 0 | 12080 | 1793 |
| Mode SS | |||
|---|---|---|---|
| Quadrant | BADHDUFLAG | Total packets | Discarded packets |
| A | 0 | 89 | 7 |
| B | 0 | 95 | 14 |
| C | 0 | 95 | 6 |
| D | 0 | 96 | 14 |
| Quadrant | Total seconds | Saturated seconds | Saturation percentage |
|---|---|---|---|
| A | 3861 | 7 | 0.181300% |
| B | 3753 | 585 | 15.587530% |
| C | 3829 | 13 | 0.339514% |
| D | 3794 | 61 | 1.607802% |
Noise dominated data is calculated using 1-second bins in cleaned event files. If a bin has >2000 counts, and if more than 50% of those come from <1% of pixels, then it is considered to be noise-dominated and hence unusable.
| Quadrant | # 1 sec bins | Bins with >0 counts | Bins with >2000 counts | High rate bins dominated by noise | Noise dominated (total time) | Noise dominated (detector-on time) | Marked lightcurve |
|---|---|---|---|---|---|---|---|
| A | 6159 | 4089 | 1 | 1 | 0.02% | 0.02% | 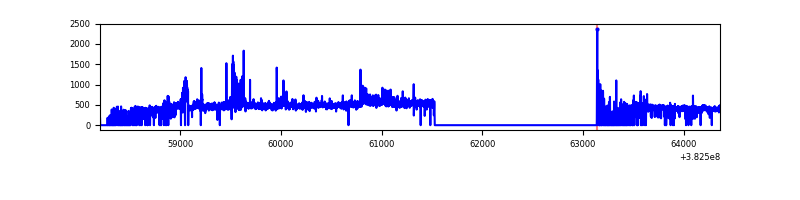 |
| B | 6056 | 4026 | 386 | 386 | 6.37% | 9.59% | 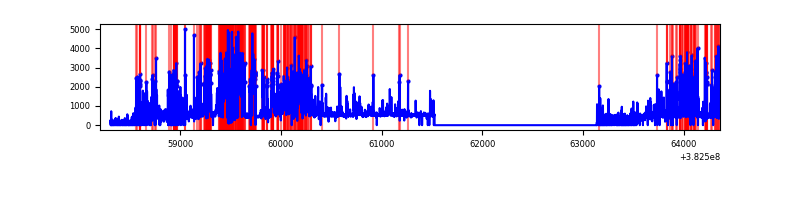 |
| C | 6131 | 4082 | 2 | 2 | 0.03% | 0.05% | 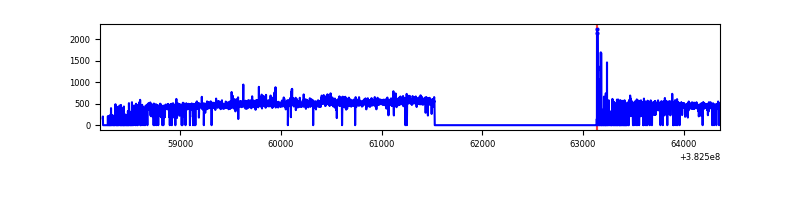 |
| D | 6112 | 4082 | 24 | 24 | 0.39% | 0.59% | 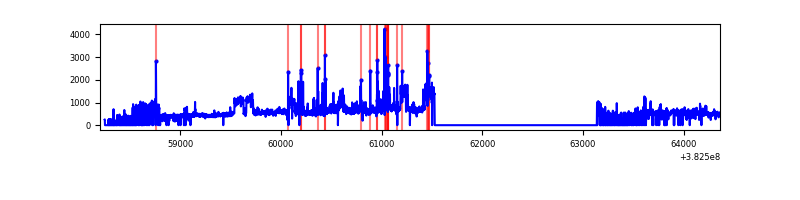 |
Top three noisy pixels from each quadrant. If the there are fewer than three noisy pixels in the level2.evt file, extra rows are filled as -1
| Pixel properties | Quadrant properties | ||||||
|---|---|---|---|---|---|---|---|
| Quadrant | DetID | PixID | Counts | Sigma | Mean | Median | Sigma |
| A | 15 | 169 | 167945 | 1856.98 | 444 | 435 | 90.2 |
| A | 10 | 83 | 15380 | 165.68 | 444 | 435 | 90.2 |
| A | 9 | 143 | 7377 | 76.96 | 444 | 435 | 90.2 |
| B | 5 | 172 | 1691158 | 21537.16 | 399 | 388 | 78.5 |
| B | 5 | 255 | 183512 | 2332.65 | 399 | 388 | 78.5 |
| B | 15 | 85 | 11842 | 145.9 | 399 | 388 | 78.5 |
| C | 15 | 214 | 156992 | 1555.42 | 426 | 429 | 100.7 |
| C | 14 | 67 | 42035 | 413.35 | 426 | 429 | 100.7 |
| C | 0 | 10 | 21947 | 213.78 | 426 | 429 | 100.7 |
| D | 8 | 195 | 688500 | 6629.92 | 421 | 409 | 103.8 |
| D | 2 | 250 | 84638 | 811.57 | 421 | 409 | 103.8 |
| D | 10 | 199 | 62599 | 599.22 | 421 | 409 | 103.8 |
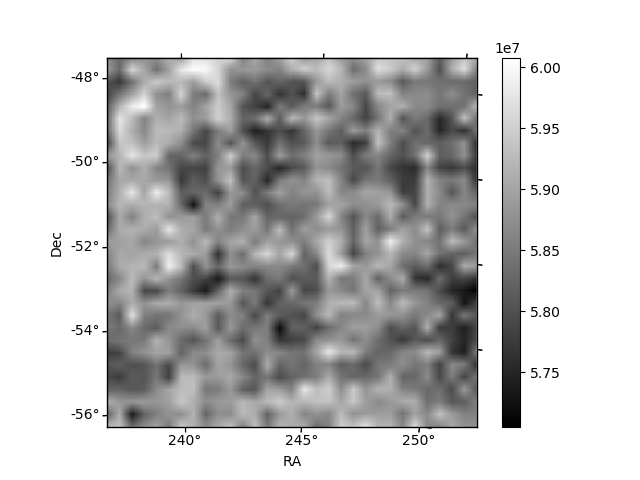
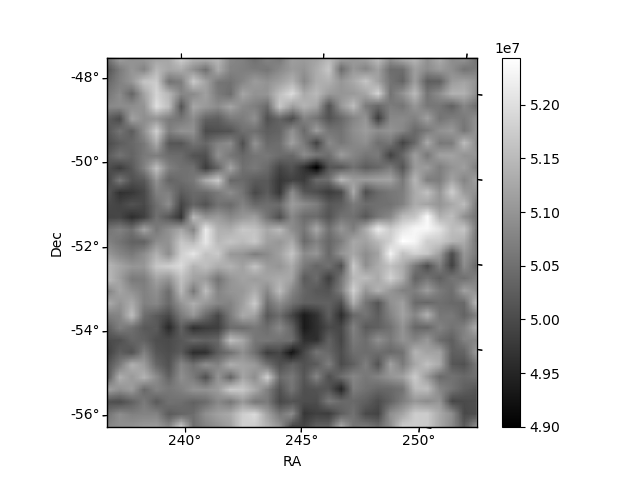
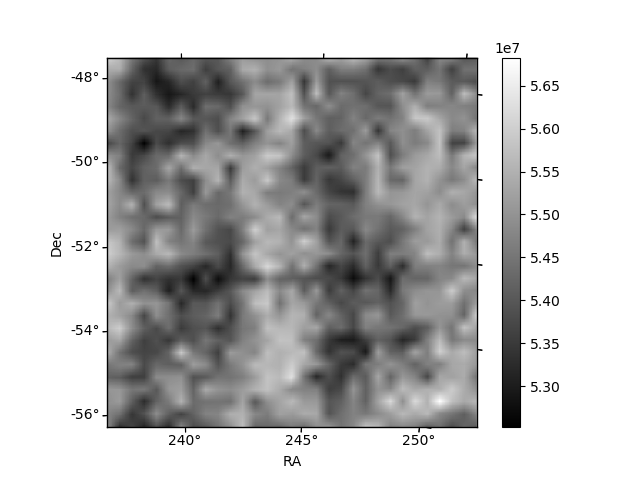
Histogram calculated using DETX and DETY for each event in the final _common_clean file
| Quadrant A | 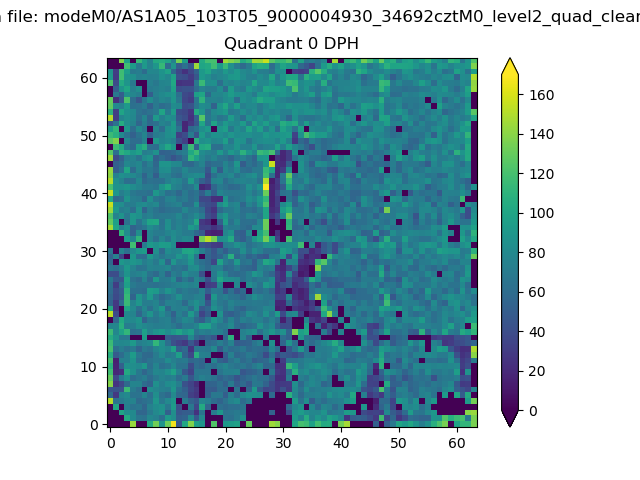 |
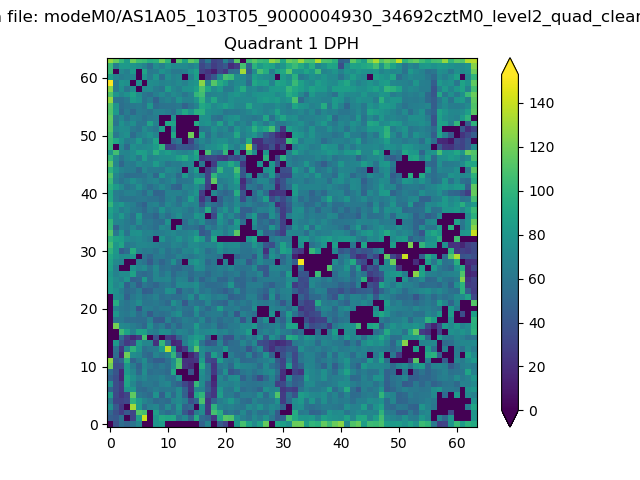 |
Quadrant B |
|---|---|---|---|
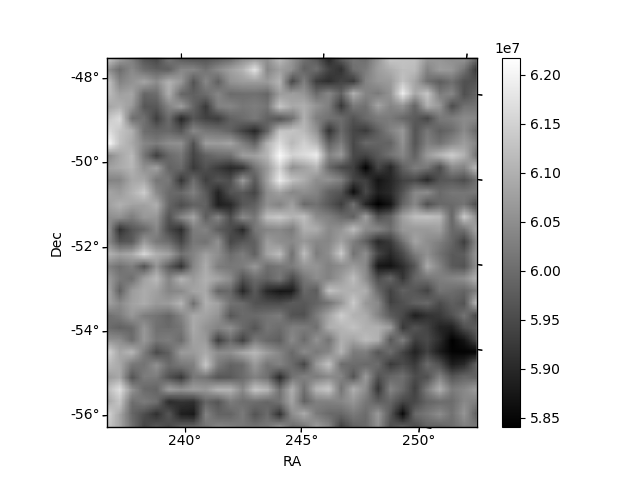
| Quadrant D | 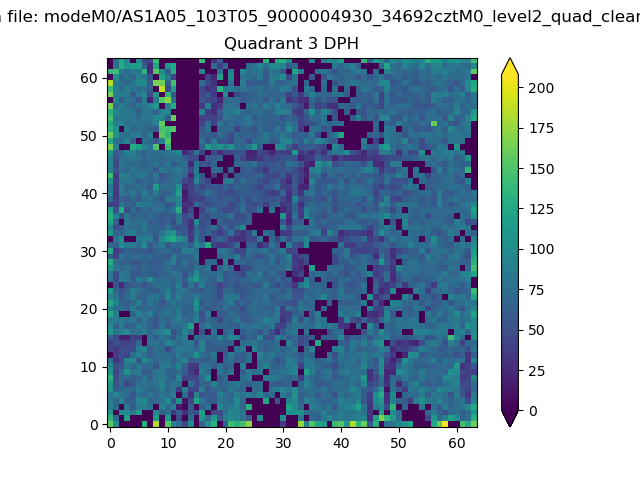 |
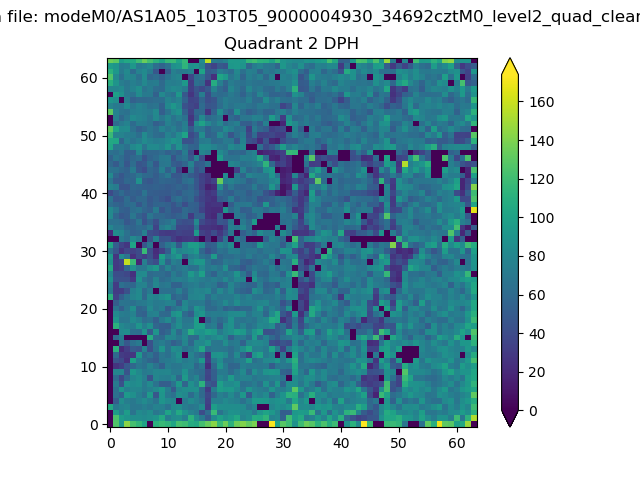 |
Quadrant C |
| Plot type | Count rate plots | Images |
|---|---|---|
| Comparison with Poisson distribution Blue bars denote a histogram of data divided into 1 sec bins. Red curve is a Poisson curve with rate = median count rate of data. |
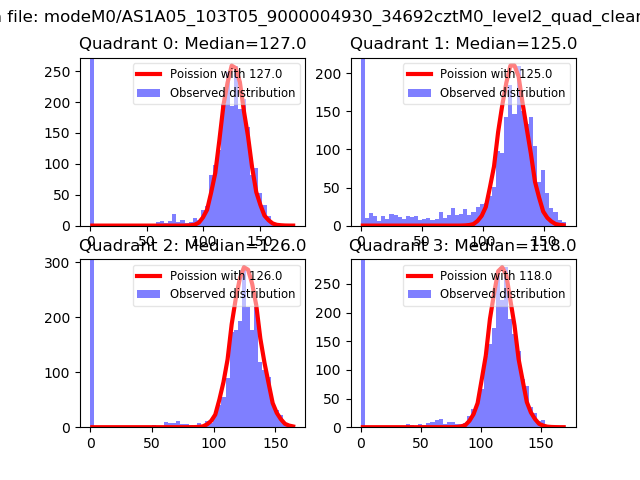 |
 |
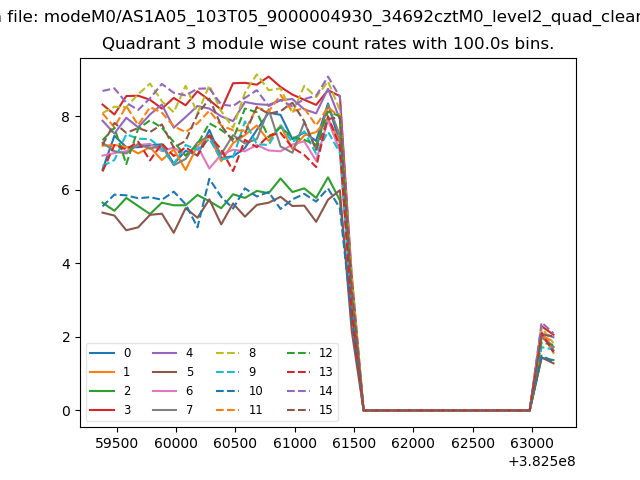
| Quadrant-wise count rates Data is divided into 100 sec bins |
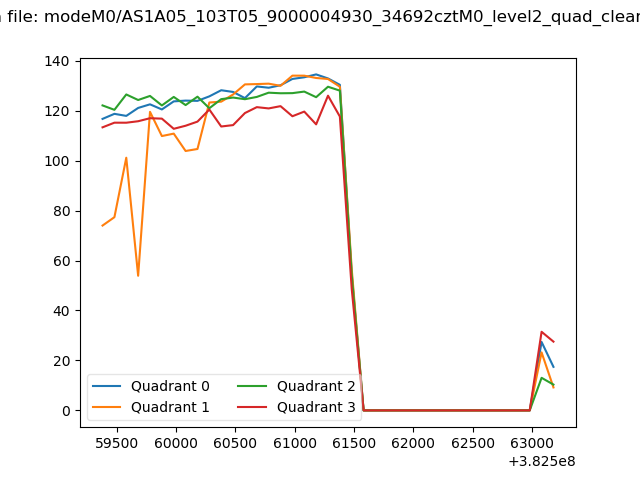 |
|
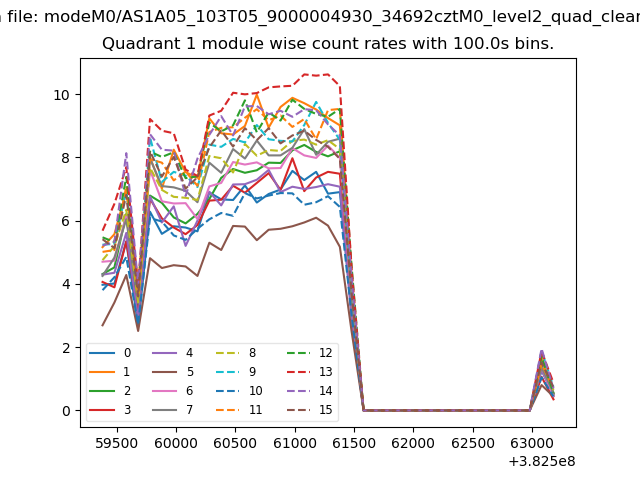
| Module-wise count rates for Quadrant A Data is divided into 100 sec bins |
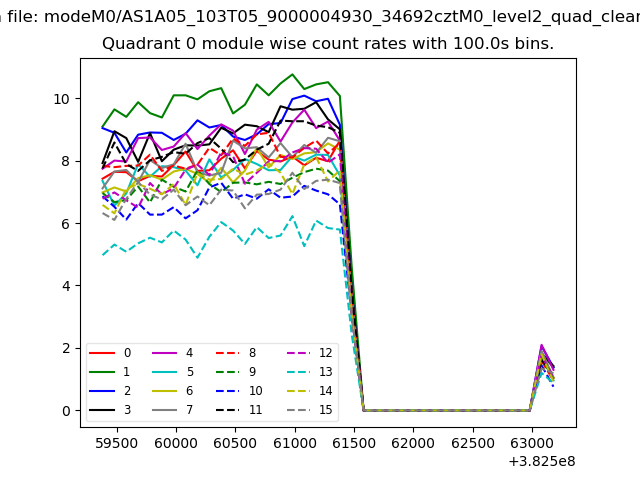 |
 |
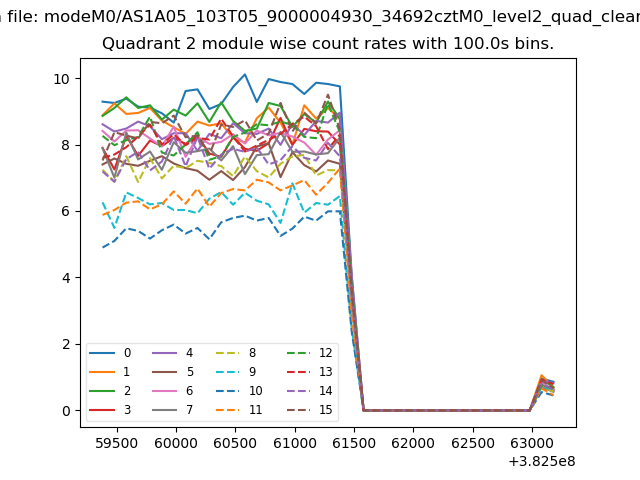
| Module-wise count rates for Quadrant B Data is divided into 100 sec bins |
 |
 |
| Module-wise count rates for Quadrant C Data is divided into 100 sec bins |
 |
 |
| Module-wise count rates for Quadrant D Data is divided into 100 sec bins |
 |
 |
| Parameter | Plot |
|---|---|
| CZT HV Monitor | 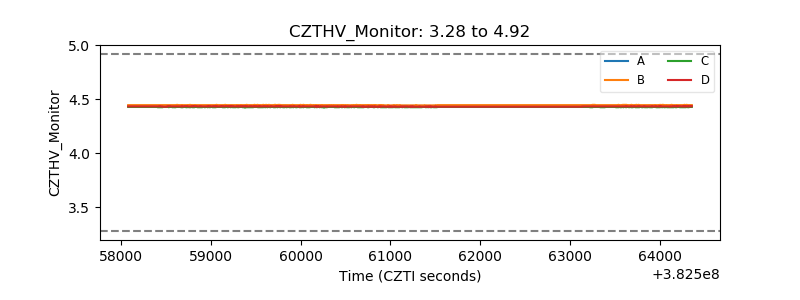 |
| D_VDD | 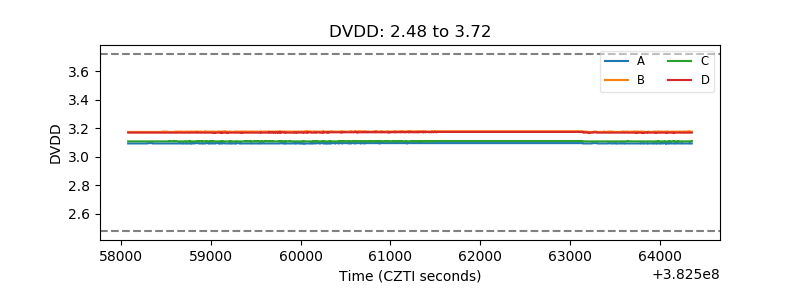 |
| Temperature 1 | 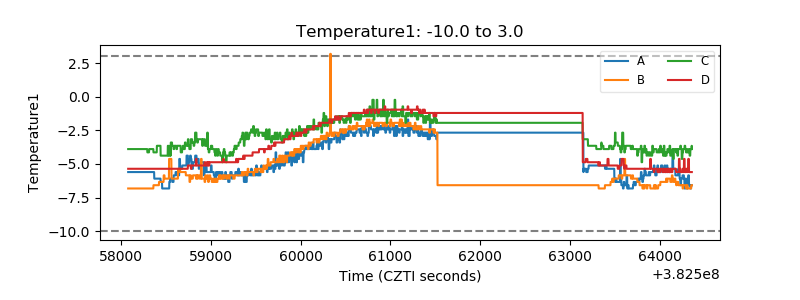 |
| Veto HV Monitor |  |
| Veto LLD | 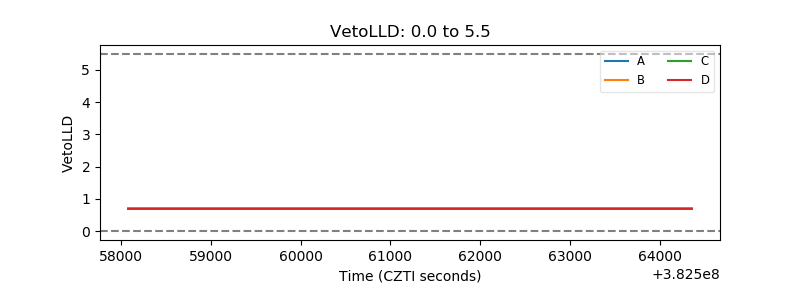 |
| Alpha Counter | 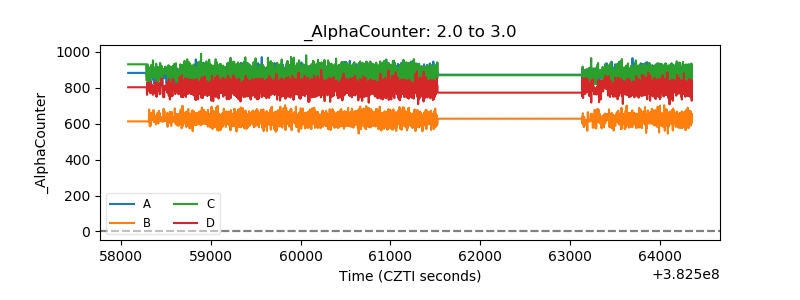 |
| _CPM_Rate | 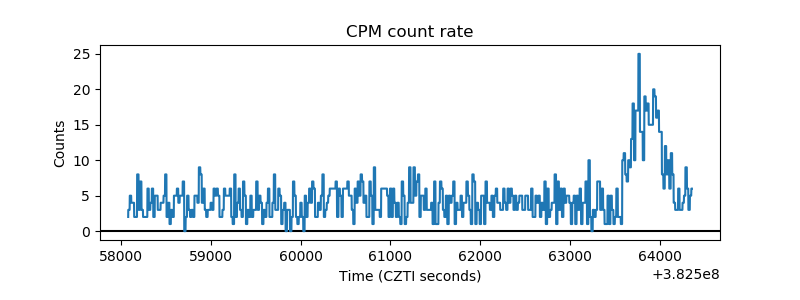 |
| CZT Counter | 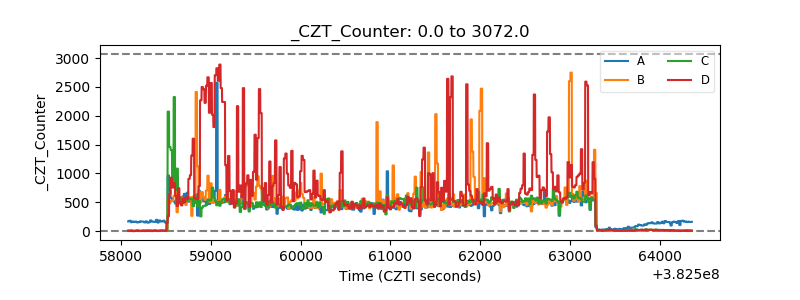 |
| +2.5 Volts monitor | 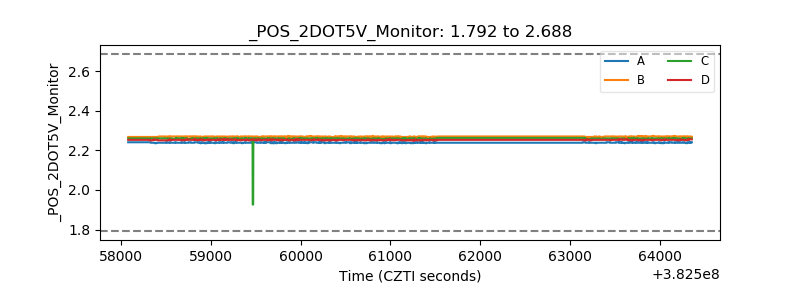 |
| +5 Volts monitor | 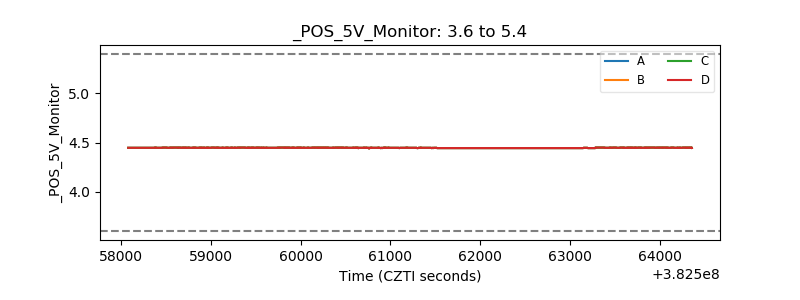 |
| _ROLL_ROT | 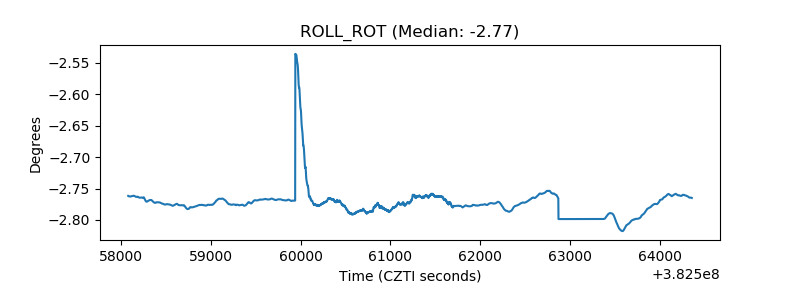 |
| _Roll_DEC | 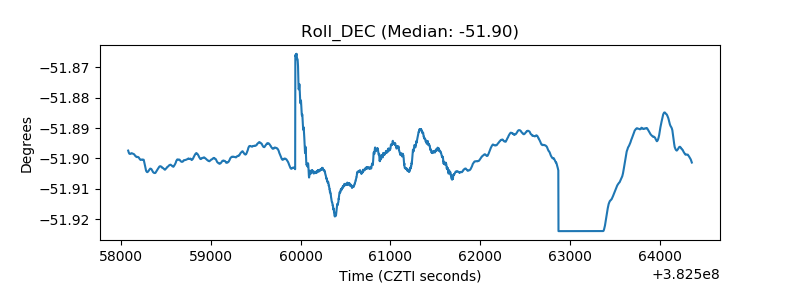 |
| _Roll_RA | 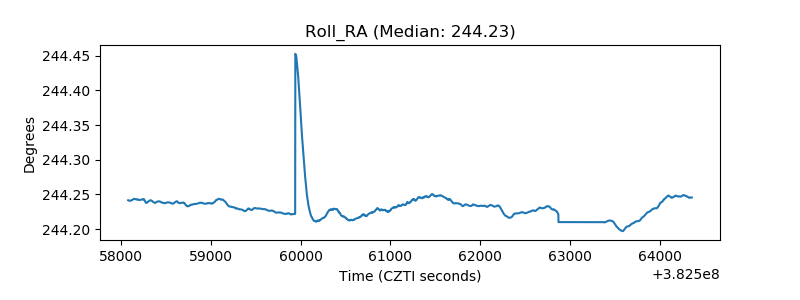 |
| Veto Counter | 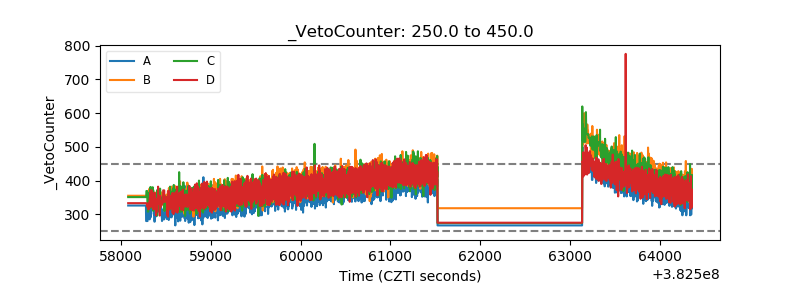 |