| Param | Original file | Final file |
|---|---|---|
| Filename | modeM0/AS1A05_103T05_9000004930_34514cztM0_level2.evt | modeM0/AS1A05_103T05_9000004930_34514cztM0_level2_quad_clean.evt |
| Size (bytes) | 546,482,880 | 89,663,040 |
| Size | 521.2 MB | 85.5 MB |
| Events in quadrant A | 2,688,806 | 596,770 |
| Events in quadrant B | 4,105,592 | 586,339 |
| Events in quadrant C | 3,123,241 | 590,178 |
| Events in quadrant D | 6,241,014 | 537,828 |
| Mode M9 | |||
|---|---|---|---|
| Quadrant | BADHDUFLAG | Total packets | Discarded packets |
| A | 0 | 27 | 0 |
| B | 0 | 27 | 0 |
| C | 0 | 27 | 0 |
| D | 0 | 28 | 0 |
| Mode M0 | |||
|---|---|---|---|
| Quadrant | BADHDUFLAG | Total packets | Discarded packets |
| A | 0 | 11849 | 3 |
| B | 0 | 16054 | 2 |
| C | 0 | 12806 | 2 |
| D | 0 | 22706 | 2 |
| Mode SS | |||
|---|---|---|---|
| Quadrant | BADHDUFLAG | Total packets | Discarded packets |
| A | 0 | 116 | 0 |
| B | 0 | 116 | 0 |
| C | 0 | 116 | 0 |
| D | 0 | 116 | 0 |
| Quadrant | Total seconds | Saturated seconds | Saturation percentage |
|---|---|---|---|
| A | 5785 | 9 | 0.155575% |
| B | 5785 | 393 | 6.793431% |
| C | 5785 | 60 | 1.037165% |
| D | 5785 | 689 | 11.910112% |
Noise dominated data is calculated using 1-second bins in cleaned event files. If a bin has >2000 counts, and if more than 50% of those come from <1% of pixels, then it is considered to be noise-dominated and hence unusable.
| Quadrant | # 1 sec bins | Bins with >0 counts | Bins with >2000 counts | High rate bins dominated by noise | Noise dominated (total time) | Noise dominated (detector-on time) | Marked lightcurve |
|---|---|---|---|---|---|---|---|
| A | 7128 | 5786 | 3 | 3 | 0.04% | 0.05% | 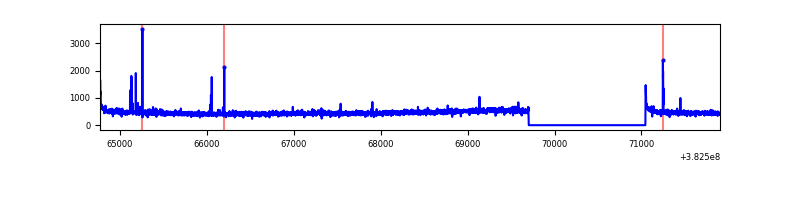 |
| B | 7128 | 5786 | 260 | 260 | 3.65% | 4.49% | 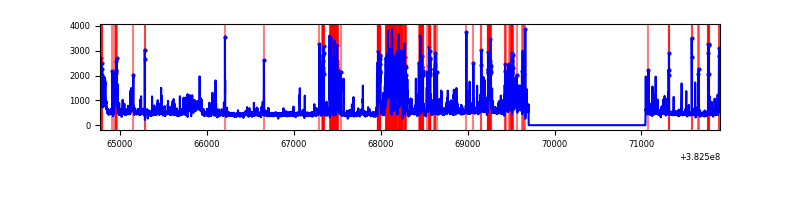 |
| C | 7128 | 5786 | 41 | 41 | 0.58% | 0.71% | 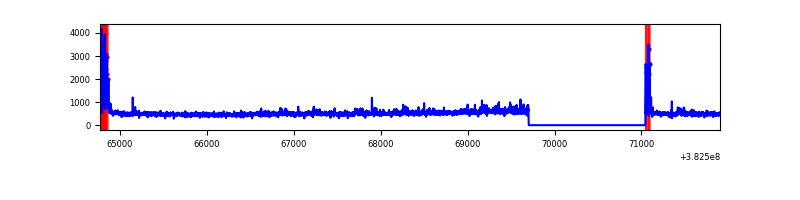 |
| D | 7128 | 5786 | 599 | 599 | 8.40% | 10.35% |  |
Top three noisy pixels from each quadrant. If the there are fewer than three noisy pixels in the level2.evt file, extra rows are filled as -1
| Pixel properties | Quadrant properties | ||||||
|---|---|---|---|---|---|---|---|
| Quadrant | DetID | PixID | Counts | Sigma | Mean | Median | Sigma |
| A | 10 | 83 | 42105 | 304.93 | 669 | 655 | 135.9 |
| A | 9 | 143 | 30333 | 218.33 | 669 | 655 | 135.9 |
| A | 13 | 6 | 11510 | 79.86 | 669 | 655 | 135.9 |
| B | 5 | 172 | 1051784 | 8426.54 | 652 | 635 | 124.7 |
| B | 0 | 190 | 192780 | 1540.33 | 652 | 635 | 124.7 |
| B | 0 | 189 | 110672 | 882.11 | 652 | 635 | 124.7 |
| C | 15 | 214 | 242492 | 1602.28 | 651 | 656 | 150.9 |
| C | 0 | 10 | 147429 | 972.44 | 651 | 656 | 150.9 |
| C | 14 | 67 | 133050 | 877.17 | 651 | 656 | 150.9 |
| D | 7 | 80 | 1265091 | 7849.05 | 618 | 603 | 161.1 |
| D | 8 | 195 | 972831 | 6034.91 | 618 | 603 | 161.1 |
| D | 1 | 52 | 346313 | 2145.92 | 618 | 603 | 161.1 |
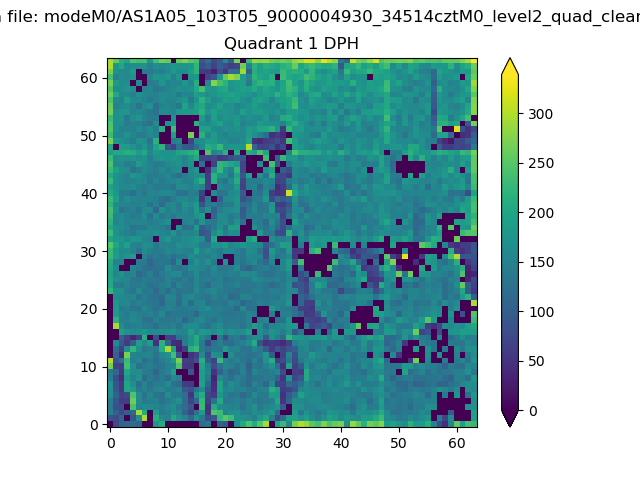
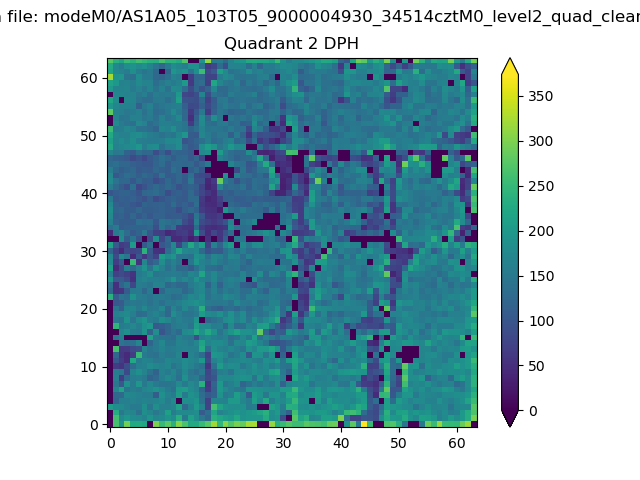
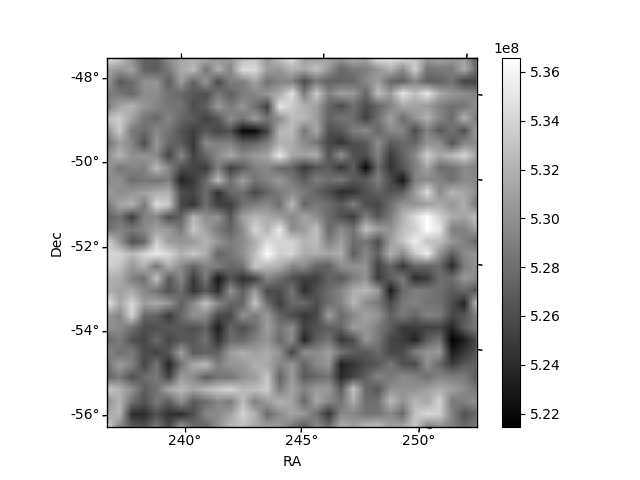
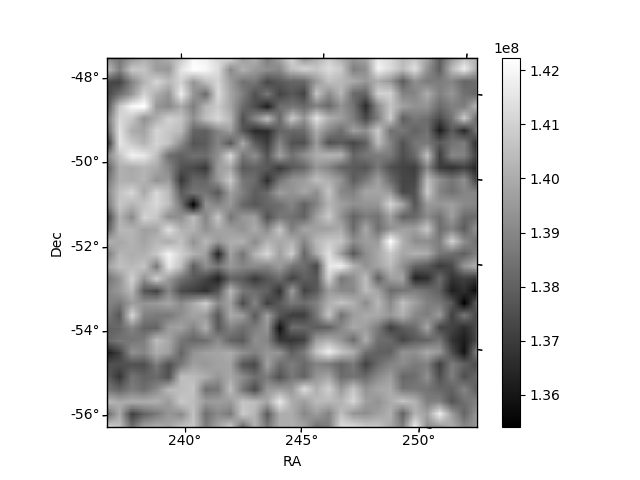
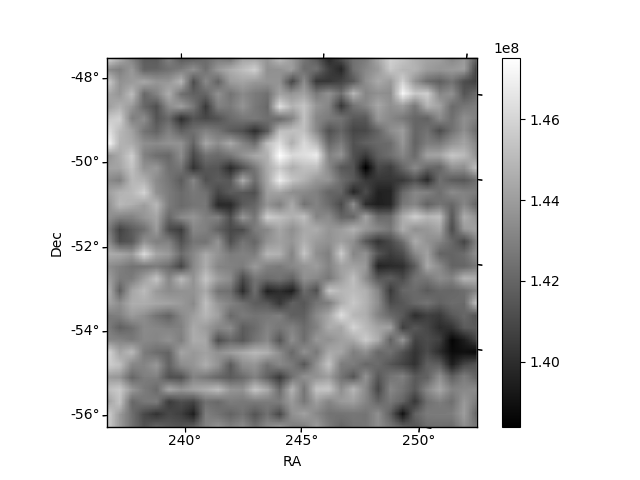
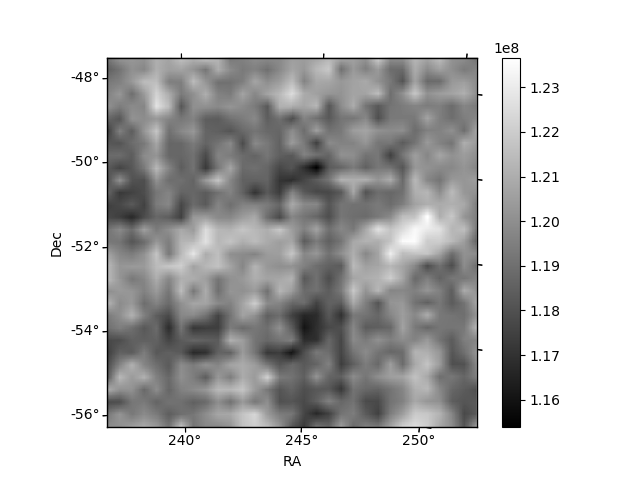
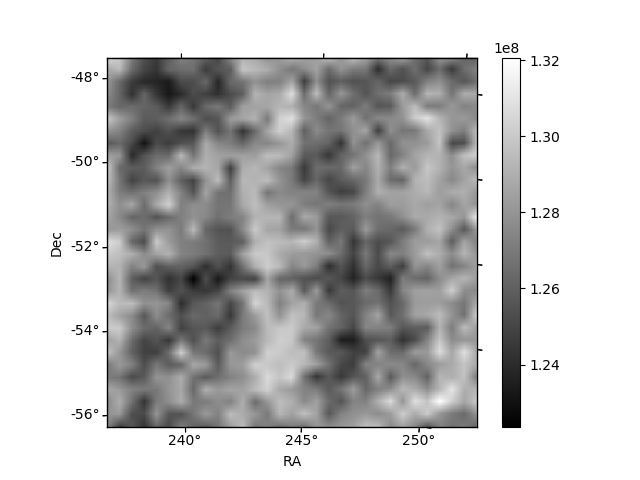
Histogram calculated using DETX and DETY for each event in the final _common_clean file
| Quadrant A | 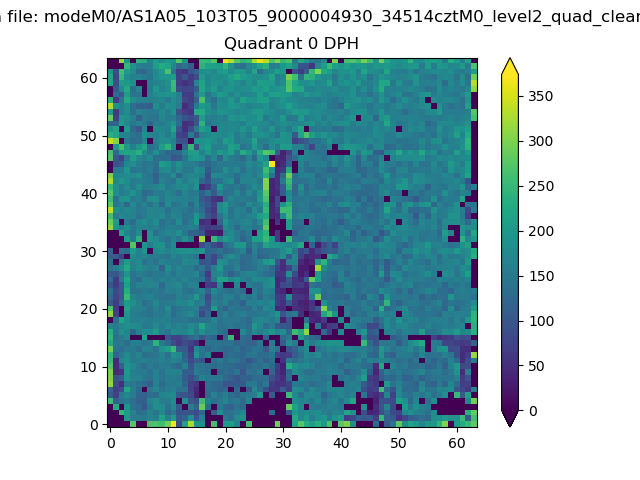 |
 |
Quadrant B |
|---|---|---|---|
| Quadrant D | 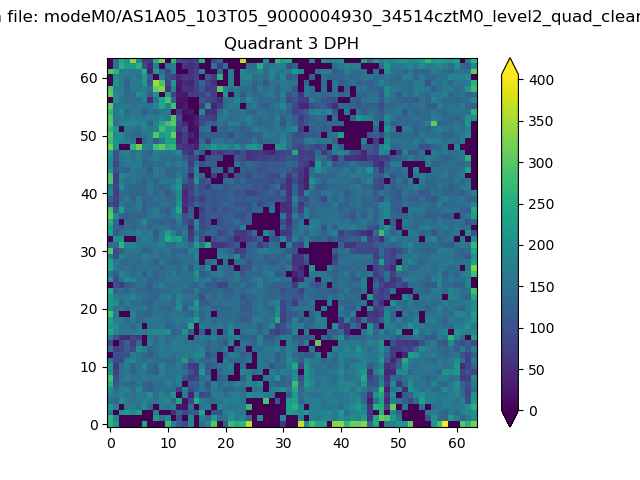 |
 |
Quadrant C |
| Plot type | Count rate plots | Images |
|---|---|---|
| Comparison with Poisson distribution Blue bars denote a histogram of data divided into 1 sec bins. Red curve is a Poisson curve with rate = median count rate of data. |
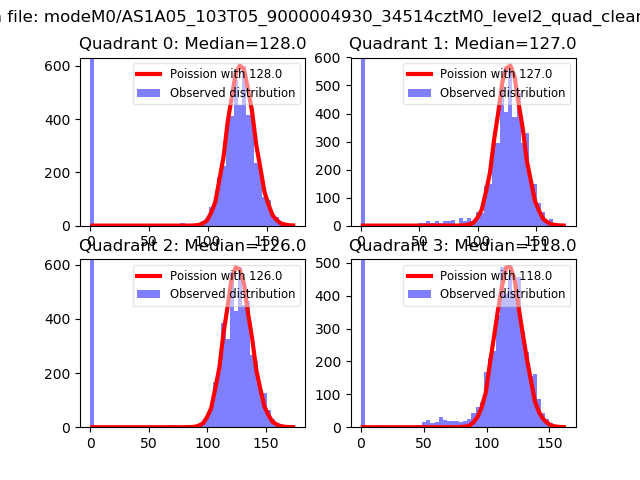 |
 |
| Quadrant-wise count rates Data is divided into 100 sec bins |
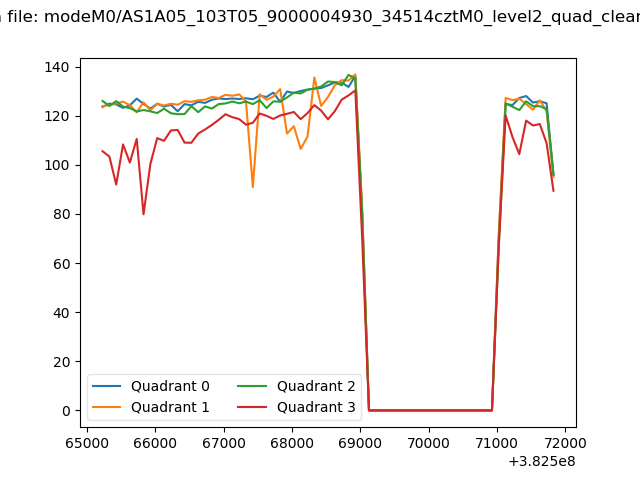 |
|
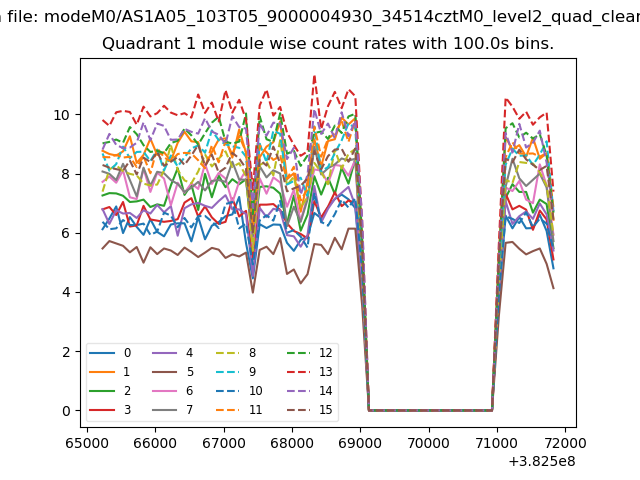
| Module-wise count rates for Quadrant A Data is divided into 100 sec bins |
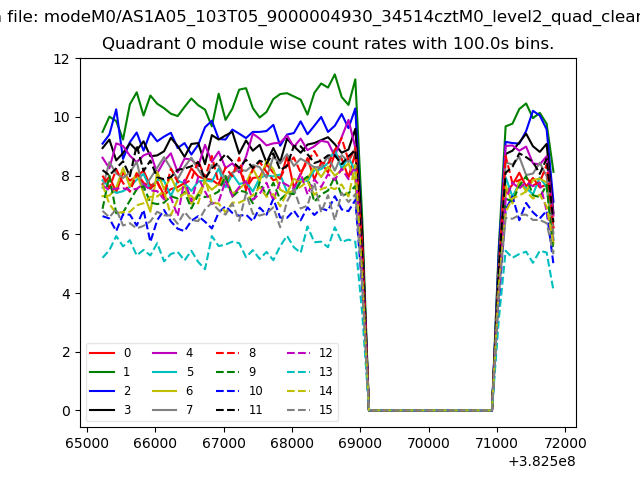 |
 |
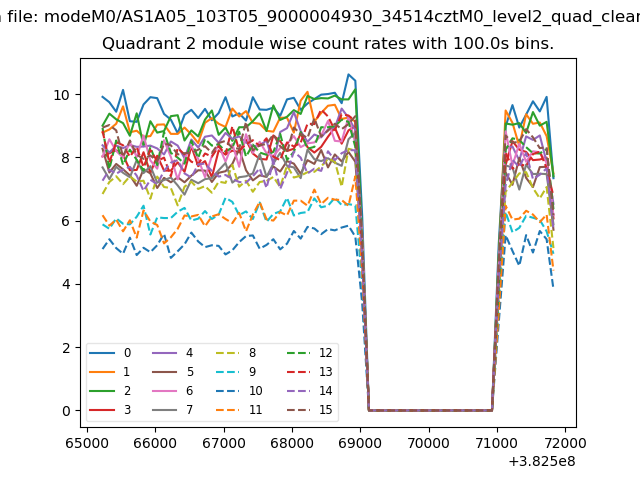
| Module-wise count rates for Quadrant B Data is divided into 100 sec bins |
 |
 |
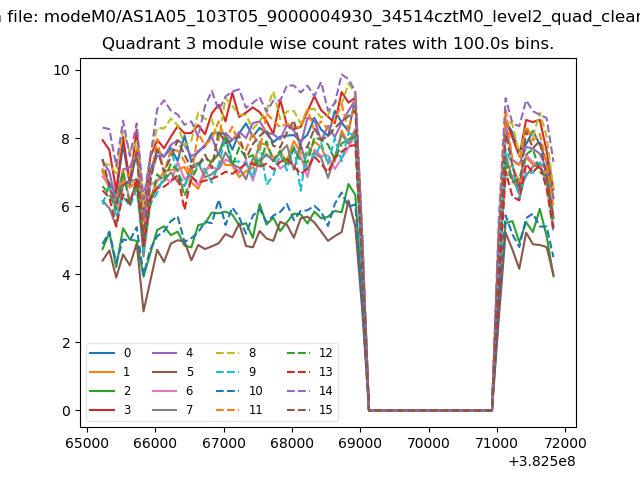
| Module-wise count rates for Quadrant C Data is divided into 100 sec bins |
 |
 |
| Module-wise count rates for Quadrant D Data is divided into 100 sec bins |
 |
 |
| Parameter | Plot |
|---|---|
| CZT HV Monitor | 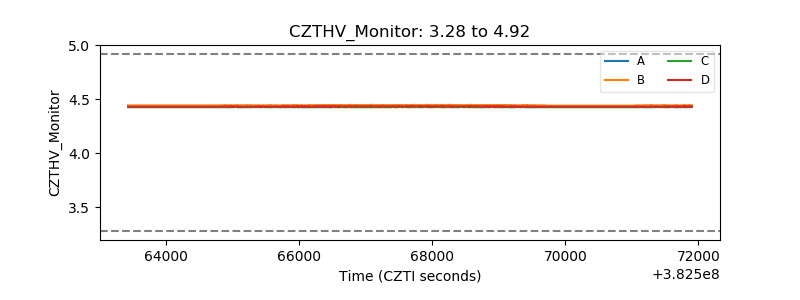 |
| D_VDD | 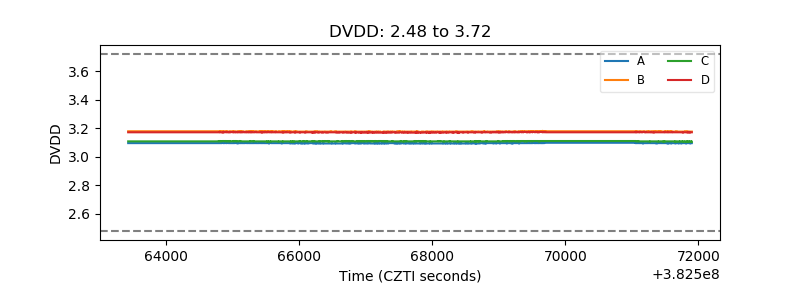 |
| Temperature 1 | 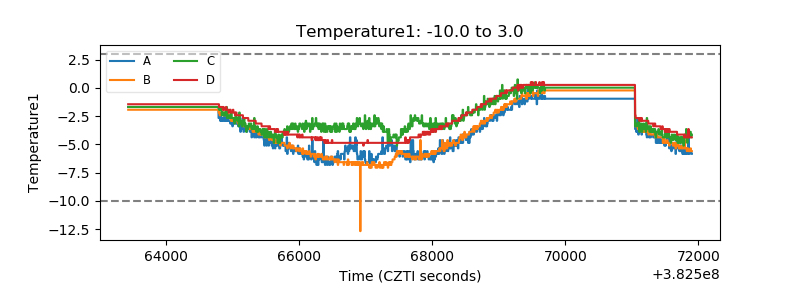 |
| Veto HV Monitor |  |
| Veto LLD | 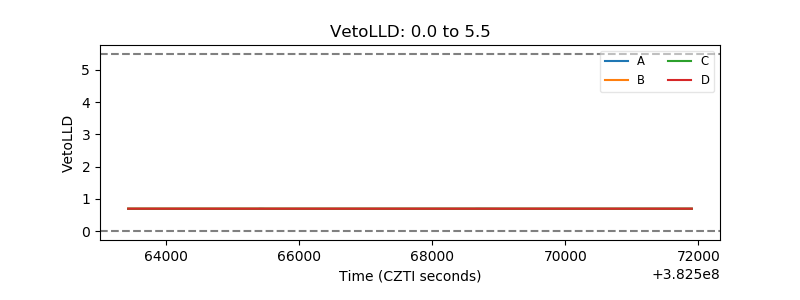 |
| Alpha Counter | 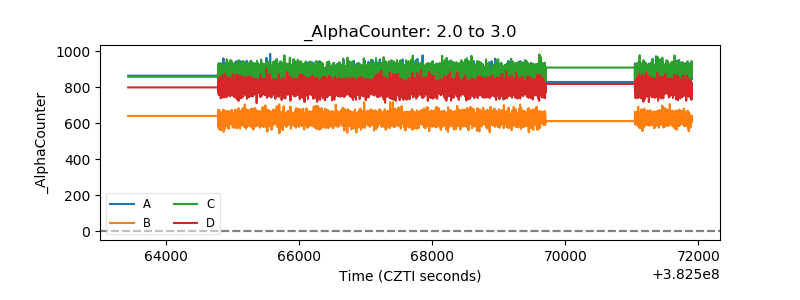 |
| _CPM_Rate | 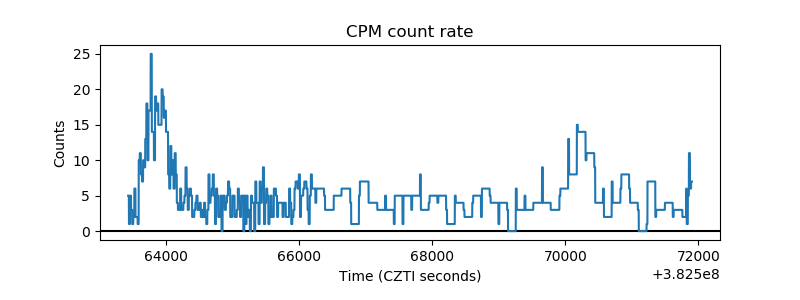 |
| CZT Counter | 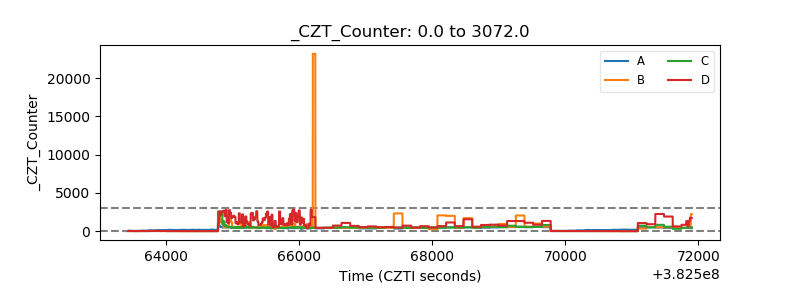 |
| +2.5 Volts monitor | 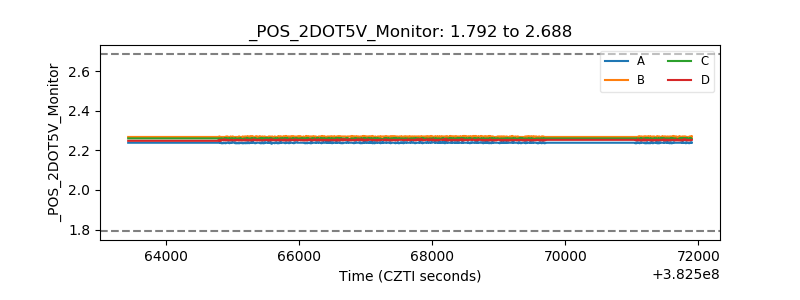 |
| +5 Volts monitor | 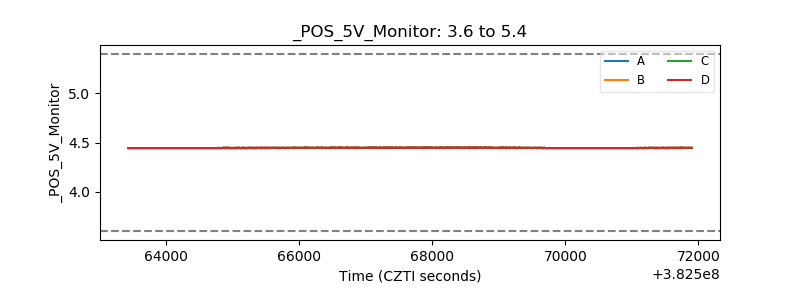 |
| _ROLL_ROT | 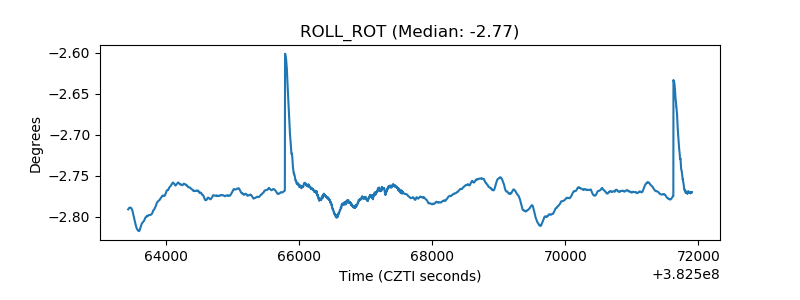 |
| _Roll_DEC | 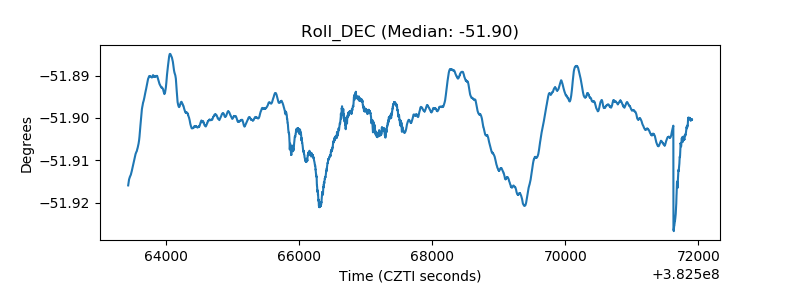 |
| _Roll_RA | 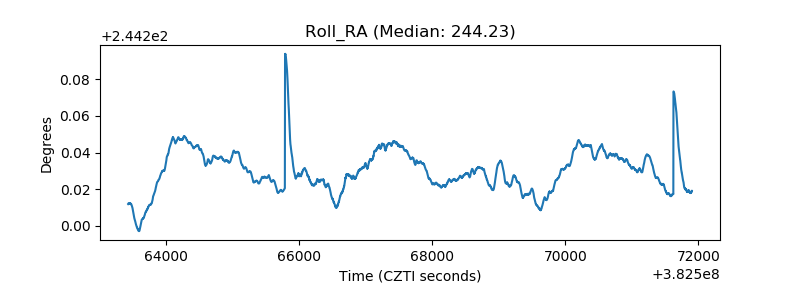 |
| Veto Counter | 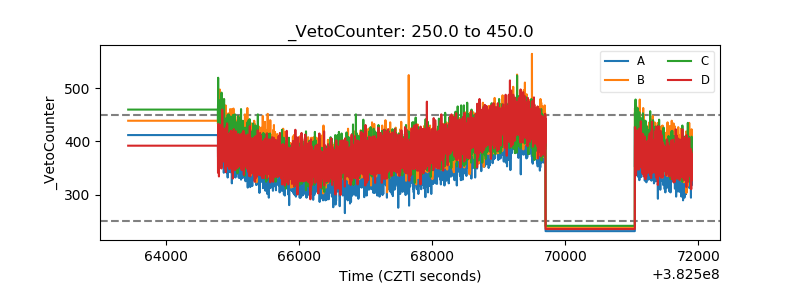 |