| Param | Original file | Final file |
|---|---|---|
| Filename | modeM0/AS1A05_103T05_9000004930_34513cztM0_level2.evt | modeM0/AS1A05_103T05_9000004930_34513cztM0_level2_quad_clean.evt |
| Size (bytes) | 495,722,880 | 83,851,200 |
| Size | 472.8 MB | 80.0 MB |
| Events in quadrant A | 2,691,982 | 551,873 |
| Events in quadrant B | 3,378,339 | 547,018 |
| Events in quadrant C | 3,069,324 | 547,110 |
| Events in quadrant D | 5,492,631 | 500,837 |
| Mode M9 | |||
|---|---|---|---|
| Quadrant | BADHDUFLAG | Total packets | Discarded packets |
| A | 0 | 26 | 0 |
| B | 0 | 26 | 0 |
| C | 0 | 26 | 0 |
| D | 0 | 27 | 0 |
| Mode M0 | |||
|---|---|---|---|
| Quadrant | BADHDUFLAG | Total packets | Discarded packets |
| A | 0 | 11695 | 3 |
| B | 0 | 13635 | 2 |
| C | 0 | 12348 | 2 |
| D | 0 | 20152 | 2 |
| Mode SS | |||
|---|---|---|---|
| Quadrant | BADHDUFLAG | Total packets | Discarded packets |
| A | 0 | 114 | 0 |
| B | 0 | 114 | 0 |
| C | 0 | 114 | 0 |
| D | 0 | 114 | 0 |
| Quadrant | Total seconds | Saturated seconds | Saturation percentage |
|---|---|---|---|
| A | 5611 | 25 | 0.445553% |
| B | 5611 | 127 | 2.263411% |
| C | 5611 | 77 | 1.372304% |
| D | 5611 | 810 | 14.435929% |
Noise dominated data is calculated using 1-second bins in cleaned event files. If a bin has >2000 counts, and if more than 50% of those come from <1% of pixels, then it is considered to be noise-dominated and hence unusable.
| Quadrant | # 1 sec bins | Bins with >0 counts | Bins with >2000 counts | High rate bins dominated by noise | Noise dominated (total time) | Noise dominated (detector-on time) | Marked lightcurve |
|---|---|---|---|---|---|---|---|
| A | 7104 | 5612 | 15 | 15 | 0.21% | 0.27% | 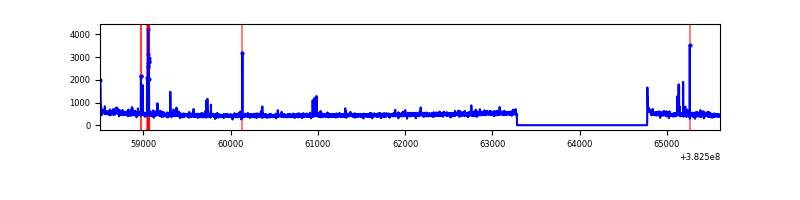 |
| B | 7104 | 5612 | 81 | 81 | 1.14% | 1.44% | 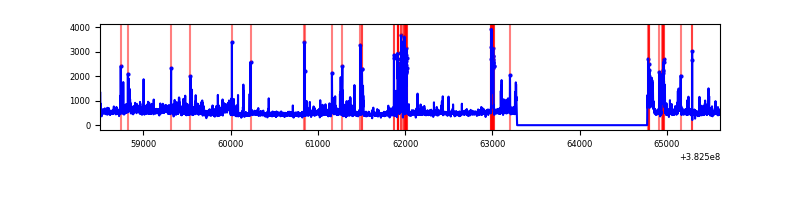 |
| C | 7104 | 5612 | 53 | 53 | 0.75% | 0.94% |  |
| D | 7104 | 5612 | 692 | 692 | 9.74% | 12.33% | 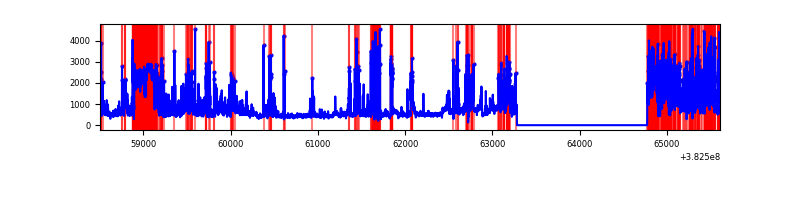 |
Top three noisy pixels from each quadrant. If the there are fewer than three noisy pixels in the level2.evt file, extra rows are filled as -1
| Pixel properties | Quadrant properties | ||||||
|---|---|---|---|---|---|---|---|
| Quadrant | DetID | PixID | Counts | Sigma | Mean | Median | Sigma |
| A | 10 | 83 | 42100 | 316.46 | 651 | 640 | 131.0 |
| A | 9 | 143 | 38501 | 288.99 | 651 | 640 | 131.0 |
| A | 3 | 15 | 33554 | 251.23 | 651 | 640 | 131.0 |
| B | 5 | 172 | 267758 | 2179.78 | 643 | 628 | 122.5 |
| B | 0 | 190 | 228732 | 1861.33 | 643 | 628 | 122.5 |
| B | 4 | 232 | 100655 | 816.22 | 643 | 628 | 122.5 |
| C | 15 | 214 | 238149 | 1597.97 | 633 | 635 | 148.6 |
| C | 0 | 10 | 207164 | 1389.5 | 633 | 635 | 148.6 |
| C | 14 | 67 | 102835 | 687.59 | 633 | 635 | 148.6 |
| D | 7 | 80 | 1103132 | 7273.7 | 579 | 566 | 151.6 |
| D | 13 | 249 | 641850 | 4230.59 | 579 | 566 | 151.6 |
| D | 8 | 195 | 451742 | 2976.44 | 579 | 566 | 151.6 |
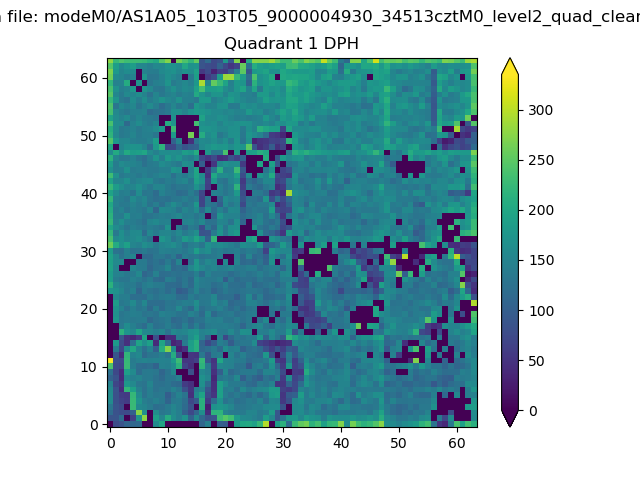
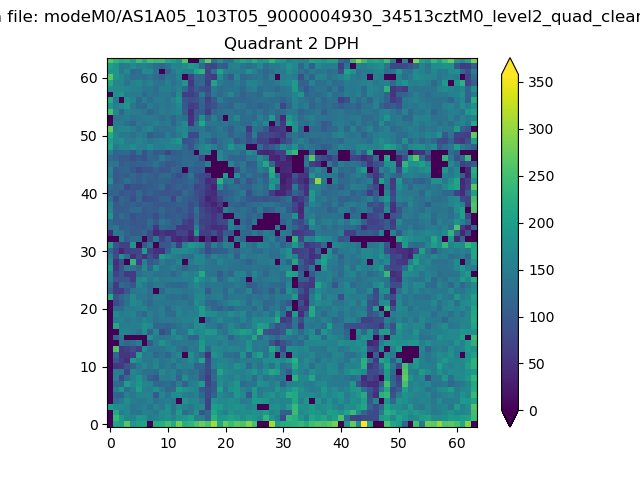
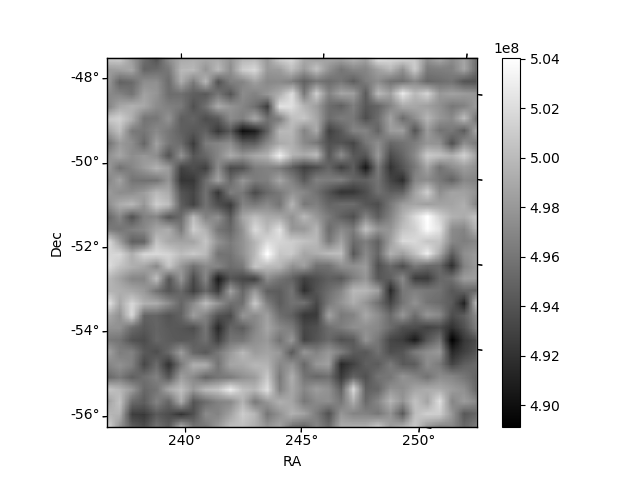
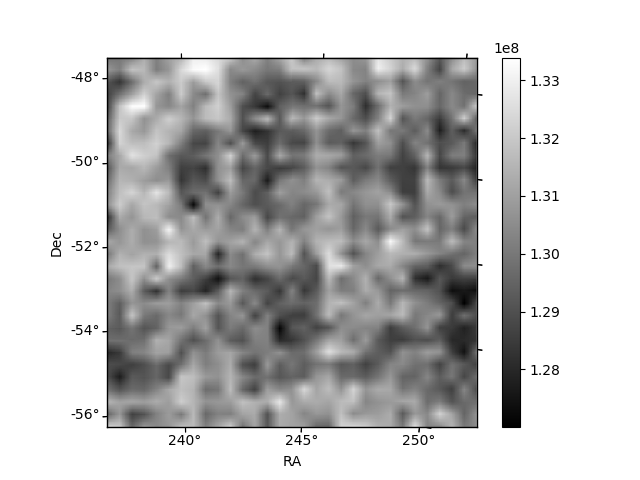
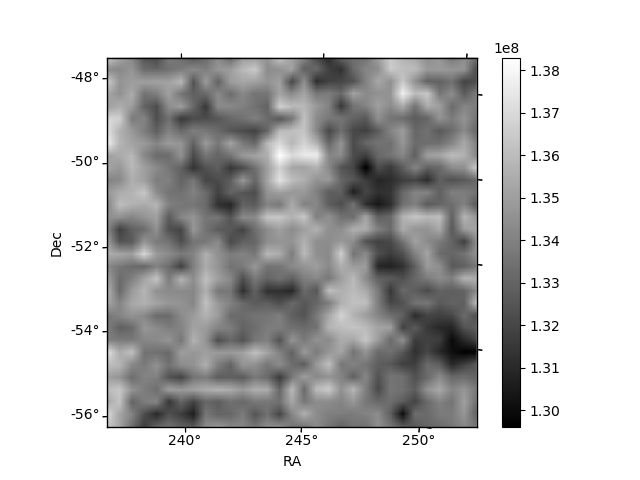
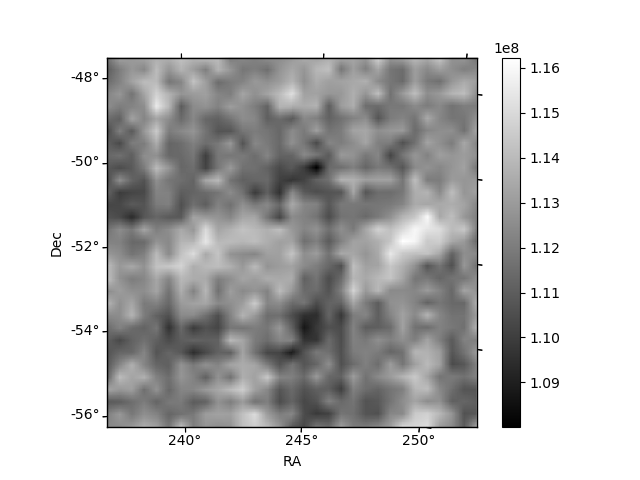
Histogram calculated using DETX and DETY for each event in the final _common_clean file
| Quadrant A | 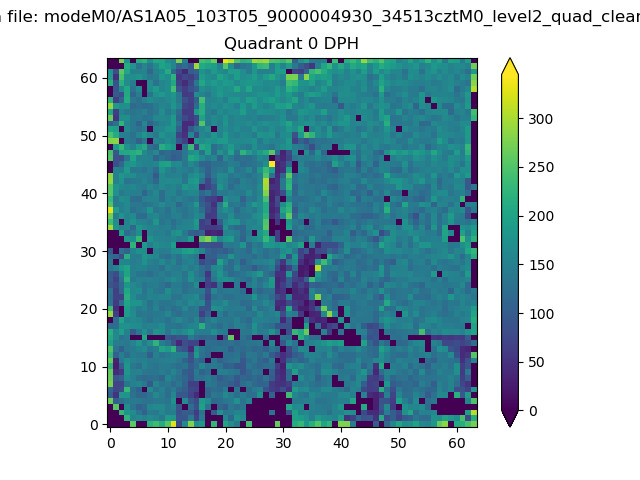 |
 |
Quadrant B |
|---|---|---|---|
| Quadrant D | 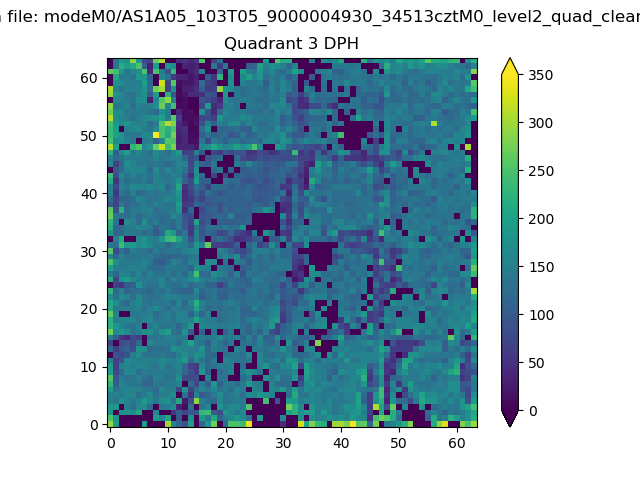 |
 |
Quadrant C |
| Plot type | Count rate plots | Images |
|---|---|---|
| Comparison with Poisson distribution Blue bars denote a histogram of data divided into 1 sec bins. Red curve is a Poisson curve with rate = median count rate of data. |
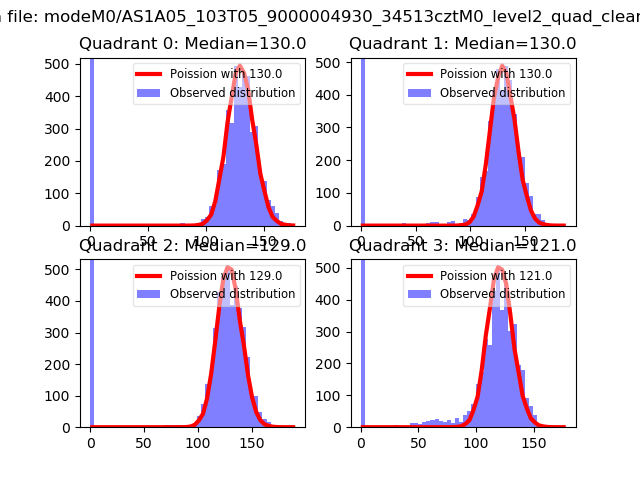 |
 |
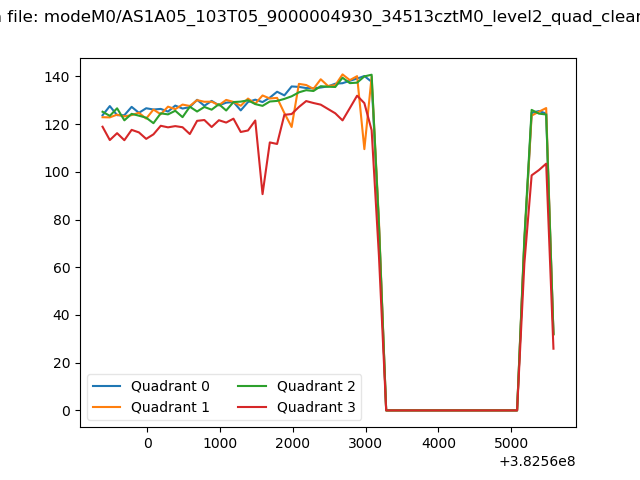
| Quadrant-wise count rates Data is divided into 100 sec bins |
 |
|
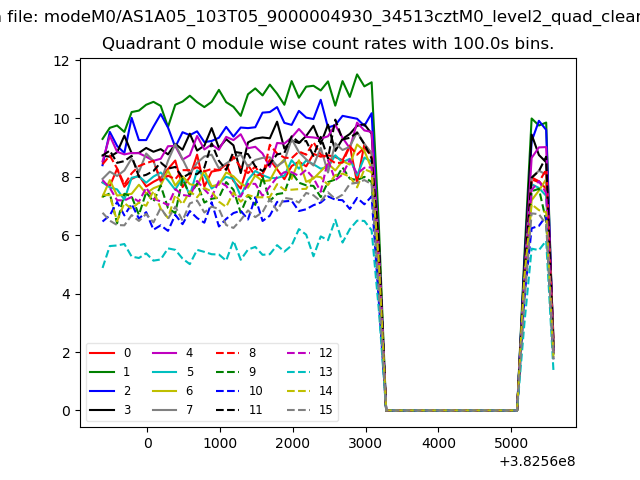
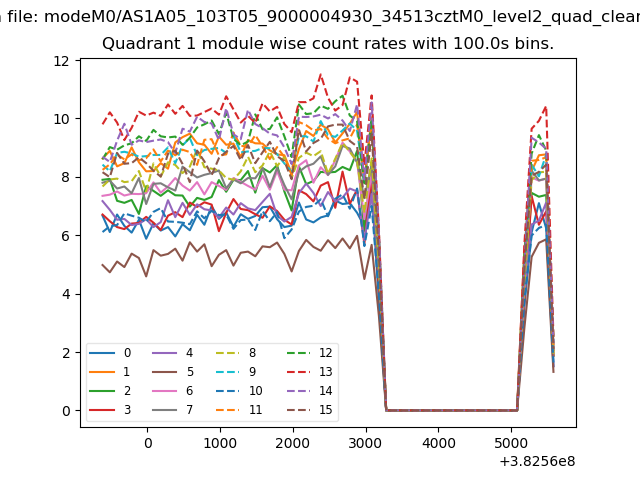
| Module-wise count rates for Quadrant A Data is divided into 100 sec bins |
 |
 |
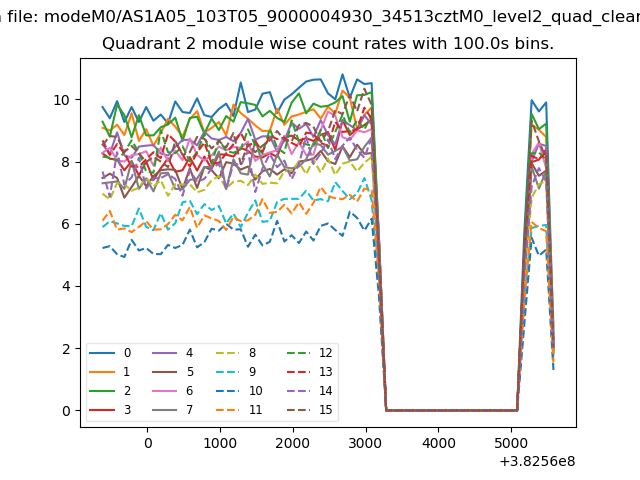
| Module-wise count rates for Quadrant B Data is divided into 100 sec bins |
 |
 |
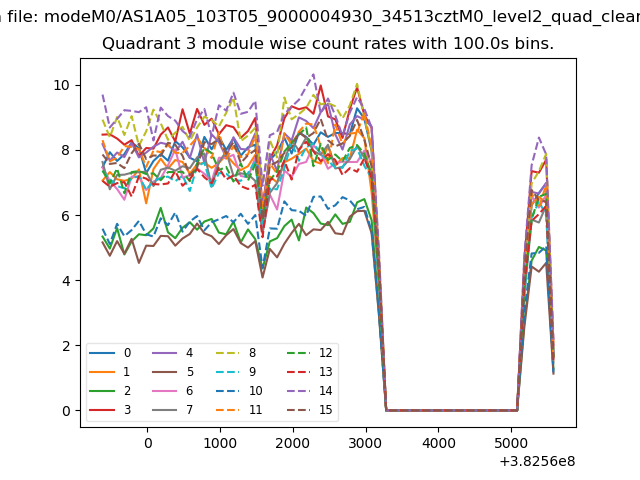
| Module-wise count rates for Quadrant C Data is divided into 100 sec bins |
 |
 |
| Module-wise count rates for Quadrant D Data is divided into 100 sec bins |
 |
 |
| Parameter | Plot |
|---|---|
| CZT HV Monitor | 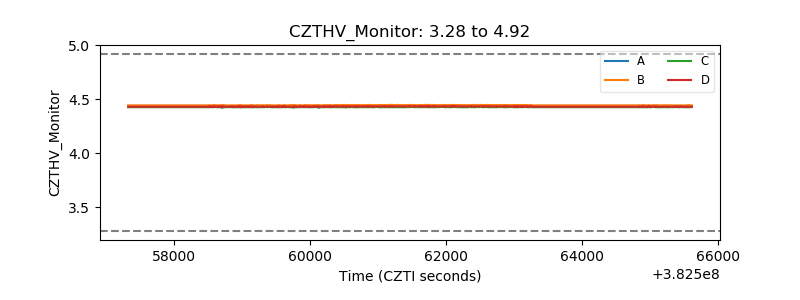 |
| D_VDD | 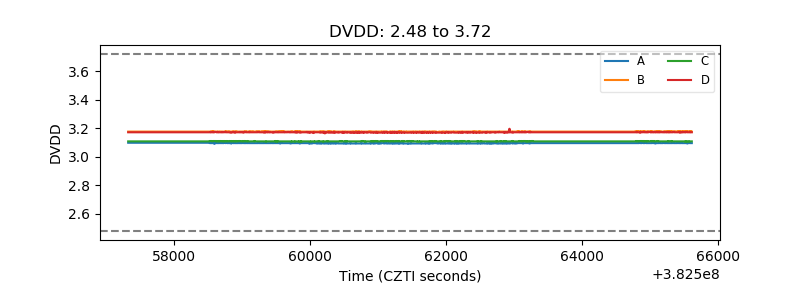 |
| Temperature 1 | 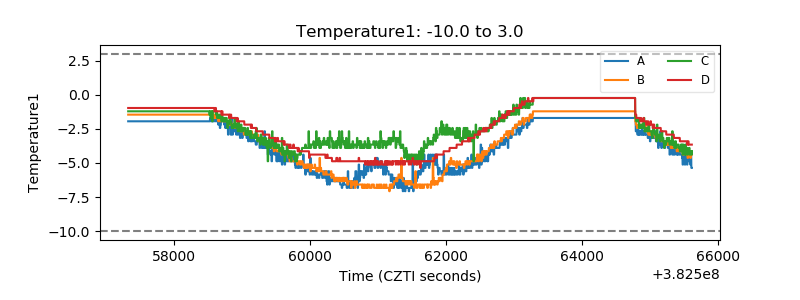 |
| Veto HV Monitor | 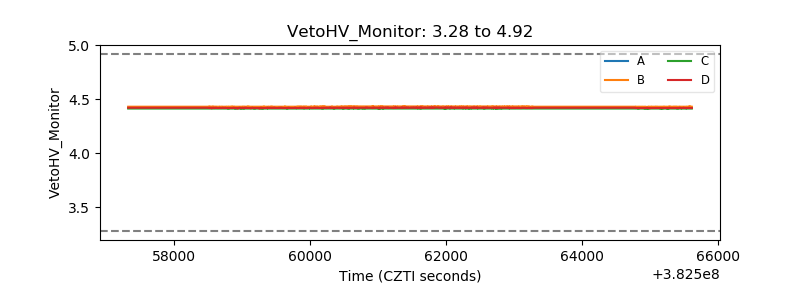 |
| Veto LLD | 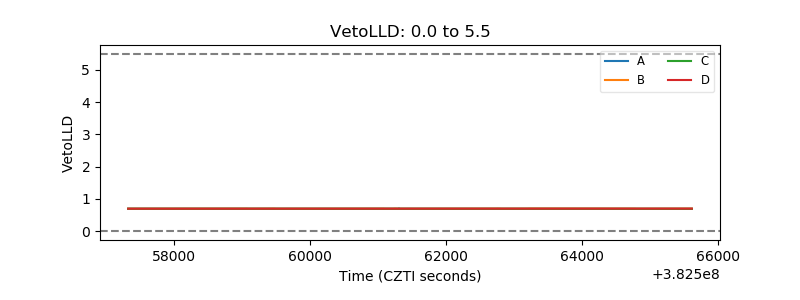 |
| Alpha Counter | 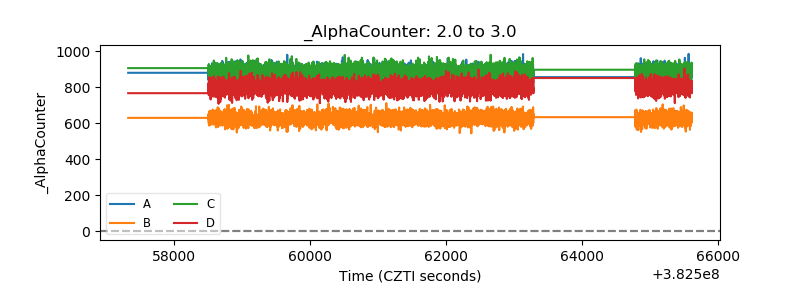 |
| _CPM_Rate | 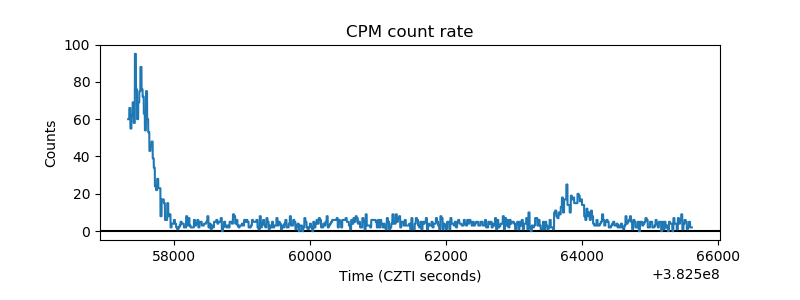 |
| CZT Counter | 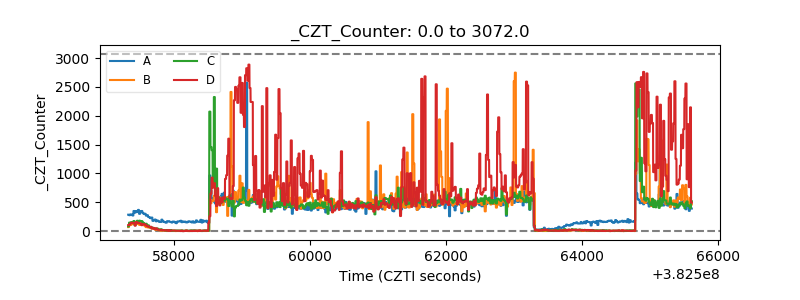 |
| +2.5 Volts monitor | 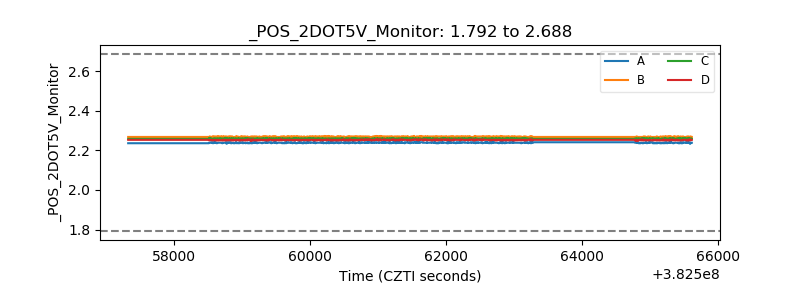 |
| +5 Volts monitor | 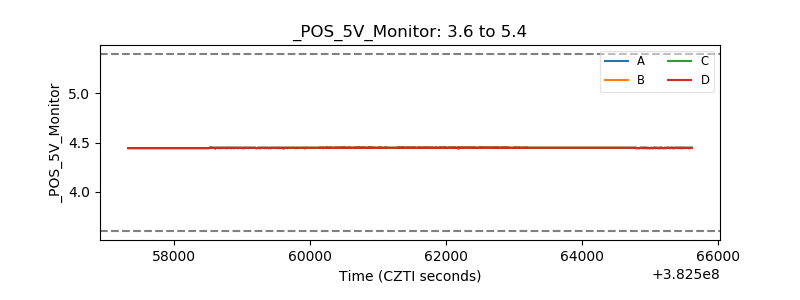 |
| _ROLL_ROT | 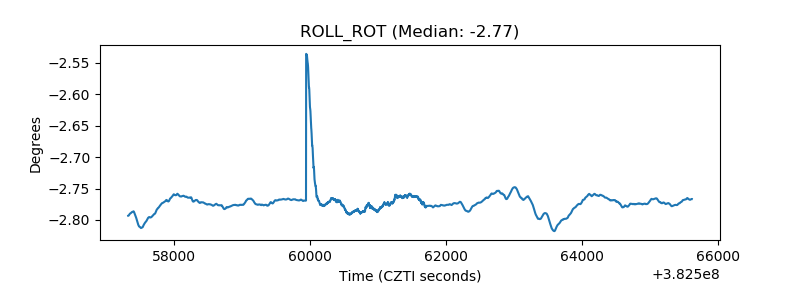 |
| _Roll_DEC | 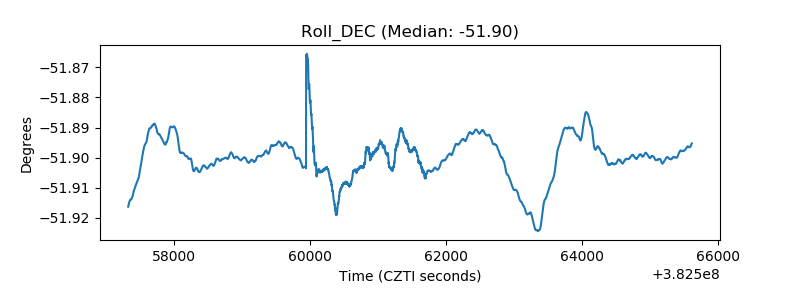 |
| _Roll_RA | 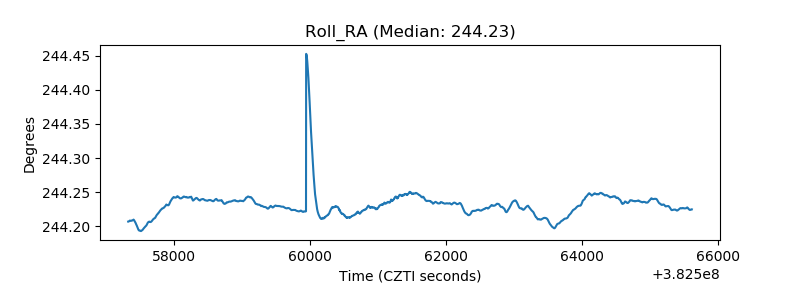 |
| Veto Counter | 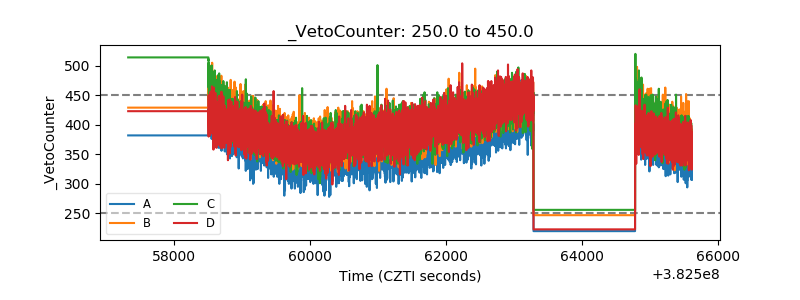 |